2012 United States presidential election in Minnesota

Last updated

2012 United States presidential election in Minnesota
Flag of Minnesota.svg
  2008 November 6, 2012 2016  
Turnout76.42% [1] Decrease2.svg
  President Barack Obama, 2012 portrait crop.jpg Mitt Romney by Gage Skidmore 6 cropped.jpg
Nominee Barack Obama Mitt Romney
Party Democratic (DFL) Republican
Home state Illinois Massachusetts
Running mate Joe Biden Paul Ryan
Electoral vote100
Popular vote1,546,1671,320,225
Percentage52.65%44.96%

Minnesota Presidential Election Results 2012.svg
MN President 2012.svg

President before election

Barack Obama
Democratic

Elected President

Barack Obama
Democratic

The 2012 United States presidential election in Minnesota took place on November 6, 2012, as part of the 2012 United States presidential election in which all 50 states plus the District of Columbia participated. State voters chose ten electors to represent them in the Electoral College via a popular vote pitting incumbent Democratic President Barack Obama and his running mate, Vice President Joe Biden, against Republican challenger and former Massachusetts Governor Mitt Romney and his running mate, Congressman Paul Ryan.

Contents

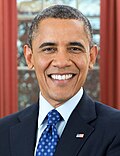
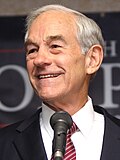
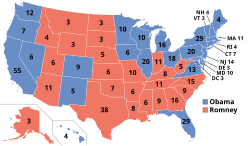
Minnesota backed Obama for re-election, giving him 52.65% of the vote, while Republican challenger Mitt Romney took 44.96%, a victory margin of 7.69%. With ten Democratic wins in a row, Minnesota has the longest current streak of voting for the Democratic candidate in presidential elections of any state, having not voted Republican since Richard Nixon in 1972. This is the longest streak for the Democrats in history amongst non-Southern states. [2]

However, Romney was able to significantly improve on McCain's performance in Minnesota, as he did nationally. Fourteen counties that voted for Obama in 2008 flipped and voted for the Republican Party in 2012, while many Democratic counties had a margin of victory much narrower than in 2008. Many of these counties had not voted for a Republican in decades, such as Big Stone County, as well as Pine County. Obama thus became the first Democrat to win the White House without carrying Big Stone County since Grover Cleveland in 1892. [3] Obama also became the first ever Democrat to win the White House without carrying Red Lake County, as well as the first to do so without carrying Lincoln, Marshall, Pennington, or Polk Counties since Woodrow Wilson in 1912, the first to do so without carrying Grant or Pine Counties since Woodrow Wilson in 1916.

As of the 2020 presidential election, this is the last time the Democratic candidate won the following counties: Beltrami, Chippewa, Fillmore, Freeborn, Houston, Itasca, Kittson, Koochiching, Lac qui Parle, Mahnomen, Mower, Norman, Rice, Swift, and Traverse.

Caucuses

Democratic caucuses

2012 Minnesota Democratic presidential caucus
Flag of Minnesota.svg
  2008 February 7, 2012 (2012-02-07) 2016  
  President Barack Obama, 2012 portrait crop.jpg
Candidate Barack Obama
Home state Illinois
Delegate count91
Popular vote16,733
Percentage96.3%

Minnesota Democratic presidential caucus election results, 2012.svg
Minnesota results by county
  Barack Obama
  No votes
2012 Minnesota Democratic caucus [4]
CandidateVotesPercentageDelegates
America Symbol.svg Barack Obama 16,73396.30%91
Uncommited6433.70%0

Republican caucuses

2012 Minnesota Republican presidential caucus
Flag of Minnesota.svg
  2008 February 7, 2012 (2012-02-07) 2016  
  Rick Santorum by Gage Skidmore.jpg Ron Paul by Gage Skidmore 3 (crop 2).jpg
Candidate Rick Santorum Ron Paul
Home state Pennsylvania Texas
Popular vote21,98813,282
Percentage44.95%27.15%

  Mitt Romney by Gage Skidmore 6 cropped.jpg Newt Gingrich by Gage Skidmore 3 (cropped).jpg
Candidate Mitt Romney Newt Gingrich
Home state Massachusetts Georgia
Popular vote8,2405,263
Percentage16.85%10.76%

Minnesota Republican Presidential Caucuses Results by County, 2012.svg
Minnesota results by county
  Rick Santorum
  Ron Paul
  Tie

The Republican caucuses were held on February 7, 2012. [5] The events coincided with the Colorado Republican caucuses as well as the Missouri Republican primary. Minnesota has a total of 40 delegates, 37 of which are tied to the caucuses while 3 are unpledged RNC delegates. The non-binding straw poll was won by Rick Santorum, but Ron Paul won 32 of the 40 delegates to the Republican National Convention.

Election Reporting [6] [7] [8] [9] [10]
CandidateVotesDelegates
TotalPercentageTotalPercentage
Rick Santorum 21,98844.95%25%
America Symbol.svg Ron Paul 13,28227.15%3280%
Mitt Romney 8,24016.85%12.5%
Newt Gingrich 5,26310.76%00%
Write-in1430.29%00%
Unpledged delegates:512.5%
Total:48,916100.0%40100.0%

Conventions

There is no formal system of allocating delegates to candidates in any step of the election process. At each meeting the participants decides what the best course of action is. The state convention can vote to bind the 13 at-large delegates to a candidate. The 24 delegates elected at the CD conventions and the 3 automatic (RNC) delegates are not legally bound to vote for a candidate.

  • 17 February - 31 March: BPOU conventions elect delegates to the state convention and the congressional district conventions.
  • 14–21 April: Eight congressional conventions elect 3 National Convention delegates each.
  • 18–19 May: State convention elect 13 National Convention delegates. [11]
Convention Results [7] [9] [10]
Candidate1st2nd3rd4th5th6th7th8thStateParty
leaders
Total
America Symbol.svg Ron Paul 2333331212032
Rick Santorum 00000020002
Mitt Romney 00000000101
Unknown1135
Total2413340

General election

Results

2012 United States presidential election in Minnesota [12]
PartyCandidateRunning mateVotesPercentageElectoral votes
Democratic (DFL) Barack Obama Joe Biden 1,546,16752.65%10
Republican Mitt Romney Paul Ryan 1,320,22544.96%0
Libertarian Gary Johnson Jim Gray 35,0981.20%0
Green Jill Stein Cheri Honkala 13,0230.44%0
Constitution Virgil Goode Jim Clymer3,7220.13%0
Grassroots Jim Carlson George McMahon3,1490.11%0
Justice Rocky Anderson Luis J. Rodriguez 1,9960.07%0
Constitutional GovernmentDean MorstadJosh Franke-Hyland1,0920.04%0
Socialist Workers James Harris Maura DeLuca 1,0510.04%0
Socialism and Liberation Peta Lindsay Yari Osorio 3970.01%0
Write-Ins10,6410.36%0
Totals2,936,561100.00%10
Voter turnout (eligible voters)75.74%

By county

CountyBarack Obama
DFL
Mitt Romney
Republican
Various candidates
Other parties
MarginTotal votes cast
# %# %# %# %
Aitkin 4,41248.26%4,53349.58%1972.16%-121-1.32%9,142
Anoka 88,61447.52%93,43050.11%4,4212.37%-4,816-2.59%186,465
Becker 6,82941.69%9,20456.18%3492.13%-2,375-14.49%16,382
Beltrami 11,81853.59%9,63743.70%5962.71%2,1819.89%22,051
Benton 8,17341.66%10,84955.30%5973.04%-2,676-13.64%19,619
Big Stone 1,34548.23%1,38549.66%592.11%-40-1.43%2,789
Blue Earth 18,16453.00%14,91643.52%1,1943.48%3,2489.48%34,274
Brown 5,63040.42%7,93856.99%3612.59%-2,308-16.57%13,929
Carlton 11,38961.78%6,58635.72%4612.50%4,80326.06%18,436
Carver 20,74539.22%31,15558.90%9991.88%-10,410-19.68%52,899
Cass 6,85842.49%8,95755.49%3262.02%-2,099-13.00%16,141
Chippewa 3,08349.72%2,96747.85%1512.43%1161.87%6,201
Chisago 12,52442.54%16,22755.12%6902.34%-3,703-12.58%29,441
Clay 15,20852.65%12,92044.73%7582.62%2,2887.92%28,886
Clearwater 1,75341.77%2,35956.21%852.02%-606-14.44%4,197
Cook 1,99359.99%1,22136.75%1083.26%77223.24%3,322
Cottonwood 2,43341.50%3,31656.57%1131.93%-883-15.07%5,862
Crow Wing 14,76042.27%19,41555.60%7452.13%-4,655-13.33%34,920
Dakota 116,25550.37%109,51647.45%5,0502.18%6,7392.92%230,821
Dodge 4,48743.45%5,52253.47%3183.08%-1,035-10.02%10,327
Douglas 8,65341.30%11,88456.72%4161.98%-3,231-15.42%20,953
Faribault 3,40744.17%4,10453.21%2022.62%-697-9.04%7,713
Fillmore 5,71352.45%4,91345.11%2662.44%8007.34%10,892
Freeborn 9,32655.82%6,96941.72%4112.46%2,35714.10%16,706
Goodhue 12,21247.33%12,98650.33%6032.34%-774-3.00%25,801
Grant 1,64747.23%1,74850.13%922.64%-101-2.90%3,487
Hennepin 423,98262.34%240,07335.30%16,0102.36%183,90927.04%680,065
Houston 5,28150.56%4,95147.40%2142.04%3303.16%10,446
Hubbard 4,67640.59%6,62257.48%2221.93%-1,946-16.89%11,520
Isanti 8,02439.69%11,67557.75%5182.56%-3,651-18.06%20,217
Itasca 12,85253.73%10,50143.90%5662.37%2,3519.83%23,919
Jackson 2,26841.77%3,04456.06%1182.17%-776-14.29%5,430
Kanabec 3,59344.09%4,32853.10%2292.81%-735-9.01%8,150
Kandiyohi 9,80545.68%11,24052.36%4201.96%-1,435-6.68%21,465
Kittson 1,24151.28%1,09545.25%843.47%1466.03%2,420
Koochiching 3,45153.44%2,84143.99%1662.57%6109.45%6,458
Lac qui Parle 1,97449.55%1,93848.64%721.81%360.91%3,984
Lake 4,04359.28%2,61038.27%1672.45%1,43321.01%6,820
Lake of the Woods 85938.45%1,30658.46%693.09%-447-20.01%2,234
Le Sueur 6,75345.64%7,71552.15%3272.21%-962-6.51%14,795
Lincoln 1,42945.80%1,59551.12%963.08%-166-5.32%3,120
Lyon 5,46544.12%6,59453.23%3292.65%-1,129-9.11%12,388
Mahnomen 1,27658.48%87139.92%351.60%40518.56%2,182
Marshall 1,99842.53%2,56954.68%1312.79%-571-12.15%4,698
Martin 4,05436.96%6,65760.69%2572.35%-2,603-23.73%10,968
McLeod 6,96837.56%11,06959.66%5162.78%-4,101-22.10%18,553
Meeker 4,96940.68%6,91356.60%3322.72%-1,944-15.92%12,214
Mille Lacs 5,82944.53%6,95153.10%3112.37%-1,122-8.57%13,091
Morrison 6,15336.81%10,15960.78%4022.41%-4,006-23.97%16,714
Mower 11,12960.03%6,93837.42%4722.55%4,19122.61%18,539
Murray 2,16045.31%2,50452.53%1032.16%-344-7.22%4,767
Nicollet 9,65252.58%8,21444.75%4912.67%1,4387.83%18,357
Nobles 3,79344.52%4,58153.77%1461.71%-788-9.25%8,520
Norman 1,73053.94%1,38443.16%932.90%34610.78%3,207
Olmsted 39,33850.23%36,83247.03%2,1462.74%2,5063.20%78,316
Otter Tail 12,16538.41%18,86059.55%6452.04%-6,695-21.14%31,670
Pennington 3,02446.40%3,30550.71%1882.89%-281-4.31%6,517
Pine 6,75048.34%6,84549.02%3702.64%-95-0.68%13,965
Pipestone 1,72537.13%2,82660.83%952.04%-1,101-23.70%4,646
Polk 6,77346.10%7,61551.83%3052.07%-842-5.73%14,693
Pope 2,98147.73%3,14250.30%1231.97%-161-2.57%6,246
Ramsey 184,93866.33%86,80031.13%7,0842.54%98,13835.20%278,822
Red Lake 92846.99%97849.52%693.49%-50-2.53%1,975
Redwood 3,00838.61%4,57058.66%2122.73%-1,562-20.05%7,790
Renville 3,39444.02%4,14953.81%1672.17%-755-9.79%7,710
Rice 17,05452.85%14,38444.58%8292.57%2,6708.27%32,267
Rock 1,94640.16%2,81057.99%901.85%-864-17.83%4,846
Roseau 2,77237.70%4,40959.97%1712.33%-1,637-22.27%7,352
St. Louis 73,37863.48%39,13133.85%3,0852.67%34,24729.63%115,594
Scott 29,71241.47%40,32356.28%1,6122.25%-10,611-14.81%71,647
Sherburne 17,59737.84%27,84859.88%1,0642.28%-10,251-22.04%46,509
Sibley 2,91637.31%4,69360.05%2062.64%-1,777-22.74%7,815
Stearns 33,55142.75%43,01554.81%1,9112.44%-9,464-12.06%78,477
Steele 8,70645.52%9,90351.78%5152.70%-1,197-6.26%19,124
Stevens 2,74248.51%2,76648.94%1442.55%-24-0.43%5,652
Swift 2,75153.74%2,24843.91%1202.35%5039.83%5,119
Todd 4,81940.83%6,71956.93%2652.24%-1,900-16.10%11,803
Traverse 94351.06%86146.62%432.32%824.44%1,847
Wabasha 5,41546.03%6,04951.42%2992.55%-634-5.39%11,763
Wadena 2,49236.70%4,14361.01%1562.29%-1,651-24.31%6,791
Waseca 4,37044.83%5,11652.49%2612.68%-746-7.66%9,747
Washington 70,20349.39%69,13748.64%2,7931.97%1,0660.75%142,133
Watonwan 2,49448.48%2,51748.93%1332.59%-23-0.45%5,144
Wilkin 1,25839.04%1,88458.47%802.49%-626-19.43%3,222
Winona 14,98055.01%11,48042.16%7722.83%3,50012.85%27,232
Wright 25,74137.96%40,46659.67%1,6092.37%-14,725-21.71%67,816
Yellow Medicine 2,46545.53%2,80651.83%1432.64%-341-6.30%5,414
Totals1,546,16752.65%1,320,22544.96%70,1692.39%225,9427.69%2,936,561
County Flips:
Democratic
Hold
Republican
Hold
Gain from Democratic Minnesota County Flips 2012.svg
County Flips:

Counties that flipped from Democratic to Republican

Results by congressional district

Obama won 6 of 8 congressional districts, including two held by Republicans. Romney won 2, including one held by a Democrat. [13]

DistrictObamaRomneyRepresentative
1st 49.56%48.21% Tim Walz
2nd 49.07%49.01% John Kline
3rd 49.6%48.8% Erik Paulsen
4th 62.48%35.5% Betty McCollum
5th 73.5%24% Keith Ellison
6th 41.54%56.49% Michele Bachmann
7th 44.13%53.87% Collin Peterson
8th 51.7%46.22% Rick Nolan

See also

Related Research Articles

<span class="mw-page-title-main">2008 United States presidential election in Iowa</span>

The 2008 United States presidential election in Iowa took place on November 4, 2008, as part of the 2008 United States presidential election. Voters chose seven representatives, or electors to the Electoral College, who voted for president and vice president.

<span class="mw-page-title-main">2008 United States presidential election in Minnesota</span>

The 2008 United States presidential election in Minnesota took place on November 4, 2008, and was part of the 2008 United States presidential election. Voters chose ten representatives, or electors to the Electoral College, who voted for president and vice president.

<span class="mw-page-title-main">2012 United States presidential election in Nevada</span>

The 2012 United States presidential election in Nevada took place on November 6, 2012, as part of the 2012 United States presidential election in which all 50 states plus the District of Columbia participated. State voters chose six electors to represent them in the Electoral College via a popular vote pitting incumbent Democratic President Barack Obama and his running mate, Vice President Joe Biden, against Republican challenger and former Massachusetts Governor Mitt Romney and his running mate, Congressman Paul Ryan.

<span class="mw-page-title-main">2012 United States presidential election in Colorado</span> Election in Colorado

The 2012 United States presidential election in Colorado took place on November 6, 2012, as part of the 2012 United States presidential election in which all 50 states plus the District of Columbia participated. Colorado voters chose nine electors to represent them in the Electoral College via a popular vote pitting incumbent Democratic President Barack Obama and his running mate, Vice President Joe Biden, against Republican challenger and former Massachusetts Governor Mitt Romney and his running mate, Congressman Paul Ryan. Obama and Biden carried Colorado with 51.45% of the popular vote to Romney's and Ryan's 46.09%, thus winning the state's nine electoral votes by a 5.36% margin.

<span class="mw-page-title-main">2012 United States presidential election in Michigan</span> Election in Michigan

The 2012 United States presidential election in Michigan took place on November 6, 2012, as part of the 2012 United States presidential election in which all 50 states plus the District of Columbia participated. Voters chose 16 electors to represent them in the Electoral College via a popular vote pitting incumbent Democratic President Barack Obama and his running mate, Vice President Joe Biden, against Republican challenger and former Massachusetts Governor Mitt Romney and his running mate, Congressman Paul Ryan.

<span class="mw-page-title-main">2012 United States presidential election in Washington (state)</span> Election in Washington

The 2012 United States presidential election in Washington took place on November 6, 2012, as part of the 2012 United States presidential election in which all 50 states plus the District of Columbia participated. Washington voters chose 12 electors to represent them in the Electoral College via a popular vote pitting incumbent Democratic President Barack Obama and his running mate, Vice President Joe Biden, against Republican challenger and former Massachusetts Governor Mitt Romney and his running mate, Congressman Paul Ryan.

<span class="mw-page-title-main">2012 United States presidential election in California</span>

The 2012 United States presidential election in California took place on November 6, 2012, as part of the 2012 United States presidential election in which all 50 states plus the District of Columbia participated. California voters chose 55 electors, the most out of any state, to represent them in the Electoral College via a popular vote pitting incumbent Democratic President Barack Obama and his running mate, Vice President Joe Biden, against Republican challenger and former Massachusetts Governor Mitt Romney and his running mate, Congressman Paul Ryan.

<span class="mw-page-title-main">2012 United States presidential election in Georgia</span> Election in Georgia

The 2012 United States presidential election in Georgia took place on November 6, 2012, as part of the 2012 General Election in which all 50 states plus the District of Columbia participated. Georgia voters chose 16 electors to represent them in the Electoral College via a popular vote pitting incumbent Democratic President Barack Obama and his running mate, Vice President Joe Biden, against Republican challenger and former Massachusetts Governor Mitt Romney and his running mate, Congressman Paul Ryan.

<span class="mw-page-title-main">2012 United States presidential election in Kentucky</span> Election in Kentucky

The 2012 United States presidential election in Kentucky took place on November 6, 2012, as part of the 2012 General Election in which all 50 states plus the District of Columbia participated. Kentucky voters chose eight electors to represent them in the Electoral College via a popular vote pitting incumbent Democratic President Barack Obama and his running mate, Vice President Joe Biden, against Republican challenger and former Massachusetts Governor Mitt Romney and his running mate, Congressman Paul Ryan.

<span class="mw-page-title-main">2012 United States presidential election in Mississippi</span> Election in Mississippi

The 2012 United States presidential election in Mississippi took place on November 6, 2012, as part of the 2012 general election in which all 50 states plus the District of Columbia participated. Mississippi voters chose six electors to represent them in the Electoral College via a popular vote pitting incumbent Democratic President Barack Obama and his running mate, Vice President Joe Biden, against Republican challenger and former Massachusetts Governor Mitt Romney and his running mate, Congressman Paul Ryan.

<span class="mw-page-title-main">2012 United States presidential election in Missouri</span> Election in Missouri

The 2012 United States presidential election in Missouri took place on November 6, 2012, as part of the 2012 United States presidential election, in which all 50 states plus the District of Columbia participated. Missouri voters chose 10 electors to represent them in the Electoral College via a popular vote pitting incumbent Democratic President Barack Obama and his running mate, Vice President Joe Biden, against Republican challenger and former Massachusetts Governor Mitt Romney and his running mate, Congressman Paul Ryan.

<span class="mw-page-title-main">2012 United States presidential election in Montana</span> Election in Montana

The 2012 United States presidential election in Montana took place on November 6, 2012, as part of the 2012 United States presidential election in which all 50 states plus the District of Columbia participated. Montana voters chose three electors to represent them in the Electoral College via a popular vote pitting incumbent Democratic President Barack Obama and his running mate, Vice President Joe Biden, against Republican challenger and former Massachusetts Governor Mitt Romney and his running mate, Congressman Paul Ryan.

<span class="mw-page-title-main">2012 United States presidential election in North Carolina</span>

The 2012 United States presidential election in North Carolina took place on November 6, 2012, as part of the 2012 general election in which all 50 states plus the District of Columbia participated. North Carolina voters chose 15 electors to represent them in the Electoral College via a popular vote pitting incumbent Democratic President Barack Obama and his running mate, Vice President Joe Biden, against Republican challenger and former Massachusetts Governor Mitt Romney and his running mate, Congressman Paul Ryan.

<span class="mw-page-title-main">2012 United States presidential election in Pennsylvania</span> Selection of Pennsylvanias presidential electors

The 2012 United States presidential election in Pennsylvania took place on November 6, 2012, as part of the 2012 United States presidential election in which all 50 states plus the District of Columbia participated. The primary election to select the Democratic and Republican candidates had been held on April 24, 2012. Pennsylvania voters chose 20 electors to represent them in the Electoral College via a popular vote pitting incumbent Democratic President Barack Obama and his running mate, Vice President Joe Biden, against Republican challenger and former Massachusetts Governor Mitt Romney and his running mate, Congressman Paul Ryan. Pennsylvania's electoral vote number was a reduction from the 2008 delegation, which had 21 electors. This change was due to reapportionment following the 2010 United States Census. Pennsylvania's 20 electoral votes are allotted on a winner-take-all basis.

<span class="mw-page-title-main">2012 United States presidential election in Tennessee</span> Election in Tennessee

The 2012 United States presidential election in Tennessee took place on November 6, 2012, as part of the 2012 United States presidential election in which all 50 states plus the District of Columbia participated. Tennessee voters chose 11 electors to represent them in the Electoral College via a popular vote pitting incumbent Democratic President Barack Obama and his running mate, Vice President Joe Biden, against Republican challenger and former Massachusetts Governor Mitt Romney and his running mate, Congressman Paul Ryan.

<span class="mw-page-title-main">2012 United States presidential election in Texas</span> Election in Texas

The 2012 United States presidential election in Texas took place on November 6, 2012, as part of the 2012 United States presidential election in which all 50 states plus the District of Columbia participated. Texas voters chose 38 electors to represent them in the Electoral College via a popular vote pitting incumbent Democratic President Barack Obama and his running mate, Vice President Joe Biden, against Republican challenger and former Massachusetts Governor Mitt Romney and his running mate, Congressman Paul Ryan.

<span class="mw-page-title-main">2012 United States presidential election in Kansas</span> Election in Kansas

The 2012 United States presidential election in Kansas took place on November 6, 2012, as part of the 2012 United States presidential election in which all 50 states plus the District of Columbia participated. Kansas voters chose six electors to represent them in the Electoral College via a popular vote pitting incumbent Democratic President Barack Obama and his running mate, Vice President Joe Biden, against Republican challenger and former Massachusetts Governor Mitt Romney and his running mate, Congressman Paul Ryan. Romney and Ryan carried the state with 59.59 percent of the popular vote to Obama's and Biden's 38.00 percent, thus winning the state's six electoral votes.

<span class="mw-page-title-main">2012 United States presidential election in Nebraska</span> Election in nebraska

The 2012 United States presidential election in Nebraska took place on November 6, 2012, as part of the 2012 United States presidential election in which all 50 states plus the District of Columbia participated. Voters chose five electors to represent them in the Electoral College via a popular vote pitting incumbent Democratic President Barack Obama and his running mate, Vice President Joe Biden, against Republican challenger and former Massachusetts Governor Mitt Romney and his running mate, Congressman Paul Ryan.

<span class="mw-page-title-main">2012 United States presidential election in Alaska</span> Election in Alaska

The 2012 United States presidential election in Alaska took place on November 6, 2012, as part of the 2012 United States presidential election in which all 50 states plus the District of Columbia participated. Alaska voters chose three electors to represent them in the Electoral College via a popular vote pitting incumbent Democratic President Barack Obama and his running mate, Vice President Joe Biden, against Republican challenger and former Massachusetts Governor Mitt Romney and his running mate, Congressman Paul Ryan.

<span class="mw-page-title-main">2012 United States presidential election in North Dakota</span> Election in North Dakota

The 2012 United States presidential election in North Dakota took place on November 6, 2012, as part of the 2012 United States presidential election in which all 50 states plus the District of Columbia participated. North Dakota voters chose three electors to represent them in the Electoral College via a popular vote pitting incumbent Democratic President Barack Obama and his running mate, Vice President Joe Biden, against Republican challenger and former Massachusetts Governor Mitt Romney and his running mate, Congressman Paul Ryan.

References

  1. "Office of the State Of Minnesota Secretary of State". www.sos.state.mn.us. Retrieved July 22, 2017.
  2. "Will Vermont's 27-Cycle GOP Presidential Streak Ever Be Broken?". Smart Politics. April 30, 2012. Retrieved June 22, 2021.
  3. "Dave Leip's Atlas of U.S. Presidential Elections". uselectionatlas.org. Retrieved September 2, 2020.
  4. "Presidential Preference by County". Minnesota Secretary of State. Archived from the original on October 9, 2016. Retrieved October 7, 2016.
  5. Scheck, Tom (September 30, 2011). "MNGOP keeping Feb. 7 Caucus date". Capitol View. Minnesota Public Radio.
  6. "Election Reporting System: Statewide Results for Republican Party". Minnesota Secretary of State. Retrieved March 1, 2012.
  7. 1 2 "Paul supporters chosen as delegates in three congressional districts". Pierce County Herald. April 15, 2012. Archived from the original on April 19, 2012. Retrieved April 17, 2012.
  8. Anderson, Pat (April 21, 2012). "Ron Paul gets 20/24 Congressional District delegates. CD4 3, CD2 3, CD8 2, CD1 2 #mngop #mnleg". twitter.com. Twitter. Retrieved April 22, 2012.
  9. 1 2 "Rep. Paul supporters elected to half of Minnesota GOP convention delegation". Pierce County Herald. April 22, 2012. Archived from the original on April 25, 2012. Retrieved April 22, 2012.
  10. 1 2 "Ron Paul Wins Minnesota State Convention" . Retrieved May 20, 2012.
  11. "Republican Party of Minnesota Events". Archived from the original on May 17, 2012. Retrieved May 4, 2012.
  12. "Minnesota Secretary of State". Archived from the original on November 10, 2012. Retrieved November 10, 2012.
  13. "Daily Kos Elections' statewide election results by congressional and legislative districts". Daily Kos. Retrieved August 11, 2020.