The 2008 Republican primaries were the selection processes by which the Republican Party selected delegates to attend the 2008 Republican National Convention. The series of primaries, caucuses, and state conventions culminated in the National Convention which was held in Saint Paul, Minnesota, September 1–4, 2008, where the delegates voted on and selected a candidate. A simple majority of delegate votes in September (1,191 out of 2,380) was required to become the party's nominee; estimates based on delegate pledges had John McCain surpassing this total after the March 4 primaries in Ohio, Rhode Island, Texas, and Vermont.
Several media sources estimated the number of delegates supporting each candidate using the popular vote results of primary contests and statements from party officials and individual delegates. Delegates could be "pledged" and obligated by state party rules to vote for a specific candidate on the first ballot of the convention, or "unpledged" and able to vote for any candidate. Since several states selected delegates months after their primary or caucus date, many delegate counts for individual states were estimated based on the popular vote results in the contest.[3]
A Vote totals include votes for minor candidates, "uncommitted", "no preference", "write-ins", and other options.
B Precinct or district delegates chosen during this caucus elected the state's national delegates at a later convention. National delegates were not pledged to any candidate based on the caucus results.
C 20 Michigan delegates were initially projected for Mitt Romney, but because Romney suspended his campaign between the primary and the state convention for delegate selection, they were instead uncommitted.[11]
D This state selected delegates with multiple primaries, caucuses, or conventions.
E In the U.S. Virgin Islands territorial meeting, 47% of the vote went to uncommitted.[53]
F One delegate from Idaho was pledged to "none of the above".[61]
G The Ron Paul campaign claimed to have received three West Virginia delegates in exchange for supporting Huckabee at the state convention.[68] Two West Virginia delegates voted for Paul at the national convention.[2]
Caucus date: January 3, 2008 National delegates: 37 (of 40)
County results of the Iowa Republican caucuses.
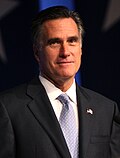
Mike Huckabee
Mitt Romney
Ron Paul
Precinct delegates selected in the January caucus gathered at county caucuses on March 8, from which district delegates were selected. District conventions were held in each of Iowa's congressional districts on April 19, from which state convention delegates were selected. Selection of 37 of Iowa's national delegates occurred at the state convention on July 11–12, 2008, and all 37 delegates were unpledged.[9][69] The national committeeman, the national committeewoman, and the chairman of the Republican Party of Iowa also attended the national convention as unpledged delegates.[9]
According to his campaign Website, Alan Keyes's votes were not counted nor recorded by the Republican Party of Iowa.[70]
Convention date: January 5, 2008 National delegates: 12 (of 14; was 28)
County results of the Wyoming Republican caucuses.
Mitt Romney
Fred Thompson
Duncan Hunter
John McCain
Uncommitted
In accordance with Republican National Committee rules, the Wyoming Republican Party was stripped of half of its 28 delegates for holding primary contests before February 5, 2008.[72] Wyoming's delegates were officially unpledged, but reported affiliations with the candidates. Eight delegates intended to support Mitt Romney, three supported Fred Thompson, and one supported Duncan Hunter.[73] Two additional unpledged delegates were selected at the state convention on May 10, 2008.[64]
Primary date: January 8, 2008 National delegates: 12 (was 24)
County (top) and Municipal (bottom) results of the New Hampshire Republican primary.
John McCain
Mitt Romney
Mike Huckabee
Rudy Guliani
Ron Paul
Tie
Not reported
In accordance with Republican National Committee rules, the New Hampshire Republican State Committee was stripped of half of its 24 delegates for holding primary contests before February 5, 2008.[72] Delegates were allocated proportionally to candidates that received at least 10% of the vote statewide.[10] A hand recount of the primary results was funded by supporters of Ron Paul.[74]
2008 New Hampshire Republican presidential primary[10][75]
Primary date: January 15, 2008 National delegates: 30 (was 60)
County results of the Michigan Republican primary.
Mitt Romney
John McCain
In accordance with Republican National Committee rules, the Michigan Republican Party was stripped of 27 of its 57 delegates for holding primary contests before February 5, 2008.[72] Delegates were allocated to the winner in each congressional district and to candidates that received at least 15% of the vote statewide.[11] Mitt Romney was projected to win the majority of the pledged delegates, but suspended his campaign on February 5, prior to delegate selection, which occurred at caucuses held on February 15. The Michigan Republican Party stated that his delegates would be uncommitted upon selection.[11][76]
Caucus date: January 19, 2008 National delegates: 31 (of 34)
County results of the Nevada Republican caucuses.
Mitt Romney
Ron Paul
Precinct delegates selected during the caucuses gathered at county conventions on March 15 to select state delegates for the state convention on April 26. The state convention was unexpectedly recessed following a dispute between supporters of John McCain and Ron Paul, and the party failed to reestablish a quorum of delegates on a later date to conclude the process. The official slate of delegates was decided by the executive committee of the Nevada Republican Party on July 26.[78] The national committeeman, the national committeewoman, and the chairman of the Nevada Republican Party also attended the national convention as unpledged delegates.[12]
Tom Tancredo did appear on the official ballot, but Nevada Republican Party did not count or record votes cast for him.[12]
Primary date: January 19, 2008 National delegates: 24 (was 47)
County results of the South Carolina Republican primary.
John McCain
Mike Huckabee
In accordance with Republican National Committee rules, the South Carolina Republican Party was stripped of 23 of its 47 delegates for holding primary contests before February 5, 2008.[72] Delegates were allocated to the winner in each congressional district in the state and to the winner statewide.[13]
2008 South Carolina Republican presidential primary[13][80]
Caucus date: January 22, 2008 National delegates: 24 (of 47)
The district caucuses selected state delegates for the state convention on February 16, 2008. At the state convention, 24 unpledged delegates were selected by the state delegates, in addition to 20 delegates pledged based on the results of the primary election on February 9. The national committeeman, the national committeewoman, and the chairman of the Republican Party of Louisiana also attended the national convention as unpledged delegates.[38] Results of the delegates selected were released by the Republican Party of Louisiana on January 29.[81] Delegates ran on multiple platforms, making it difficult to distinguish which candidate they would support. A large number of delegates ran on an uncommitted pro-life platform. In the days after the caucuses, it was reported McCain had the support of the most delegates, followed by Paul and Romney.[82][83] According to party chairman Roger Villere, Jr., supporters of John McCain had majorities in congressional districts 1, 2, 3, 6, and 7, which he predicted would give McCain control of 41 of 47 of Louisiana's delegates.[84] By February 1, the uncommitted pro-life delegates supported McCain, along with Louisiana's three RNC members, ensuring McCain would have control of Louisiana's delegation.[85]
Caucus dates: January 25, 2008 – February 5, 2008 National delegates: 17 (of 20)
Delegates selected in the precinct caucuses attended a state convention from May 16–18, 2008.[66] The convention selected 17 unpledged national delegates, all of whom supported McCain.[86] The national committeeman, the national committeewoman, and the chairman of the Hawaii Republican Party also attended the national convention as unpledged delegates.[66]
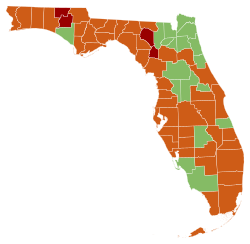
Primary date: January 29, 2008 National delegates: 57 (was 114)
County results of the Florida Republican primary.
John McCain
Mitt Romney
Mike Huckabee
In accordance with Republican National Committee rules, the Republican Party of Florida was stripped of 57 of its 114 delegates for holding primary contests before February 5, 2008.[72] The Florida primary was a winner-take-all contest with 57 delegates pledged to the winner statewide.[14]
Caucus date: February 1, 2008 – February 3, 2008 National delegates: 18 (of 21)
County results of the Maine Republican caucuses.
Mitt Romney
John McCain
Ron Paul
Official allocation of delegates was decided during district caucuses and the state convention on May 3, 2008.[15] Although the state's delegates were officially unpledged to any candidate, Paul supporters succeeded in selecting a single pro-Paul delegate at a district convention on May 3, while the state convention selected twelve McCain supporters as delegates.[88] The national committeeman, the national committeewoman, and the chairman of the Maine Republican Party also attended the national convention as unpledged delegates.[15]
2008 Maine Republican presidential caucuses[15][89]
Primary date: February 5, 2008 National delegates: 45 (of 48)
County results of the Alabama Republican primary.
Mike Huckabee
John McCain
Delegates were allocated to the winners in each congressional district if they received over 50% of the vote, and the winner and runner-up in each district if the winner received less. Delegates were also allocated proportionally statewide to candidates receiving at least 20% of the vote. The national committeeman, the national committeewoman, and the chairman of the Alabama Republican Party also attended the national convention as unpledged delegates.[16]
Caucus date: February 5, 2008 National delegates: 26 (of 29)
Delegates were allocated proportionally based on the statewide results of the caucuses. The national committeeman, the national committeewoman, and the chairman of the Alaska Republican Party also attended the national convention as unpledged delegates.[17]
Primary date: February 5, 2008 National delegates: 50 (of 53)
County results of the Arizona Republican primary.
John McCain
Mitt Romney
The Arizona primary was a winner-take-all contest with 50 delegates pledged to the winner statewide. The national committeeman, the national committeewoman, and the chairman of the Arizona Republican Party also attended the national convention as unpledged delegates.[18]
Primary date: February 5, 2008 National delegates: 31 (of 34)
County results of the Arkansas Republican primary.
Mike Huckabee
Delegates were allocated to the winners in each congressional district if they received over 50% of the vote, and the winner and runner-up in each district if the winner received less. Delegates were also allocated to candidates receiving at least 10% of the vote statewide. The national committeeman, the national committeewoman, and the chairman of the Republican Party of Arkansas also attended the national convention as unpledged delegates.[19]
Primary date: February 5, 2008 National delegates: 170 (of 173)
County results of the California Republican primary.
John McCain
Mitt Romney
Delegates were allocated to the winner in each congressional district in the state and to the winner statewide. The national committeeman, the national committeewoman, and the chairman of the California Republican Party also attended the national convention as unpledged delegates.[20]
Caucus date: February 5, 2008 National delegates: 43 (of 46)
County results of the Colorado Republican caucuses.
Mitt Romney
John McCain
Mike Huckabee
The caucuses included a non-binding straw poll of presidential preference. Voters at each precinct then selected district delegates to convene in district conventions from May 17 to May 30, 2008, where 21 national delegates were selected, as well as delegates to the state convention on May 31. An additional 22 delegates were selected at a state convention. No delegates were pledged to any candidate. The national committeeman, the national committeewoman, and the chairman of the Colorado Republican Party also attended the national convention as unpledged delegates.[21][67]
Primary date: February 5, 2008 National delegates: 27 (of 30)
County results of the Connecticut Republican primary.
John McCain
The Connecticut primary was a winner-take-all contest with 27 delegates pledged to the winner statewide. The national committeeman, the national committeewoman, and the chairman of the Connecticut Republican Party also attended the national convention as unpledged delegates.[22]
Primary date: February 5, 2008 National delegates: 57 (of 70)
County results of the Illinois Republican primary.
John McCain
Mitt Romney
Mike Huckabee
57 delegates were directly elected alongside a statewide presidential preference vote. 10 other unpledged delegates were selected during the state convention on June 7, 2008. The national committeeman, the national committeewoman, and the chairman of the Illinois Republican Party also attended the national convention as unpledged delegates.[25]
Primary date: February 5, 2008 National delegates: 40 (of 43)
Delegates were proportionally allocated to candidates that received at least 15% of the vote statewide. The national committeeman, the national committeewoman, and the chairman of the Massachusetts Republican Party also attended the national convention as unpledged delegates.[26]
County results of the Massachusetts Republican primary.
Caucus date: February 5, 2008 National delegates: 38 (of 41)
County results of the Minnesota Republican caucuses.
Mitt Romney
John McCain
Mike Huckabee
Ron Paul
The caucuses involved a non-binding straw poll and selection of precinct delegates to attend basic political organization unit conventions held between February 22 and March 15, 2008. These conventions selected delegates to attend congressional district conventions between March 29 and April 19, where 24 national delegates were selected. The district conventions also selected delegates to attend the state convention on May 29–31, where an additional 14 national delegates were selected. The national committeeman, the National Committeewoman, and the chairman of the Republican Party of Minnesota also attended the national convention as unpledged delegates.[27] Six of the district delegates were reportedly Paul supporters, while the 14 delegates selected at the state convention supported McCain.[103][104]
Primary date: February 5, 2008 National delegates: 87 (of 101)
County results of the New York Republican primary.
John McCain
The New York primary was a winner-take-all contest with 87 delegates pledged to the winner statewide. Eleven other unpledged delegates were selected during the state committee meeting on May 20–21, 2008. The national committeeman, the national committeewoman, and the chairman of the New York Republican State Committee also attended the national convention as unpledged delegates.[31]
2008 New York Republican presidential primary[31][109]
Caucus date: February 5, 2008 National delegates: 23 (of 26)
State House district results of the North Dakota Republican caucuses.
Mitt Romney
John McCain
Ron Paul
Mike Huckabee
Delegates were allocated proportionally to candidates that received at least 15% of the vote statewide. The national committeeman, the national committeewoman, and the chairman of the North Dakota Republican Party also attended the national convention as unpledged delegates.[32]
2008 North Dakota Republican presidential caucuses[32][110]
Primary date: February 5, 2008 National delegates: 38 (of 41)
Delegates were allocated to the winner in each congressional district in the state and to the winner statewide. The national committeeman, the national committeewoman, and the chairman of the Oklahoma Republican Party also attended the national convention as unpledged delegates.[33]
County results of the Oklahoma Republican primary.
Primary date: February 5, 2008 National delegates: 52 (of 55)
County results of the Tennessee Republican primary.
Mike Huckabee
John McCain
Mitt Romney
39 of the 52 delegates were directly pledged in the primary election, with the remaining 13 selected at the state executive committee meeting on March 1. The national committeeman, the national committeewoman, and the chairman of the Tennessee Republican Party attended the convention as unpledged delegates.[34]
Caucus date: February 5, 2008 National delegates: 18 (of 30)
18 delegates were pledged to the first candidate to receive the support of a majority of convention delegates. Nine other delegates were pledged based on a primary election on May 13, 2008. The national committeeman, the national committeewoman, and the chairman of the West Virginia Republican Party attended the convention as unpledged delegates.[58]
The Ron Paul campaign claimed to have received three West Virginia delegates in exchange for supporting Huckabee at the state convention.[68] Two West Virginia delegates voted for Paul at the national convention.[2]
2008 West Virginia Republican state convention[65]
Caucus date: February 9, 2008 National delegates: 36 (of 39)
Congressional district results of the Kansas Republican caucuses.
Mike Huckabee
Delegates were allocated to the winner in each congressional district in the state and to the winner statewide. Kansas chose three additional unpledged delegates during the state committee meeting on May 22, 2008. The Green Papers reported two of the unpledged delegates supported McCain.[37]
Primary date: February 9, 2008 National delegates: 20 (of 47)
County results of the Louisiana Republican primary.
Mike Huckabee
John McCain
Party rules in Louisiana would pledge 20 delegates to the winner of the primary only if the candidate received 50% or more of the popular vote. Delegates were selected at the state convention on February 16. Since no candidate won the primary with this majority, the 20 delegates selected at the state convention on February 16 were officially unpledged.[38] The convention, controlled by supporters of McCain, selected a slate of McCain supporters as national delegates.[115] The McCain campaign had written or verbal support of 44 of the 47 delegates chosen at the convention.[115]
Caucus date: February 9, 2008 National delegates: 18 (of 40)
County results of the Washington Republican caucuses.
John McCain
Mike Huckabee
Ron Paul
Mitt Romney
Uncommitted
During the precinct caucuses, each precinct selected a delegate to attend county conventions. Between March 22 and May 3, the county conventions selected delegates to attend the district conventions, and the district conventions selected delegates to the state convention. The state convention convened from May 29–31 to select 18 unpledged delegates. An additional 19 delegates were pledged based on the results of a primary election on February 19. The national committeeman, the national committeewoman, and the chairman of the Washington State Republican Party attended the convention as unpledged delegates.[39]
The Washington State Republican Party announced McCain as the winner of the caucuses with 87% of precincts reporting. Huckabee challenged the results, leading to a recount.[117] McCain was again declared the winner based on the results of 96% of the precincts.[118]
2008 Washington Republican presidential caucuses[39]
Primary date: February 12, 2008 National delegates: 16 (of 19)
Ward results of the Maryland Republican primary.
John McCain
Mike Huckabee
The District of Columbia primary was a winner-take-all contest with 16 delegates pledged to the winner statewide. The national committeeman, the national committeewoman, and the chairman of the District of Columbia Republican Party attended the convention as unpledged delegates.[40]
2008 District of Columbia Republican presidential primary[40][119]
Primary date: February 19, 2008 National delegates: 19 (of 40)
County results of the Washington Republican primary.
John McCain
18 other unpledged delegates were selected at the state convention following caucuses on February 9, 2008. Delegates were allocated to the winner in each congressional district and proportionally to all candidates that received at least 20% of the vote statewide. The national committeeman, the national committeewoman, and the chairman of the Washington State Republican Party attended the convention as unpledged delegates.[39]
2008 Washington Republican presidential primary[39][122]
Caucus date: February 23, 2008 National delegates: 6 (of 9)
Six delegates were selected at a territorial party meeting. The national committeeman, the national committeewoman, and the chairman of the Republican Party of American Samoa also attended the convention as unpledged delegates. John McCain won the support of all nine delegates at the territorial meeting.[44]
Convention date: February 23, 2008 National delegates: 6 (of 9)
Six delegates were selected at a territorial party meeting. The national committeeman, the national committeewoman, and the chairman of the CNMI Republican Party also attended the convention as unpledged delegates. John McCain won the support of all nine delegates at the territorial meeting.[44]
Caucus date: February 24, 2008 National delegates: 20 (of 23)
Twenty delegates were pledged at the territorial caucus. The national committeeman, the national committeewoman, and the chairman of the Republican Party of Puerto Rico also attended the convention as unpledged delegates.[46] Following the caucus, it was reported that McCain had the support of all 23 delegates.[124]
2008 Puerto Rico Republican presidential caucuses[124]
Primary date: March 4, 2008 National delegates: 85 (of 88)
County results of the Ohio Republican primary.
John McCain
Delegates were allocated to the winner in each congressional district in the state and to the winner statewide. The national committeeman, the national committeewoman, and the chairman of the Ohio Republican Party attended the convention as unpledged delegates.[47]
Primary date: March 4, 2008 National delegates: 17 (of 20)
County results of the Rhode Island Republican primary.
John McCain
Delegates were allocated proportionally to candidates that received at least 15% of the vote statewide. The national committeeman, the national committeewoman, and the chairman of the Rhode Island Republican Party attended the convention as unpledged delegates.[48]
2008 Rhode Island Republican presidential primary[48][126]
Primary date: March 4, 2008 National delegates: 137 (of 140)
County results of the Texas Republican primary.
John McCain
Mike Huckabee
Delegates were allocated to the winner in each congressional district if that candidate received at least 50% of the vote, or to the winner and runner-up if they received less. Delegates were also allocated to the statewide winner. The national committeeman, the national committeewoman, and the chairman of the Republican Party of Texas attended the convention as unpledged delegates.[49]
Caucus date: March 8, 2008 National delegates: 6 (of 9)
Six delegates were selected at a territorial party meeting. The national committeeman, the national committeewoman, and the chairman of the Republican Party of Guam also attended the convention as unpledged delegates. John McCain won the support of all nine delegates at the territorial meeting.[51]
Primary date: March 11, 2008 National delegates: 36 (of 39)
County results of the Mississippi Republican primary.
John McCain
Delegates were allocated to the winner in each congressional district in the state and to the winner statewide. The national committeeman, the national committeewoman, and the chairman of the Mississippi Republican Party attended the convention as unpledged delegates.[52]
Caucus date: April 5, 2008 National delegates: 6 (of 9)
Six delegates were selected at a territorial party meeting. The national committeeman, the national committeewoman, and the chairman of the Republican Party of the Virgin Islands also attended the convention as unpledged delegates.[53]
2008 United States Virgin Islands Republican Territorial Meeting[53]
Primary date: April 22, 2008 National delegates: 61 (of 74)
County results of the Pennsylvania Republican primary.
John McCain
All delegates elected in the Pennsylvania were officially unpledged. Ten additional unpledged delegates were selected by the Republican State Committee of Pennsylvania on June 6, 2008. The national committeeman, the national committeewoman, and the chairman of the Pennsylvania Republican Party also attended the convention as unpledged delegates.[54]
Primary date: May 6, 2008 National delegates: 27 (of 57)
Delegates were allocated to the winner in each congressional district. 27 other unpledged delegates were selected during the state convention on June 9–10, 2008. The national committeeman, national committeewoman, and chairman of the Indiana Republican Party also attended the national convention as unpledged delegates.[55]
Primary date: May 13, 2008 National delegates: 0 (of 33)
County results of the Nebraska Republican primary.
John McCain
Nebraska's primary was nonbinding. 30 unpledged delegates were selected at the state convention on July 12, 2008. The national committeeman, national committeewoman, and chairman of the Nebraska Republican Party also attended the national convention as unpledged delegates.[57]
Primary date: May 13, 2008 National delegates: 9 (of 30)
County results of the West Virginia Republican primary.
John McCain
18 other delegates were selected during a state convention on February 5, 2008. The national committeeman, national committeewoman, and chairman of the West Virginia Republican Party also attended the national convention as unpledged delegates.[58]
2008 West Virginia Republican presidential primary[58][134]
Primary date: May 20, 2008 National delegates: 42 (of 45)
County results of the Kentucky Republican primary.
John McCain
Delegates were allocated proportionally to all candidates receiving at least 15% of the vote statewide. The national committeeman, the national committeewoman, and the chairman of the Republican Party of Kentucky attended the convention as unpledged delegates.[59]
Primary date: May 20, 2008 National delegates: 27 (of 30)
County results of the Oregon Republican primary.
John McCain
Delegates were allocated proportionally to all candidates receiving at least 3.5% of the vote statewide. The national committeeman, the national committeewoman, and the chairman of the Oregon Republican Party attended the convention as unpledged delegates.[60]
Primary date: May 27, 2008 National delegates: 24 (of 32)
County results of the Idaho Republican primary.
John McCain
Delegates were allocated proportionally to candidates that received at least 5% of the vote statewide. Five other unpledged delegates were selected at the Idaho state convention on June 12–14, 2008. The national committeeman, the national committeewoman, and the chairman of the Idaho Republican Party also attended the national convention as unpledged delegates.[61]
Primary date: June 3, 2008 National delegates: 29 (of 32)
County results of the New Mexico Republican primary.
John McCain
Delegates were allocated proportionally to candidates that received at least 15% of the vote statewide. The national committeeman, the national committeewoman, and the chairman of the Republican Party of New Mexico attended the convention as unpledged delegates.[62]
2008 New Mexico Republican presidential primary[138]
Primary date: June 3, 2008 National delegates: 24 (of 27)
County results of the New Mexico Republican primary.
John McCain
Delegates were allocated proportionally to candidates that received at least 20% of the vote statewide. The national committeeman, the national committeewoman, and the chairman of the South Dakota Republican Party attended the convention as unpledged delegates.[63]
2008 South Dakota Republican presidential primary[139]
↑Anuzis, Saul. "Articles of Interest 2-8-08". "That's Saul, folks!" Michigan Republican Party Blog. Archived from the original on February 13, 2008. Retrieved August 11, 2024.
12Dávila, Javier Colón (February 29, 2008). "Aval boricua a McCain". El Nuevo Día (in Spanish). Archived from the original on February 29, 2008. Retrieved August 27, 2024.
This page is based on this Wikipedia article Text is available under the CC BY-SA 4.0 license; additional terms may apply. Images, videos and audio are available under their respective licenses.