| | |
|---|---|
| Democratic Party | |
| Republican Party | |
| Minor parties | |
| Related races | |
| |
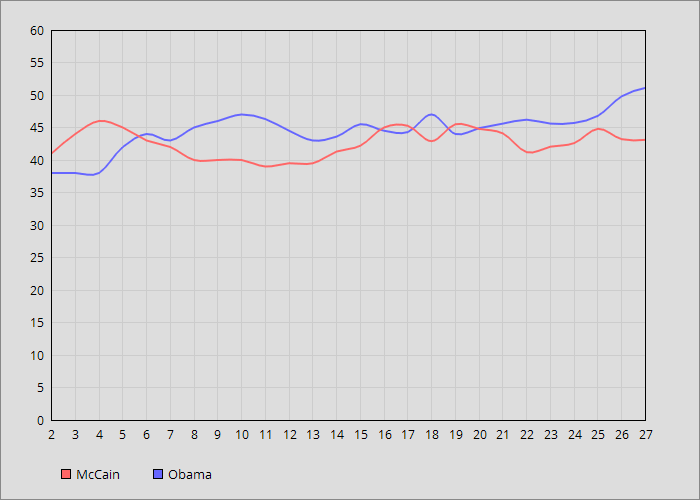
Scientific, nationwide public opinion polls conducted relating to the 2008 United States presidential election include:
| | |
|---|---|
| Democratic Party | |
| Republican Party | |
| Minor parties | |
| Related races | |
| |
Scientific, nationwide public opinion polls conducted relating to the 2008 United States presidential election include:
| Poll Source | Date administered | Barack Obama | John McCain | Lead margin | Sample size | Margin of error |
|---|---|---|---|---|---|---|
| Marist College [1] | November 3, 2008 | 52% | 43% | 9 | 804 LV | ±3.5% |
| American Research Group [2] | November 1–3, 2008 | 53% | 45% | 8 | 1,200 LV | ±3% |
| Marist College [3] | November 2, 2008 | 53% | 44% | 9 | 635 LV | ±4% |
| NBC News/Wall Street Journal [4] | November 1 –2, 2008 | 51% | 43% | 8 | 1,011 LV | ±3.1% |
| Fox News/Opinion Dynamics Corporation [5] | November 1–2, 2008 | 50% | 43% | 7 | 971 LV | ±3% |
| CBS News [6] | October 31–November 2, 2008 | 51% | 42% | 9 | 714 LV | Not reported |
| Reuters/C-SPAN/Zogby International (Daily Tracking) [7] | October 31–November 2, 2008 | 50.9% | 43.8% | 7.1 | Not reported | Not reported |
| Investor's Daily Business/TIPP (Daily Tracking) [8] | October 31–November 2, 2008 | 47.5% | 43% | 4.5 | Not reported | Not reported |
| Gallup (Daily Tracking Model II) [9] | October 31 – November 2, 2008 | 53% | 42% | 11 | 2,458 LV | ±2% |
| CNN/Opinion Research Corporation [10] | October 30 – November 1, 2008 | 53% | 46% | 7 | 714 LV | ±3.5% |
| Rasmussen Reports/Pulse Opinion Research (Daily Tracking) [11] | October 30–November 1, 2008 | 51% | 46% | 5 | 3,000 LV | ±2% |
| Pew Research Center [12] | October 29 – November 1, 2008 | 49% | 42% | 7 | 2,587 LV | ±2.5% |
| Polimetrix/YouGov [13] | October 18–November 1, 2008 | 51% | 45% | 6 | 31,148 RV | Not reported |
| Diageo/The Hotline/Financial Dynamics (Daily Tracking) [14] | October 29–31, 2008 | 51% | 44% | 7 | 876 LV | ±3.3% |
| ABC News/Washington Post (Daily Tracking) [15] | October 28–31, 2008 | 53% | 44% | 9 | 1,896 LV | Not reported |
| Gallup (Daily Tracking Model II) [16] | October 28–30, 2008 | 52% | 43% | 9 | 2,459 LV | ±2% |
| Reuters/CSPAN/Zogby International (Daily Tracking) [17] | October 28–30, 2008 | 50.1% | 43.1% | 7 | 1,201 LV | ±2.9% |
| Investor's Business Daily/TIPP (Daily Tracking) [18] | October 28–30, 2008 | 47.9% | 43.4% | 4.5 | Not reported | Not reported |
| Marist College [19] | October 29, 2008 | 50% | 43% | 7 | 543 LV | ±4.5% |
| Fox News/Opinion Dynamics Corporation [20] | October 28–29, 2008 | 47% | 44% | 3 | 924 LV | ±3% |
| Rasmussen Reports/Pulse Opinion Research (Daily Tracking) [21] | October 27–29, 2008 | 51% | 46% | 5 | 3,000 LV | ±2% |
| CBS News/New York Times [22] | October 25–29, 2008 | 52% | 41% | 11 | 1,005 LV | Not reported |
| Diageo/The Hotline/Financial Dynamics (Daily Tracking) [23] | October 26–28, 2008 | 49% | 42% | 7 | 870 LV | ±3.3% |
| The Economist/YouGov [24] | October 25–27, 2008 | 49% | 42% | 7 | 981 RV | Not reported |
| Gallup (Daily Tracking Model II) [25] | October 25–27, 2008 | 51% | 44% | 7 | 2,396 LV | ±2% |
| Reuters/CSPAN/Zogby International (Daily Tracking) [26] | October 25–27, 2008 | 49% | 44.7% | 4.3 | 1,202 LV | ±2.9% |
| ABC News/Washington Post (Daily Tracking) [27] | October 24–27, 2008 | 52% | 45% | 7 | 1,301 LV | Not reported |
| McClatchy/Ipsos [28] | October 23–27, 2008 | 50% | 45% | 5 | 831 LV | ±3.4% |
| Investor's Business Daily/TIPP (Daily Tracking) [29] | October 23–27, 2008 | 46.7% | 43.7% | 3 | Not reported | Not reported |
| George Washington University/Tarrance Group/Lake Research Partners (Daily Tracking) [30] | October 21–23, 26–27, 2008 | 49% | 45% | 4 | 1,000 LV | ±3.1% |
| Rasmussen Reports/Pulse Opinion Research (Daily Tracking) [21] | October 24–26, 2008 | 51% | 46% | 5 | 3,000 LV | ±2% |
| Diageo/The Hotline/Financial Dynamics (Daily Tracking) [31] | October 23–25, 2008 | 50% | 42% | 8 | 878 LV | ±3.3% |
| Gallup (Daily Tracking Model II) [32] | October 22–24, 2008 | 51% | 43% | 8 | 2,358 LV | ±2% |
| Reuters/CSPAN/Zogby International (Daily Tracking) [33] | October 21–24, 2008 | 51.1% | 41.6% | 9.5 | 1,203 LV | ±2.9% |
| Newsweek/Princeton Survey Research Associates International [34] | October 22–23, 2008 | 53% | 41% | 12 | 882 LV | ±4% |
| Rasmussen Reports/Pulse Opinion Research (Daily Tracking) [35] | October 21–23, 2008 | 52% | 45% | 7 | 3,000 LV | ±2% |
| ABC News/Washington Post (Daily Tracking) [36] | October 20–23, 2008 | 53% | 44% | 9 | 1,321 LV | Not reported |
| Diageo/The Hotline/Financial Dynamics (Daily Tracking) [37] | October 20–22, 2008 | 48% | 43% | 5 | 769 LV | ±3.5% |
| CBS News/New York Times [38] | October 19–22, 2008 | 54% | 41% | 13 | 771 LV | Not reported |
| Big Ten [39] | October 19–22, 2008 | 52% | 43% | 9 | 1,014 LV | Not reported |
| Investors Business Daily/TIPP (Daily Tracking) [40] | October 18–22, 2008 | 44.8% | 43.7% | 1.1 | 1,072 LV | ±3% |
| The Economist/YouGov [41] | October 20–21, 2008 | 49% | 41% | 8 | 998 RV | ±4% |
| Fox News/Opinion Dynamics Corporation [42] | October 20–21, 2008 | 49% | 40% | 9 | 936 LV | ±3% |
| Gallup (Daily Tracking Model II) [43] | October 19–21, 2008 | 52% | 44% | 8 | 2,420 LV | ±2% |
| Reuters/CSPAN/Zogby International (Daily Tracking) [44] | October 18–20, 2008 | 50.3% | 42.4% | 7.9 | 1,214 LV | ±2.9% |
| Rasmussen Reports/Pulse Opinion Research (Daily Tracking) [45] | October 18–20, 2008 | 50% | 46% | 4 | 3,000 LV | ±2% |
| American Research Group [46] | October 18–20, 2008 | 49% | 45% | 4 | 1,200 LV | ±3% |
| NBC News/Wall Street Journal [47] | October 17–20, 2008 | 52% | 42% | 10 | 1,159 RV | ±2.9% |
| George Washington University/Tarrance Group/Lake Research Partners (Daily Tracking) [30] | October 14–16, 19–20, 2008 | 48% | 47% | 1 | 1,000 LV | ±3.1% |
| CNN/Opinion Research Corporation [48] | October 17–19, 2008 | 51% | 46% | 5 | 746 LV | ±3.5% |
| Diageo/The Hotline/Financial Dynamics (Daily Tracking) [49] | October 17–19, 2008 | 47% | 42% | 7 | 789 LV | ±3.5% |
| Pew Research Center [50] | October 16–19, 2008 | 53% | 39% | 14 | 2,382 LV | ±2.5% |
| ABC News/Washington Post (Daily Tracking) [51] | October 16–19, 2008 | 53% | 44% | 9 | 1,366 LV | Not reported |
| Hearst-Argyle/Franklin & Marshall College [52] | October 13–19, 2008 | 50% | 45% | 5 | Not reported | ±3.5% |
| Gallup (Daily Tracking Model II) [53] | October 16–18, 2008 | 51% | 44% | 7 | 2,590 LV | ±2% |
| Reuters/C-SPAN/Zogby International (Daily Tracking) [54] | October 15–17, 2008 | 48.3% | 44.4% | 3.9 | 1,209 LV | ±2.9% |
| Rasmussen Reports/Pulse Opinion Research (Daily Tracking) [45] | October 15–17, 2008 | 50% | 45% | 5 | 3,000 LV | ±2% |
| Investor's Business Daily/TIPP (Daily Tracking) [55] | October 13–17, 2008 | 47.2% | 39.8% | 7.4 | Not reported | Not reported |
| Diageo/The Hotline/Financial Dynamics (Daily Tracking) [56] | October 14–16, 2008 | 50% | 40% | 10 | 804 LV | ±3.5% |
| Gallup (Daily Tracking Model II) [57] | October 13–15, 2008 | 51% | 45% | 6 | 2,312 LV | ±2% |
| Rasmussen Reports/Pulse Opinion Research (Daily Tracking) [58] | October 12–14, 2008 | 50% | 45% | 5 | 3,000 LV | ±2% |
| Reuters/C-SPAN/Zogby International (Daily Tracking) [59] | October 11–14, 2008 | 48.2% | 44.4% | 3.8 | 1,210 LV | ±2.9% |
| Diageo/The Hotline/Financial Dynamics (Daily Tracking) [60] | October 11–13, 2008 | 48% | 42% | 6 | 829 LV | ±3.4% |
| American Research Group [2] | October 11–13, 2008 | 50% | 45% | 5 | 1,200 LV | ±3% |
| Los Angeles Times/Bloomberg [61] | October 10–13, 2008 | 50% | 41% | 9 | 1,030 LV | ±3% |
| CBS News/New York Times [62] | October 10–13, 2008 | 53% | 39% | 14 | 699 LV | Not reported |
| George Washington University/Tarrance Group/Lake Research Partners (Daily Tracking) [63] | October 8–9, 12–13, 2008 | 53% | 40% | 13 | 800 LV | ±3.5% |
| The Economist/YouGov [64] | October 11–12, 2008 | 48% | 42% | 6 | 998 RV | ±4% |
| USA Today/Gallup (Model II) [65] | October 10–12, 2008 | 52% | 45% | 7 | 1,030 LV | ±3% |
| Pew Research Center [66] | October 9–12, 2008 | 49% | 42% | 7 | 1,191 LV | Not reported |
| Democracy Corps/Greenberg Quinlan Rosner (D) [67] | October 8−12, 2008 | 51% | 42% | 9 | 1,000 LV | Not reported |
| Investor's Business Daily/TIPP (Daily Tracking) [68] | October 6–12, 2008 | 44.8% | 42.7% | 2.1 | 825 LV | ±3.3% |
| Rasmussen Reports/Pulse Opinion Research (Daily Tracking) [69] | October 9–11, 2008 | 51% | 45% | 6 | 3,000 LV | ±2% |
| ABC News/Washington Post [70] | October 8–11, 2008 | 53% | 43% | 10 | 766 LV | ±3.5% |
| Diageo/The Hotline/Financial Dynamics [71] | October 8–10, 2008 | 50% | 40% | 10 | 808 LV | ±3.5% |
| Reuters/C-SPAN/Zogby International (Daily Tracking) [72] | October 7–10, 2008 | 47.6% | 43.8% | 3.8 | 1,208 LV | ±2.9% |
| Newsweek/Princeton Survey Research Associates International [73] | October 8–9, 2008 | 52% | 41% | 11 | 1,035 RV | ±3.7% |
| Fox News/Opinion Dynamics Corporation [74] | October 8–9, 2008 | 46% | 39% | 7 | 900 RV | ±3% |
| Rasmussen Reports/Pulse Opinion Research (Daily Tracking) [69] | October 6–8, 2008 | 50% | 45% | 5 | 3,000 LV | ±2% |
| Diageo/The Hotline/Financial Dynamics [75] | October 5–7, 2008 | 45% | 44% | 1 | 904 LV | ±3.3% |
| Gallup (Daily Tracking) [76] | October 5–7, 2008 | 52% | 41% | 11 | 2,747 RV | ±2% |
| George Washington University/Tarrance Group/Lake Research Partners [77] | October 2, 5–7, 2008 | 49% | 45% | 4 | 800 LV | ±3.5% |
| The Economist/YouGov [78] | October 4–6, 2008 | 46% | 43% | 3 | 999 RV | ±4% |
| Reuters/C-SPAN/Zogby International (Daily Tracking) [79] | October 4–6, 2008 | 47.7% | 45.3% | 2.4 | 1,237 LV | ±2.8% |
| American Research Group [2] | October 4–6, 2008 | 49% | 45% | 4 | 1,200 LV | ±3% |
| Time/Schulman, Bucuvalas, & Ronca Inc. (SRBI) [80] | October 3–6, 2008 | 50% | 44% | 6 | 1,053 LV | ±3% |
| NBC News/Wall Street Journal [81] | October 4–5, 2008 | 49% | 43% | 6 | 658 RV | ±3.8% |
| Rasmussen Reports/Pulse Opinion Research (Daily Tracking) [82] | October 3–5, 2008 | 52% | 44% | 8 | 3,000 LV | ±2% |
| CBS News [83] | October 3–5, 2008 | 48% | 45% | 3 | 616 LV | Not reported |
| CNN/Opinion Research Corporation [10] | October 3–5, 2008 | 53% | 45% | 8 | 694 LV | ±3.5% |
| Democracy Corps/Greenberg Quinlan Rosner (D) [84] | October 1–5, 2008 | 48% | 45% | 3 | 1,000 LV | Not reported |
| Diageo/The Hotline/Financial Dynamics [85] | October 2–4, 2008 | 48% | 41% | 7 | 915 LV | ±3.2% |
| Gallup (Daily Tracking) [86] | October 2–4, 2008 | 50% | 43% | 7 | 2,728 RV | ±2% |
| Zogby Interactive [87] | October 2–3, 2008 | 48.4% | 43.8% | 4.6 | 2,873 LV | ±1.9% |
| Rasmussen Reports/Pulse Opinion Research (Daily Tracking) [82] | September 30–October 2, 2008 | 51% | 44% | 7 | 3,000 LV | ±2% |
| Diageo/The Hotline/Financial Dynamics (Daily Tracking) [88] | September 29–October 1, 2008 | 47% | 42% | 5 | 908 RV | ±3.3% |
| Gallup (Daily Tracking) [89] | September 29–October 1, 2009 | 48% | 43% | 5 | 2,747 RV | ±2% |
| George Washington University/Tarrance Group/Lake Research Partners [90] | September 28–October 1, 2008 | 49% | 44% | 5 | 800 LV | ±3.5% |
| Marist College [91] | September 28–30, 2008 | 49% | 44% | 5 | 943 LV | ±3.5% |
| Democracy Corps/Greenberg Quinlan Rosner (D) [92] | September 28–30, 2008 | 49% | 45% | 4 | 1,000 LV | Not reported |
| CBS News [93] | September 27–30, 2008 | 50% | 41% | 9 | 769 LV | Not reported |
| Associated Press/GfK Group/Roper [94] | September 27–30, 2008 | 48% | 41% | 7 | 808 LV | ±3.4% |
| American Research Group [2] | September 27–29, 2008 | 49% | 45% | 4 | 1,200 LV | ±3% |
| ABC News/Washington Post [95] | September 27–29, 2008 | 50% | 46% | 4 | 916 LV | ±3% |
| Pew Research Center [96] | September 27–29, 2008 | 49% | 43% | 6 | 1,181 LV | ±4% |
| The Economist/Polimetrix/YouGov [97] | September 27–29, 2008 | 47% | 42% | 5 | 988 RV | Not reported |
| Rasmussen Reports/Pulse Opinion Research (Daily Tracking) [98] | September 27–29, 2008 | 51% | 45% | 6 | 3,000 LV | ±2% |
| Time/Schulman, Bucuvalas, & Ronca Inc. (SRBI) [80] | September 26–29, 2008 | 50% | 43% | 7 | 1,133 LV | ±3% |
| McClatchy/Ipsos [99] | September 26–29, 2008 | 48% | 45% | 3 | 1,007 RV | ±3.1% |
| Gallup (Daily Tracking) [100] | September 26–28, 2008 | 50% | 42% | 8 | 2,732 RV | ±2% |
| Diageo/The Hotline/Financial Dynamics (Daily Tracking) [101] | September 26–28, 2008 | 47% | 42% | 5 | 903 RV | ±3.3% |
| Zogby Interactive [102] | September 26–27, 2008 | 47.1% | 45.9% | 1.2 | 2,102 LV | ±2.2% |
| Rasmussen Reports/Pulse Opinion Research (Daily Tracking) [103] | September 24–26, 2008 | 50% | 44% | 6 | 3,000 LV | ±2% |
| Gallup (Daily Tracking) [104] | September 23–25, 2008 | 48% | 45% | 3 | 2,736 RV | ±2% |
| Zogby Interactive [105] | September 23–25, 2008 | 43.8% | 45.8% | 2 | 4,752 LV | ±1.5% |
| Diageo/The Hotline/Financial Dynamics (Daily Tracking) [106] | September 23–25, 2008 | 49% | 42% | 7 | 913 RV | ±3.2% |
| George Washington University/Tarrance Group/Lake Research Partners [107] | September 21–25, 2008 | 46% | 48% | 2 | 1,000 LV | ±3.1% |
| CBS News/New York Times [108] | September 22–24, 2008 | 48% | 43% | 5 | Not reported | Not reported |
| The Economist/Polimetrix/YouGov [109] | September 22–24, 2008 | 46% | 43% | 3 | 985 RV | Not reported |
| Democracy Corps/Greenberg Quinlan Rosner (D) [110] | September 22−24, 2008 | 47% | 44% | 3 | 1,007 | Not reported |
| Marist College [111] | September 22–23, 2008 | 49% | 44% | 5 | 698 LV | ±4% |
| Fox News/Opinion Dynamics Corporation [112] | September 22–23, 2008 | 45% | 39% | 6 | 900 RV | ±3% |
| Rasmussen Reports/Pulse Opinion Research (Daily Tracking) [98] | September 21–23, 2008 | 49% | 47% | 2 | 3,000 LV | ±2% |
| Gallup (Daily Tracking) [113] | September 20–22, 2008 | 47% | 44% | 3 | 2,740 RV | ±2% |
| American Research Group [2] | September 20–22, 2008 | 48% | 46% | 2 | 1,200 LV | ±3% |
| Diageo/The Hotline/Financial Dynamics (Daily Tracking) [114] | September 20–22, 2008 | 47% | 43% | 4 | 906 RV | ±3.3% |
| NBC News/Wall Street Journal [115] | September 20–22, 2008 | 48% | 46% | 2 | 1,085 RV | ±3.0% |
| Los Angeles Times/Bloomberg [116] | September 19–22, 2008 | 49% | 45% | 4 | 838 LV | Not reported |
| ABC News/Washington Post [117] | September 19–22, 2008 | 52% | 43% | 9 | 780 LV | Not reported |
| McClatchy/Ipsos [118] | September 18–22, 2008 | 44% | 43% | 1 | 923 RV | ±3.2% |
| CNN/Opinion Research Corporation [119] | September 19–21, 2008 | 51% | 47% | 4 | 697 LV | Not reported |
| Hearst-Argyle/Franklin & Marshall College [120] | September 15–21, 2008 | 45% | 47% | 2 | 1,320 RV | ±2.7% |
| Zogby Interactive [121] | September 19–20, 2008 | 46.8% | 43.4% | 3.4 | 2,331 LV | ±2.1% |
| Rasmussen Reports/Pulse Opinion Research (Daily Tracking) [98] | September 18–20, 2008 | 47% | 46% | 1 | 3,000 LV | ±2% |
| Gallup (Daily Tracking) [122] | September 17–19, 2008 | 50% | 44% | 6 | 2,756 RV | ±2% |
| Diageo/The Hotline/Financial Dynamics (Daily Tracking) [123] | September 17–19, 2008 | 45% | 44% | 1 | 922 RV | ±3.2% |
| George Washington University/Tarrance Group/Lake Research Partners [124] | September 11, 14, 17–18, 2008 | 47% | 47% | Tied | 800 LV | ±3% |
| Rasmussen Reports/Pulse Opinion Research (Daily Tracking) [98] | September 15–17, 2008 | 48% | 48% | Tied | 3,000 LV | ±2% |
| Big Ten [125] | September 14–17, 2008 | 46% | 45.1% | 0.9 | 1,114 RV | ±3% |
| The Economist/Polimetrix/YouGov [126] | September 15–16, 2008 | 43% | 45% | 2 | 917 RV | Not reported |
| Diageo/The Hotline/Financial Dynamics (Daily Tracking) [127] | September 14–16, 2008 | 45% | 42% | 3 | 913 RV | ±3.2% |
| Gallup (Daily Tracking) [128] | September 14–16, 2008 | 47% | 45% | 2 | 2,787 RV | ±2% |
| CBS News/New York Times [129] | September 12–16, 2008 | 49% | 44% | 5 | Not reported | Not reported |
| American Research Group [130] | September 13–15, 2008 | 45% | 48% | 3 | 1,200 LV | ±3% |
| Rasmussen Reports/Pulse Opinion Research (Daily Tracking) [131] | September 12–14, 2008 | 47% | 49% | 2 | 3,000 LV | ±2% |
| Pew Research Center [132] | September 9–14, 2008 | 46% | 46% | Tied | 2,307 LV | Not reported |
| Gallup (Daily Tracking) [133] | September 11–13, 2008 | 45% | 47% | 2 | 2,787 RV | ±2% |
| Diageo/The Hotline/Financial Dynamics (Daily Tracking) [134] | September 11–13, 2002 | 45% | 43% | 2 | 904 RV | ±3.3% |
| Reuters/Zogby International [135] | September 11–13, 2008 | 47% | 45% | 2 | 1,008 LV | ±3.1% |
| Newsweek/Princeton Survey Research Associates International [136] | September 10–11, 2008 | 46% | 46% | Tied | 1,038 RV | ±3.8% |
| Rasmussen Reports/Pulse Opinion Research (Daily Tracking) [131] | September 9–11, 2008 | 46% | 49% | 3 | 3,000 LV | ±2% |
| George Washington University/Tarrance Group/Lake Research Partners [137] | September 7–11, 2008 | 44% | 48% | 4 | 1,000 LV | ±3.1% |
| Diageo/The Hotline/Financial Dynamics (Daily Tracking) [138] ) | September 8–10, 2008 | 44% | 46% | 2 | 918 RV | ±3.2% |
| Gallup (Daily Tracking) [139] | September 8–10, 2008 | 44% | 48% | 4 | 2,718 RV | ±2% |
| Democracy Corps/Greenberg Quinlan Rosner (D) [140] | September 5–10, 2008 | 46% | 48% | 2 | 1,000 LV | Not reported |
| Associated Press/GfK Group/Roper [141] | September 5–10, 2008 | 44% | 48% | 4 | 812 LV | ±3.4% |
| Fox News/Opinion Dynamics Corporation [142] | September 8–9, 2008 | 42% | 45% | 3 | 900 RV | ±3% |
| The Economist/Polimetrix/YouGov [143] | September 7–9, 2008 | 41% | 40% | 1 | 877 RV | Not reported |
| McClatchy/Ipsos [144] | September 5–9, 2008 | 45% | 46% | 1 | 876 RV | ±3.3% |
| Poll Position/InsiderAdvantage [145] | September 8, 2008 | 46% | 46% | Tied | 807 LV | ±3.36% |
| NBC News/Wall Street Journal [146] | September 6–8, 2008 | 47% | 46% | 1 | 860 RV | ±3.3% |
| American Research Group [147] | September 6–8, 2008 | 47% | 46% | 1 | 1,200 LV | ±3% |
| Public Opinion Strategies (R) [148] | September 6–8, 2008 | 43% | 46% | 3 | 800 LV | Not reported |
| Rasmussen Reports/Pulse Opinion Research (Daily Tracking) [149] | September 6–8, 2008 | 48% | 48% | Tied | 3,000 LV | ±2% |
| USA Today/Gallup [150] | September 5–7, 2008 | 44% | 54% | 10 | 823 LV | ±4.0% |
| ABC News/Washington Post [151] | September 5–7, 2008 | 47% | 49% | 2 | Not reported | Not reported |
| Diageo/The Hotline/Financial Dynamics (Daily Tracking) [152] | September 5–7, 2008 | 44% | 44% | Tied | 924 RV | ±3.2% |
| CNN/Opinion Research Corporation [153] | September 5–7, 2008 | 48% | 48% | Tied | 942 RV | ±3% |
| Investor's Business Daily/TIPP [154] | September 2–7, 2008 | 45% | 40% | 5 | 868 RV | ±3.3% |
| Gallup (Daily Tracking) [155] | September 4–6, 2008 | 45% | 48% | 3 | 2,765 RV | ±2% |
| Rasmussen Reports/Pulse Opinion Research (Daily Tracking) [156] | September 3–5, 2008 | 49% | 46% | 3 | 3,000 LV | ±2% |
| Diageo/The Hotline/Financial Dynamics (Daily Tracking) [157] | September 2–4, 2008 | 46% | 40% | 6 | 916 RV | ±3.2% |
| CBS News [158] | September 1–3, 2008 | 42% | 42% | Tied | 734 RV | ±4% |
| The Economist/Polimetrix/YouGov [159] | September 1−3, 2008 | 42% | 39% | 3 | 883 RV | Not reported |
| Democracy Corps/Greenberg Quinlan Rosner (D) [160] | September 1–3, 2008 | 49% | 44% | 5 | 1,000 LV | Not reported |
| Gallup (Daily Tracking) [161] | September 1–3, 2008 | 49% | 42% | 7 | 2,771 RV | ±2% |
| Rasmussen Reports/Pulse Opinion Research (Daily Tracking) [162] | August 31–September 2, 2008 | 50% | 45% | 5 | 3,000 LV | ±2% |
| American Research Group [163] | August 30–September 1, 2008 | 49% | 43% | 6 | 1,200 LV | ±3% |
| USA Today/Gallup [164] | August 30–31, 2008 | 50% | 43% | 7 | 1,835 RV | ±3% |
| Diageo/The Hotline/Financial Dynamics [165] | August 29–31, 2008 | 48% | 39% | 9 | 805 RV | ±3.5% |
| CNN/Opinion Research Corporation [166] | August 29–31, 2008 | 49% | 48% | 1 | 927 RV | ±3% |
| CBS News [167] | August 29–31, 2008 | 48% | 40% | 8 | 781 RV | ±4% |
| Zogby Interactive [168] | August 29–30, 2008 | 44.6% | 47.1% | 2.5 | 2,020 LV | ±2.2% |
| Rasmussen Reports/Pulse Opinion Research (Daily Tracking) [169] | August 28–30, 2008 | 49% | 46% | 3 | 3,000 LV | ±2% |
| Gallup (Daily Tracking) [170] | August 27–29, 2008 | 49% | 41% | 8 | 2,709 RV | ±2% |
| Rasmussen Reports/Pulse Opinion Research (Daily Tracking) [131] | August 25–27, 2008 | 47% | 47% | Tied | 3,000 LV | ±2% |
| The Economist/Polimetrix/YouGov [171] | August 25–26, 2008 | 41% | 36% | 5 | 847 RV | Not reported |
| Gallup (Daily Tracking) [172] | August 24–26, 2008 | 45% | 44% | 1 | 2,724 RV | ±2% |
| CNN/Opinion Research Corporation [173] | August 23–24, 2008 | 47% | 47% | Tied | 909 RV | ±3.5% |
| Zogby Interactive [174] | August 23–24, 2008 | 46% | 44% | 2 | 2,248 LV | ±2.1% |
| Rasmussen Reports/Pulse Opinion Research (Daily Tracking) [175] | August 22–24, 2008 | 48% | 45% | 3 | 3,000 LV | ±2% |
| Diageo/The Hotline/Financial Dynamics [176] | August 18–24, 2008 | 44% | 40% | 4 | 1,022 RV | ±3% |
| USA Today/Gallup [177] | August 21–23, 2008 | 48% | 45% | 3 | 765 LV | ±4% |
| ABC News/Washington Post [178] | August 19–22, 2008 | 49% | 45% | 4 | Not reported | Not reported |
| Rasmussen Reports/Pulse Opinion Research (Daily Tracking) [179] | August 19–21, 2008 | 47% | 46% | 1 | 3,000 LV | ±2% |
| Fox News/Opinion Dynamics Corporation [180] | August 19–20, 2008 | 42% | 39% | 3 | 900 RV | ±3% |
| The Economist/Polimetrix/YouGov [181] | August 18–20, 2008 | 39% | 38% | 1 | 915 RV | Not reported |
| Gallup (Daily Tracking) [182] | August 17–19, 2008 | 45% | 43% | 2 | 2,658 RV | ±2% |
| CBS News/New York Times [183] | August 15–19, 2008 | 45% | 42% | 3 | 869 RV | ±3% |
| Rasmussen Reports/Pulse Opinion Research (Daily Tracking) [184] | August 16–18, 2008 | 47% | 45% | 2 | 3,000 LV | ±2% |
| Los Angeles Times/Bloomberg [185] | August 15–18, 2008 | 45% | 43% | 2 | 1,248 RV | Not reported |
| NBC News/Wall Street Journal [186] | August 15–18, 2008 | 45% | 42% | 3 | 1,005 RV | ±3.1% |
| Quinnipiac University [187] | August 12–17, 2008 | 47% | 42% | 5 | 1,547 LV | ±2.5% |
| Reuters/Zogby International [188] | August 14–16, 2008 | 41% | 46% | 5 | 1,089 LV | ±3.0% |
| Gallup (Daily Tracking) [189] | August 14–16, 2008 | 45% | 45% | 1 | 2,671 RV | ±2% |
| Rasmussen Reports/Pulse Opinion Research (Daily Tracking) [190] | August 13–15, 2008 | 46% | 45% | 1 | 3,000 LV | ±2% |
| George Washington University/Tarrance Group/Lake Research Partners [191] | August 10–14, 2008 | 46% | 47% | 1 | 1,000 LV | ±3.1% |
| The Economist/Polimetrix/YouGov [192] | August 11–13, 2008 | 41% | 40% | 1 | 908 RV | Not reported |
| Gallup (Daily Tracking) [193] | August 11–13, 2008 | 46% | 43% | 3 | 2,673 RV | ±2% |
| Rasmussen Reports/Pulse Opinion Research Center (Daily Tracking) [194] | August 10–12, 2008 | 48% | 46% | 2 | 3,000 LV | ±2% |
| Gallup (Daily Tracking) [195] | August 8–10, 2008 | 47% | 42% | 5 | 2,648 RV | ±2% |
| Pew Research Center [196] | July 31–August 10, 2008 | 47% | 42% | 5 | 2,414 RV | ±2.5% |
| Rasmussen Reports/Pulse Opinion Research (Daily Tracking) [197] | August 7–9, 2008 | 48% | 46% | 2 | 3,000 LV | ±2% |
| Investor's Business Daily/TIPP [198] | August 4–9, 2008 | 43% | 38% | 5 | 925 RV | Not reported |
| Gallup (Daily Tracking) [199] | August 5–7, 2008 | 46% | 43% | 3 | 2,718 RV | ±2% |
| Harris Interactive [200] | August 1–7, 2008 | 47% | 38% | 9 | 2,488 RV | Not reported |
| Sacred Heart University [201] | July 28–August 7, 2008 | 37.8% | 27% | 10.8 | 800 A | Not reported |
| Rasmussen Reports/Pulse Opinion Research (Daily Tracking) [202] | August 4–6, 2008 | 47% | 46% | 1 | 3,000 LV | ±2% |
| The Economist/Polimetrix/YouGov [203] | August 4–6, 2008 | 42% | 39% | 3 | 922 RV | Not reported |
| CBS News [204] | July 31–August 5, 2008 | 45% | 39% | 6 | 851 RV | Not reported |
| Gallup (Daily Tracking) [205] | August 2–4, 2008 | 47% | 43% | 4 | 2,674 RV | ±2% |
| Associated Press/Ipsos [206] | July 31–August 4, 2008 | 48% | 42% | 6 | 833 RV | ±3.4% |
| Time/Schulman, Bucuvalas, & Ronca Inc. (SRBI) [207] | July 31–August 4, 2008 | 46% | 41% | 5 | 808 LV | ±3.5% |
| Rasmussen Reports/Pulse Opinion Research (Daily Tracking) [208] | August 1–3, 2008 | 46% | 47% | 1 | 3,000 LV | ±2% |
| Gallup (Daily Tracking) [209] | July 31–August 1, 2008 | 45% | 44% | 1 | 2,684 RV | ±2% |
| Rasmussen Reports/Pulse Opinion Research (Daily Tracking) [210] | July 29–31, 2008 | 47% | 46% | 1 | 3,000 LV | ±2% |
| Gallup (Daily Tracking) [211] | July 28–30, 2008 | 45% | 44% | 1 | 2,679 RV | ±2% |
| Rasmussen Reports/Pulse Opinion Research (Daily Tracking) [212] | July 26–28, 2008 | 47% | 46% | 1 | 3,000 LV | ±2% |
| The Economist/Polimetrix/YouGov [213] | July 26–27, 2008 | 44% | 37% | 7 | 932 RV | Not reported |
| CNN/Opinion Research Corporation [214] | July 25–27, 2008 | 51% | 44% | 7 | 914 RV | ±3% |
| USA Today/Gallup [215] | July 25–27, 2008 | 45% | 49% | 4 | 791 LV | ±4% |
| Pew Research Center [216] | July 23–27, 2008 | 47% | 42% | 5 | 1,241 RV | ±3.5% |
| Rasmussen Reports/Pulse Opinion Research (Daily Tracking) [217] | July 23–25, 2008 | 49% | 43% | 6 | 3,000 LV | ±2% |
| The Economist/Polimetrix/YouGov [218] | July 22–24, 2008 | 41% | 38% | 3 | 921 RV | Not reported |
| Democracy Corps/Greenberg Quinlan Rosner (D) [219] | July 21–24, 2008 | 50% | 45% | 6 | 1,004 LV | Not reported |
| Fox News/Opinion Dynamics Corporation [220] | July 22–23, 2008 | 41% | 40% | 1 | 900 RV | ±3% |
| Gallup (Daily Tracking) [221] | July 21–23, 2008 | 45% | 43% | 2 | 2,660 RV | ±2% |
| Rasmussen Reports/Pulse Opinion Research (Daily Tracking) [222] | July 20–22, 2008 | 47% | 45% | 2 | 3,000 LV | ±2% |
| NBC News/Wall Street Journal [223] | July 18–21, 2008 | 47% | 41% | 6 | 1,003 RV | ±3.1% |
| Gallup (Daily Tracking) [224] | July 18–20, 2008 | 47% | 41% | 6 | 2,653 RV | ±2% |
| Rasmussen Reports/Pulse Opinion Research (Daily Tracking) [225] | July 17–19, 2008 | 47% | 45% | 2 | 3,000 LV | ±2% |
| The Economist/Polimetrix/YouGov [226] | July 15–17, 2008 | 41% | 36% | 5 | 999 A | ±4% |
| Gallup (Daily Tracking) [227] | July 15–17, 2008 | 45% | 44% | 1 | 2,641 RV | ±2% |
| Rasmussen Reports/Pulse Opinion Research (Daily Tracking) [228] | July 14–16, 2008 | 46% | 46% | Tied | 3,000 LV | ±2% |
| Gallup (Daily Tracking) [229] | July 12–14, 2008 | 47% | 43% | 4 | 2,637 RV | ±2% |
| CBS News/New York Times [230] | July 7–14, 2008 | 45% | 39% | 6 | 1,462 RV | ±3% |
| Rasmussen Reports/Pulse Opinion Research (Daily Tracking) [231] | July 11–13, 2008 | 46% | 43% | 3 | 3,000 LV | ±2% |
| ABC News/Washington Post [232] | July 10–13, 2008 | 49% | 46% | 3 | Not reported | Not reported |
| Reuters/Zogby International [233] | July 9–13, 2008 | 47% | 40% | 7 | 1,039 LV | ±3.1% |
| Quinnipiac University [234] | July 8–13, 2008 | 50% | 41% | 9 | 1,725 LV | ±2.4% |
| Gallup (Daily Tracking) [235] | July 9–11, 2008 | 47% | 43% | 4 | 2,641 RV | ±2% |
| Investor's Business Daily/TIPP [236] | July 7–11, 2008 | 40% | 37% | 3 | 854 RV | Not reported |
| Harris Interactive [237] | July 3–11, 2008 | 44% | 35% | 9 | Not reported | Not reported |
| Newsweek/Princeton Survey Research Associates International [238] | July 9–10, 2008 | 44% | 41% | 3 | 1,037 RV | ±3.6% |
| Rasmussen Reports/Pulse Opinion Research (Daily Tracking) [239] | July 8–10, 2008 | 47% | 45% | 2 | 3,000 LV | ±2% |
| The Economist/Polimetrix/YouGov [240] | July 7–9, 2008 | 39% | 38% | 1 | 997 A | ±4% |
| Gallup (Daily Tracking) [241] | July 6–8, 2008 | 46% | 44% | 2 | 2,666 RV | ±2% |
| Rasmussen Reports/Pulse Opinion Research (Daily Tracking) [242] | July 2, 6–7, 2008 | 49% | 43% | 6 | 3,000 LV | ±2% |
| Gallup (Daily Tracking) [243] | July 2–3, 5, 2008 | 48% | 42% | 6 | 2,620 RV | ±2% |
| The Economist/Polimetrix/YouGov [244] | July 1–2, 2008 | 37% | 34% | 3 | 998 A | ±4% |
| Gallup (Daily Tracking) [245] | June 30–July 2, 2008 | 47% | 43% | 4 | 2,641 RV | ±2% |
| Rasmussen Reports/Pulse Opinion Research (Daily Tracking) [246] | June 29–July 1, 2008 | 49% | 44% | 5 | 3,000 LV | ±2% |
| CNN/Opinion Research Corporation [247] | June 26–29, 2008 | 50% | 45% | 5 | 906 RV | ±3.5% |
| McLaughlin & Associates [248] | June 26–29, 2008 | 46% | 38% | 8 | 1,000 LV | ±3.1% |
| Gallup (Daily Tracking) [249] | June 26, 28–29, 2008 | 46% | 42% | 4 | 2,656 RV | ±2% |
| Pew Research Center [250] | June 18–29, 2008 | 48% | 40% | 8 | 1,574 RV | Not reported |
| Rasmussen Reports/Pulse Opinion Research (Daily Tracking) [251] | June 26–28, 2008 | 49% | 43% | 6 | 3,000 LV | ±2% |
| The Economist/Polimetrix/YouGov [252] | June 23–25, 2008 | 36% | 34% | 2 | 991 A | ±4% |
| Gallup (Daily Tracking) [253] | June 23–25, 2008 | 44% | 44% | Tied | 2,605 RV | ±2% |
| Rasmussen Reports/Pulse Opinion Research (Daily Tracking) [254] | June 23–25, 2008 | 49% | 45% | 4 | 3,000 LV | ±2% |
| Democracy Corps/Greenberg Quinlan Rosner (D) [255] | June 22–25, 2008 | 49% | 45% | 4 | 2,000 LV | Not reported |
| Time/Schulman, Ronca, & Bucuvalas Inc. (SRBI) [256] | June 18−25, 2008 | 47% | 43% | 4 | 803 LV | ±3% |
| Los Angeles Times/Bloomberg [257] | June 19–23, 2008 | 49% | 37% | 12 | 1,115 RV | ±3% |
| Associated Press/Yahoo News/Knowledge Networks [258] | June 13–23, 2008 | 40% | 39% | 1 | 1,507 RV | ±2.5% |
| Gallup (Daily Tracking) [259] | June 20–22, 2008 | 46% | 43% | 3 | 2,608 RV | ±2% |
| Rasmussen Reports/Pulse Opinion Research (Daily Tracking) [254] | June 20–22, 2008 | 49% | 43% | 5 | 3,000 LV | ±2% |
| Hearst-Argyle/Franklin & Marshall College [260] | June 15–22, 2008 | 42% | 36% | 6 | 1,501 RV | ±2.5% |
| Newsweek/Princeton Survey Research Associates International [261] | June 18–19, 2008 | 51% | 36% | 15 | 896 RV | ±4% |
| Rasmussen Reports/Pulse Opinion Research [262] | June 17–19, 2008 | 48% | 44% | 4 | 3,000 LV | ±2% |
| USA Today/Gallup [263] | June 15–19, 2008 | 50% | 44% | 6 | 1,310 LV | ±3% |
| Fox News/Opinion Dynamics [264] | June 17–18, 2008 | 45% | 41% | 4 | 900 RV | ±3% |
| The Economist/Polimetrix/YouGov [265] | June 16–17, 2008 | 37% | 34% | 3 | 1,000 A | ±4% |
| Rasmussen Reports/Pulse Opinion Research (Daily Tracking) [266] | June 14–16, 2008 | 48% | 44% | 4 | 3,000 LV | ±2% |
| ABC News/Washington Post [267] | June 12–15, 2008 | 49% | 45% | 3 | Not reported | Not reported |
| Reuters/Zogby International [268] | June 12–14, 2008 | 47% | 42% | 5 | 1,113 LV | ±3.0% |
| Rasmussen Reports/Pulse Opinion Research (Daily Tracking) [269] | June 11–13, 2008 | 49% | 43% | 6 | 3,000 LV | ±2% |
| Gallup (Daily Tracking) [270] | June 10, 12–13, 2008 | 45% | 42% | 3 | 2,691 RV | ±2% |
| Harris Interactive [271] | June 5–13, 2008 | 44% | 33% | 11 | Not reported | Not reported |
| The Economist/Polimetrix/YouGov [272] | June 10–11, 2008 | 37% | 33% | 4 | 996 A | ±4% |
| Ipsos [273] | June 5–11, 2008 | 50% | 43% | 7 | 467 LV | Not reported |
| Rasmussen Reports/Pulse Opinion Research (Daily Tracking) [274] | June 8–10, 2008 | 49% | 44% | 5 | 3,000 LV | ±2% |
| Gallup (Daily Tracking) [275] | June 7–9, 2008 | 48% | 41% | 7 | 2,633 RV | ±2% |
| NBC News/Wall Street Journal [276] | June 6–9, 2008 | 47% | 41% | 6 | 1,000 RV | ±3.1% |
| Diageo/The Hotline/Financial Dynamics [277] | June 5–8, 2008 | 44% | 42% | 2 | 806 RV | ±3.5% |
| Investor's Business Daily/TIPP [278] | June 2–8, 2008 | 42.5% | 40.4% | 2.1 | 916 RV | Not reported |
| Rasmussen Reports/Pulse Opinion Research (Daily Tracking) [266] | June 5–7, 2008 | 50% | 43% | 7 | 3,000 LV | ±2% |
| Gallup (Daily Tracking) [279] | June 2–6, 2008 | 46% | 45% | 1 | 4,408 RV | ±2% |
| Rasmussen Reports/Pulse Opinion Research (Daily Tracking) [266] | June 2–4, 2008 | 47% | 45% | 2 | 3,000 LV | ±2% |
| Cook Political Report/RT Strategies [280] | May 29–31, 2008 | 44% | 43% | 1 | 802 RV | ±3.5% |
| Lombardo Consulting Group [281] | May 26–28, 2008 | 44% | 40% | 4 | 1,000 RV | Not reported |
| Democracy Corps/Greenberg Quinlan Rosner (D) [282] | May 19–26, 2008 | 47% | 47% | Tied | 1,600 LV | Not reported |
Three-way contest
| Poll Source | Date | Barack Obama (D) | John McCain (R) | Ralph Nader (I) | Sample size | Margin of error |
|---|---|---|---|---|---|---|
| McClatchy/Ipsos [283] | October 30–November 1, 2008 | 50% | 42% | 1% | 760 LV | ±3.6% |
| Associated Press/Yahoo News/Knowledge Networks [258] | June 13–23, 2008 | 40% | 39% | 3% | 1,507 RV | ±2.5% |
| Poll Source | Date | Barack Obama (D) | John McCain (R) | Bob Barr (L) | Ralph Nader (I) | Sample size | Margin of error | ||
|---|---|---|---|---|---|---|---|---|---|
| Tarrance Group [284] | November 2–3, 2008 | 50.2% | 48.3% | 0.9% | 0.6% | 800 LV | ±3.5% | ||
| Lake Research Partners [285] | November 2–3, 2008 | 51.5% | 46.5% | 1% | 1% | 800 LV | ±3.5% | ||
| Harris Interactive [286] | October 30–November 3, 2008 | 52% | 44% | 1% | 1% | 3,946 LV | Not reported | ||
| Democracy Corps/Greenberg Quinlan Rosner (D) [287] | October 30–November 2, 2008 | 51% | 44% | 2% | 1% | 1,000 LV | Not reported | ||
| McClatchy/Ipsos [28] | October 23–27, 2008 | 48% | 42% | 1% | 1% | 831 LV | ±3.4% | ||
| Harris Interactive [288] | October 20–27, 2008 | 50% | 44% | 1% | 2% | 1,590 LV | Not reported | ||
| Associated Press/Yahoo News/Knowledge Networks [289] | October 17–27, 2008 | 51% | 43% | 1% | 2% | Not reported | Not reported | ||
| Pew Research Center [290] | October 23−26, 2008 | 53% | 38% | 0% | 2% | 1,198 LV | ±3.5% | ||
| Democracy Corps/Greenberg Quinlan Rosner (D) [291] | October 21–23, 2008 | 52% | 43% | 1% | 2% | 1,000 LV | Not reported | ||
| George Washington University/Tarrance Group/Lake Research Partners (Daily Tracking) [292] | October 16, 19–22, 2008 | 48% | 45% | 1% | 2% | 1,000 LV | ±3.5% | ||
| Harris Interactive [293] | October 16–20, 2008 | 50% | 44% | 1% | 1% | 1,390 LV | Not reported | ||
| Associated Press/GfK Group/Roper [294] | October 16–20, 2008 | 44% | 43% | 1% | 1% | 800 LV | ±3.5% | ||
| McClatchy/Ipsos [295] | October 16–20, 2008 | 50% | 42% | 0% | 1% | 773 LV | ±3.5% | ||
| Democracy Corps/Greenberg Quinlan Rosner (D) [291] | October 15–19, 2008 | 49% | 44% | 2% | 3% | 1,000 LV | Not reported | ||
| McClatchy/Ipsos [296] | October 9–13, 2008 | 48% | 39% | 1% | 2% | 1,036 RV | ±3.0% | ||
| Associated Press/Yahoo News/Knowledge Networks [297] | October 3–13, 2008 | 49% | 44% | 1% | 1% | 1,528 LV | ±2.5% | ||
| George Washington University/Tarrance Group/Lake Research Partners (Daily Tracking) [292] | October 6–9, 2008 | 51% | 41% | 1% | 2% | 800 LV | ±3.5% | ||
| McClatchy/Ipsos [298] | October 2–6, 2008 | 47% | 40% | 1% | 3% | 858 RV | ±3.3% | ||
| George Washington University/Tarrance Group/Lake Research Partners (Daily Tracking) [292] | October 2–5, 2008 | 48% | 44% | 1% | 2% | 800 LV | ±3.5% | ||
| Associated Press/GfK Group/Roper [94] | September 27–30, 2008 | 48% | 41% | 1% | 2% | 808 LV | ±3.4% | ||
| McClatchy/Ipsos [99] | September 26–29, 2008 | 46% | 42% | 1% | 2% | 1,007 RV | ±3.1% | ||
| George Washington University/Tarrance Group/Lake Research Partners [299] | September 21–25, 2008 | 45% | 47% | 1% | 2% | 1,000 LV | ±3.1% | ||
| Harris Interactive [300] | September 15–22, 2008 | 47% | 46% | 1% | 2% | 1,590 LV | Not reported | ||
| McClatchy/Ipsos [301] | September 11–15, 2008 | 45% | 45% | 1% | 2% | 1,046 RV | ±3% | ||
| Associated Press/Yahoo News/Knowledge Networks [302] | September 5–15, 2008 | 42% | 44% | 1% | 2% | 1,546 RV | ±2.5% | ||
| Reuters/Zogby International [135] | September 11–13, 2008 | 45% | 45% | 1-2% | 1-2% | 1,008 LV | ±3.1% | ||
| George Washington University/Tarrance Group/Lake Research Partners [299] | September 7−11, 2008 | 44% | 48% | 1% | 1% | 1,000 LV | ±3.1% | ||
| Associated Press/GfK Group/Roper [303] | September 5–10, 2008 | 44% | 48% | 1% | 1% | 812 LV | ±3.4% | ||
| Associated Press/Yahoo News/Stanford University/Knowledge Networks [304] | August 27–September 5, 2008 | 43% | 39% | 1% | 2% | 1,728 RV | ±2.4% | ||
| Zogby Interactive [168] | August 29–30, 2008 | 44% | 43% | 5% | 2% | 2,020 LV | ±2.2% | ||
| Reuters/Zogby International [188] | August 14–16, 2008 | 39% | 44% | 3% | 2% | 1,089 LV | ±3.0% | ||
| Zogby Interactive [305] | August 12–14, 2008 | 43% | 40% | 6% | 2% | 3,339 LV | ±1.7% | ||
| Associated Press/Ipsos [206] | July 31–August 4, 2008 | 47% | 41% | 2% | 3% | 833 RV | ±3.4% | ||
| Associated TV/Zogby International [306] | July 31–August 1, 2008 | 41% | 42% | 2% | 2% | 1,011 LV | ±3.1% | ||
| Fox News/Opinion Dynamics Corporation [220] | July 22–23, 2008 | 40% | 37% | 0% | 2% | 900 RV | ±3% | ||
| ABC News/Washington Post [232] | July 10–13, 2008 | 49% | 39% | 2% | 5% | Not reported | Not reported | ||
| Reuters/Zogby International [233] | July 9–13, 2008 | 46% | 36% | 3% | 3% | 1,039 LV | ±3,1% | ||
| Los Angeles Times/Bloomberg [257] | June 19–23, 2008 | 48% | 33% | Bob Barr | 4% | Ralph Nader | 3% | 1,115 RV | ±3% |
| Fox News/Opinion Dynamics Corporation [307] | June 17–18, 2008 | 42% | 39% | 2% | 4% | 900 RV | ±3% | ||
| ABC News/Washington Post [267] | June 12–15, 2008 | 49% | 39% | 2% | 5% | Not reported | Not reported | ||
| CNN/Opinion Research Corporation [308] | June 4–5, 2008 | 47% | 43% | 2% | 6% | 921 RV | ±3% |
| Poll Source | Date | Barack Obama (D) | John McCain (R) | Bob Barr (L) | Cynthia McKinney (G) | Ralph Nader (I) | Sample size | Margin of error |
|---|---|---|---|---|---|---|---|---|
| CNN/Opinion Research Corporation [309] | October 30–November 1, 2008 | 51% | 43% | 1% | 1% | 2% | 714 LV | ±3.5% |
| Zogby Interactive [102] | Sept. 26–27, 2008 | 46.4% | 43.4% | 3.7% | 0.6% | 1.0% | 2,102 LV | ±2.2% |
| CNN/Opinion Research Corporation [119] | Sept. 19–21, 2008 | 48% | 45% | 1% | 1% | 4% | 909 RV | ±3% |
| Zogby Interactive [174] | August 23–24, 2008 | 45% | 43% | 4% | 1% | 1% | 2,248 LV | ±2.1% |
Related article: Graphical Representations of Two-Way Contest Data
| Poll Source | Date administered | Democrat | % | Republican | % | Sample size | Margin of error |
|---|---|---|---|---|---|---|---|
| CNN/Opinion Research Corporation [308] | June 4–5, 2008 | Hillary Clinton | 49% | John McCain | 48% | 921 RV | ±3% |
| Barack Obama | 49% | John McCain | 46% | ||||
| CBS News [310] | May 30–June 3, 2008 | Hillary Clinton | 50% | John McCain | 41% | 930 RV | ±4% |
| Barack Obama | 48% | John McCain | 42% | ||||
| USA Today/Gallup [311] | May 30–June 1, 2008 | Hillary Clinton | 48% | John McCain | 44% | 803 LV | ±4% |
| Barack Obama | 49% | John McCain | 44% | ||||
| Rasmussen Reports/Pulse Opinion Research (Daily Tracking) [312] | May 29–June 1, 2008 | Hillary Clinton | 44% | John McCain | 46% | 1,600 LV | ±3% |
| Barack Obama | 45% | John McCain | 45% | ||||
| Gallup (Daily Tracking) [313] | May 24–25, 27–29, 2008 | Hillary Clinton | 47% | John McCain | 45% | 4,368 RV | ±2% |
| Barack Obama | 46% | John McCain | 45% | ||||
| The Economist/Polimetrix/YouGov [314] | May 27–28, 2008 | Hillary Clinton | 42% | John McCain | 44% | 997 A | ±4% |
| Barack Obama | 38% | John McCain | 48% | 995 A | |||
| Rasmussen Reports/Pulse Opinion Research (Daily Tracking) [312] | May 25–28, 2008 | Hillary Clinton | 46% | John McCain | 46% | 1,600 LV | ±3% |
| Barack Obama | 42% | John McCain | 47% | ||||
| Pew Research Center [315] | May 21–25, 2008 | Hillary Clinton | 48% | John McCain | 44% | 1,242 RV | ±3.5% |
| Barack Obama | 47% | John McCain | 44% | ||||
| Rasmussen Reports/Pulse Opinion Research (Daily Tracking) [316] | May 21–24, 2008 | Hillary Clinton | 47% | John McCain | 44% | 1,600 LV | ±3% |
| Barack Obama | 44% | John McCain | 46% | ||||
| Gallup (Daily Tracking) [317] | May 19–23, 2008 | Hillary Clinton | 49% | John McCain | 45% | 4,460 RV | ±2% |
| Barack Obama | 45% | John McCain | 46% | ||||
| Newsweek/Princeton Survey Research Associates International [318] | May 21–22, 2008 | Hillary Clinton | 48% | John McCain | 44% | 1,205 RV | ±3.5% |
| Barack Obama | 46% | John McCain | 46% | ||||
| The Economist/Polimetrix/YouGov [319] | May 20–21, 2008 | Hillary Clinton | 45% | John McCain | 40% | 994 A | ±4% |
| Barack Obama | 43% | John McCain | 41% | 998 A | |||
| Rasmussen Reports/Pulse Opinion Research (Daily Tracking) [316] | May 17–20, 2008 | Hillary Clinton | 45% | John McCain | 45% | 1,600 LV | ±3% |
| Barack Obama | 44% | John McCain | 45% | ||||
| Harris Interactive [320] | May 8–19, 2008 | Hillary Clinton | 39% | John McCain | 36% | Not reported | Not reported |
| Barack Obama | 41% | John McCain | 47% | ||||
| Reuters/Zogby International [321] | May 15–18, 2008 | Hillary Clinton | 43% | John McCain | 43% | 1,076 LV | ±3.0% |
| Barack Obama | 48% | John McCain | 40% | ||||
| Gallup (Daily Tracking) [322] | May 14–18, 2008 | Hillary Clinton | 48% | John McCain | 44% | 4,444 RV | ±2% |
| Barack Obama | 46% | John McCain | 45% | ||||
| Investor's Business Daily/TIPP [323] | May 12–18, 2008 | Hillary Clinton | 44% | John McCain | 39% | 876 RV | ±3.2% |
| Barack Obama | 48% | John McCain | 37% | ||||
| Rasmussen Reports/Pulse Opinion Research (Daily Tracking) [324] | May 13–16, 2008 | Hillary Clinton | 44% | John McCain | 44% | 1,600 LV | ±3% |
| Barack Obama | 44% | John McCain | 45% | ||||
| The Economist/Polimetrix/YouGov [325] | May 14–15, 2008 | Hillary Clinton | 44% | John McCain | 40% | 993 A | ±4% |
| Barack Obama | 39% | John McCain | 42% | 995 A | |||
| Democracy Corps/Greenberg Quinlan Rosner (D) [326] | May 13–15, 2008 | Hillary Clinton | 43% | John McCain | 51% | 1014 LV | Not reported |
| Barack Obama | 49% | John McCain | 47% | ||||
| George Washington University/Tarrance Group/Lake Research [327] | May 11–14, 2008 | Hillary Clinton | 49% | John McCain | 47% | 1,000 LV | ±3.1% |
| Barack Obama | 48% | John McCain | 46% | ||||
| Gallup (Daily Tracking) [328] | May 9–13, 2012 | Hillary Clinton | 48% | John McCain | 45% | 4,381 RV | ±2% |
| Barack Obama | 46% | John McCain | 45% | ||||
| Rasmussen Reports/Pulse Opinion Research (Daily Tracking) [329] | May 9–12, 2008 | Hillary Clinton | 45% | John McCain | 47% | 1,600 LV | ±3% |
| Barack Obama | 47% | John McCain | 46% | ||||
| Quinnipiac University [330] | May 8–12, 2008 | Hillary Clinton | 46% | John McCain | 41% | 1,745 RV | ±2.4% |
| Barack Obama | 47% | John McCain | 40% | ||||
| ABC News/Washington Post [331] | May 8–11, 2008 | Hillary Clinton | 49% | John McCain | 46% | Not reported | Not reported |
| Barack Obama | 51% | John McCain | 44% | ||||
| NPR/Public Opinion Strategies/Greenberg Quinlan Rosner [332] | May 7–8, 10, 2008 | Hillary Clinton | 45% | John McCain | 46% | 800 LV | ±3.46% |
| Barack Obama | 48% | John McCain | 43% | ||||
| Rasmussen Reports/Pulse Opinion Research (Daily Tracking) [333] | May 5–8, 2008 | Hillary Clinton | 48% | John McCain | 43% | 1,600 LV | ±3% |
| Barack Obama | 47% | John McCain | 44% | ||||
| Gallup (Daily Tracking) [334] | May 4–8, 2008 | Hillary Clinton | 48% | John McCain | 44% | 4,348 RV | ±2% |
| Barack Obama | 46% | John McCain | 45% | ||||
| Los Angeles Times/Bloomberg [335] | May 1–8, 2008 | Hillary Clinton | 47% | John McCain | 38% | 1,986 RV | ±3% |
| Barack Obama | 46% | John McCain | 40% | ||||
| The Economist/Polimetrix/YouGov [336] | May 5–6, 2008 | Hillary Clinton | 39% | John McCain | 47% | 996 A | ±4% |
| Barack Obama | 39% | John McCain | 46% | ||||
| Rasmussen Reports/Pulse Opinion Research (Daily Tracking) [333] | May 1–4, 2008 | Hillary Clinton | 43% | John McCain | 47% | 1,600 LV | ±3% |
| Barack Obama | 43% | John McCain | 47% | ||||
| Ipsos [337] | April 30 – May 4, 2008 | Hillary Clinton | 47% | John McCain | 42% | 755 RV | ±3.6% |
| Barack Obama | 46% | John McCain | 42% | ||||
| USA Today/Gallup [338] | May 1–3, 2008 | Hillary Clinton | 46% | John McCain | 49% | 803 LV | ±5% |
| Barack Obama | 47% | John McCain | 48% | ||||
| CBS News/New York Times [339] | May 1–3, 2008 | Hillary Clinton | 53% | John McCain | 41% | 601 RV | Not reported |
| Barack Obama | 51% | John McCain | 40% | ||||
| Diageo/The Hotline/Financial Dynamics [340] | April 30 – May 3, 2008 | Hillary Clinton | 46% | John McCain | 43% | 803 RV | ±3.5% |
| Barack Obama | 47% | John McCain | 43% | ||||
| The Economist/Polimetrix/YouGov [341] | April 30–May 2, 2008 | Hillary Clinton | 44% | John McCain | 41% | 993 A | ±4% |
| Barack Obama | 43% | John McCain | 41% | 998 A | |||
| CNN/Opinion Research Corporation [342] | April 28–30, 2008 | Hillary Clinton | 49% | John McCain | 44% | 906 RV | ±3.5% |
| Barack Obama | 49% | John McCain | 45% | ||||
| Rasmussen Reports/Pulse Opinion Research (Daily Tracking) [343] | April 27–30, 2008 | Hillary Clinton | 44% | John McCain | 44% | 1,600 LV | ±3% |
| Barack Obama | 43% | John McCain | 46% | ||||
| Gallup (Daily Tracking) [344] | April 26–30, 2008 | Hillary Clinton | 46% | John McCain | 46% | 4,369 RV | ±2% |
| Barack Obama | 43% | John McCain | 47% | ||||
| Fox News/Opinion Dynamics [345] | April 28–29, 2008 | Hillary Clinton | 45% | John McCain | 44% | 900 RV | ±3% |
| Barack Obama | 43% | John McCain | 46% | ||||
| CBS News/New York Times [346] | April 25–29, 2008 | Hillary Clinton | 48% | John McCain | 43% | 891 RV | Not reported |
| Barack Obama | 45% | John McCain | 45% | ||||
| NBC News/Wall Street Journal [347] | April 25–28, 2008 | Hillary Clinton | 45% | John McCain | 44% | 1,006 RV | ±3.1% |
| Barack Obama | 46% | John McCain | 43% | ||||
| Pew Research Center [348] | April 23–27, 2008 | Hillary Clinton | 49% | John McCain | 45% | 1,323 RV | Not reported |
| Barack Obama | 50% | John McCain | 44% | ||||
| Associated Press/Ipsos [349] | April 23–27, 2008 | Hillary Clinton | 50% | John McCain | 41% | 760 RV | ±3.6% |
| Barack Obama | 46% | John McCain | 44% | ||||
| Rasmussen Reports/Pulse Opinion Research (Daily Tracking) [350] | April 23–26, 2008 | Hillary Clinton | 45% | John McCain | 47% | 1,600 LV | ±3% |
| Barack Obama | 46% | John McCain | 46% | ||||
| Newsweek/Princeton Survey Research Associates International [351] | April 24–25, 2008 | Hillary Clinton Barack Obama | 48% 47% | John McCain John McCain | 45% 44% | 1,203 RV | ±3% |
| Gallup (Daily Tracking) [352] | April 21–25, 2008 | Hillary Clinton | 47% | John McCain | 44% | 4,397 RV | ±2% |
| Barack Obama | 45% | John McCain | 45% | ||||
| The Economist/Polimetrix/YouGov [353] | April 21–22, 2008 | Hillary Clinton | 43% | John McCain | 44% | 993 A | ±4% |
| Barack Obama | 42% | John McCain | 45% | 995 A | |||
| Rasmussen Reports/Pulse Opinion Research (Daily Tracking) [350] | April 19–22, 2008 | Hillary Clinton | 44% | John McCain | 47% | 1,600 LV | ±3% |
| Barack Obama | 44% | John McCain | 47% | ||||
| USA Today/Gallup [354] | April 18–20, 2008 | Hillary Clinton | 49% | John McCain | 45% | 832 LV | ±4% |
| Barack Obama | 49% | John McCain | 44% | ||||
| Cook Political Report/RT Strategies [355] | April 17–20, 2008 | Hillary Clinton | 45% | John McCain | 46% | 802 RV | ±3.5% |
| Barack Obama | 44% | John McCain | 45% | ||||
| Rasmussen Reports/Pulse Opinion Research (Daily Tracking) [356] | April 15–18, 2008 | Hillary Clinton | 42% | John McCain | 49% | 1,600 LV | ±3% |
| Barack Obama | 41% | John McCain | 48% | ||||
| Gallup (Daily Tracking) [357] | April 14–18, 2008 | Hillary Clinton | 46% | John McCain | 44% | 4,392 RV | ±2% |
| Barack Obama | 45% | John McCain | 44% | ||||
| Newsweek/Princeton Survey Research Associates International [358] | April 16–17, 2008 | Hillary Clinton | 47% | John McCain | 43% | 1,209 RV | ±3% |
| Barack Obama | 48% | John McCain | 44% | ||||
| Democracy Corps/Greenberg Quinlan Rosner (D) [359] | April 15–17, 2008 | Hillary Clinton | 47% | John McCain | 49% | 1,000 LV | Not reported |
| Barack Obama | 48% | John McCain | 47% | ||||
| The Economist/Polimetrix/YouGov [360] | April 15–16, 2008 | Hillary Clinton | 40% | John McCain | 45% | 997 A | ±4% |
| Barack Obama | 42% | John McCain | 45% | 995 A | |||
| Rasmussen Reports/Pulse Opinion Research (Daily Tracking) [350] | April 11–14, 2008 | Hillary Clinton | 41% | John McCain | 48% | 1,600 LV | ±3% |
| Barack Obama | 43% | John McCain | 47% | ||||
| ABC News/Washington Post [361] | April 10–13, 2008 | Hillary Clinton | 45% | John McCain | 48% | Not reported | Not reported |
| Barack Obama | 49% | John McCain | 44% | ||||
| Gallup (Daily Tracking) [362] | April 9–13, 2008 | Hillary Clinton | 46% | John McCain | 45% | 4,415 RV | ±2% |
| Barack Obama | 46% | John McCain | 44% | ||||
| Harris Interactive [363] | April 11–12, 2008 | Hillary Clinton | 39% | John McCain | 38% | Not reported | Not reported |
| Barack Obama | 41% | John McCain | 36% | ||||
| Reuters/Zogby International [364] | April 10–12, 2008 | Hillary Clinton | 41% | John McCain | 46% | 1,046 LV | ±3.1% |
| Barack Obama | 45% | John McCain | 45% | ||||
| Rasmussen Reports/Pulse Opinion Research (Daily Tracking) [365] | April 7–10, 2008 | Hillary Clinton | 42% | John McCain | 48% | 1,600 LV | ±3% |
| Barack Obama | 44% | John McCain | 47% | ||||
| Associated Press/Ipsos [366] | April 7–9, 2008 | Hillary Clinton | 48% | John McCain | 45% | 749 RV | ±3.6% |
| Barack Obama | 45% | John McCain | 45% | ||||
| Gallup (Daily Tracking) [367] | April 4–8, 2008 | Hillary Clinton | 46% | John McCain | 46% | 4,366 RV | ±2% |
| Barack Obama | 46% | John McCain | 44% | ||||
| The Economist/Polimetrix/YouGov [368] | April 4–7, 2008 | Hillary Clinton | 43% | John McCain | 44% | 994 A | ±4% |
| Barack Obama | 43% | John McCain | 44% | ||||
| Rasmussen Reports/Pulse Opinion Research (Daily Tracking) [369] | April 3−6, 2008 | Hillary Clinton | 44% | John McCain | 47% | 1,600 LV | ±3% |
| Barack Obama | 45% | John McCain | 46% | ||||
| Investor's Business Daily/TIPP [370] | April 1–6, 2008 | Hillary Clinton | 38% | John McCain | 45% | 916 RV | Not reported |
| Barack Obama | 44% | John McCain | 44% | ||||
| Gallup (Daily Tracking) [371] | March 31–April 3, 2008 | Hillary Clinton | 45% | John McCain | 46% | 4,433 RV | ±2% |
| Barack Obama | 45% | John McCain | 46% | ||||
| Rasmussen Reports/Pulse Opinion Research (Daily Tracking) [372] | March 30–April 2, 2008 | Hillary Clinton | 42% | John McCain | 47% | 1,600 LV | ±3% |
| Barack Obama | 41% | John McCain | 48% | ||||
| CBS News/New York Times [373] | March 28 – April 2, 2008 | Hillary Clinton | 48% | John McCain | 43% | 1,196 RV | Not reported |
| Barack Obama | 47% | John McCain | 42% | ||||
| Diageo/The Hotline/Financial Dynamics [374] | March 28–31, 2008 | Hillary Clinton | 41% | John McCain | 50% | 799 RV | ±3.5% |
| Barack Obama | 44% | John McCain | 46% | ||||
| Gallup (Daily Tracking) [375] | March 26–30, 2008 | Hillary Clinton | 45% | John McCain | 47% | 4,394 RV | ±2% |
| Barack Obama | 45% | John McCain | 46% | ||||
| Rasmussen Reports/Pulse Opinion Research (Daily Tracking) [376] | March 26–29, 2008 | Hillary Clinton | 40% | John McCain | 50% | 1,600 LV | ±3% |
| Barack Obama | 44% | John McCain | 47% | ||||
| Republican National Committee/Voter/Voter/Consumer Research (R) [377] | March 25–27, 2008 | Hillary Clinton | 40% | John McCain | 51% | 800 RV | Not reported |
| Barack Obama | 42% | John McCain | 48% | ||||
| Democracy Corps/Greenberg Quinlan Rosner (D) [359] | March 25–27, 2008 | Hillary Clinton | 43% | John McCain | 52% | 500 LV | Not reported |
| Barack Obama | 49% | John McCain | 46% | ||||
| NBC News/Wall Street Journal [378] | March 24–25, 2008 | Hillary Clinton | 44% | John McCain | 46% | 800 RV | ±3.5% |
| Barack Obama | 44% | John McCain | 42% | ||||
| Rasmussen Reports/Pulse Opinion Research (Daily Tracking) [379] | March 22–25, 2008 | Hillary Clinton | 43% | John McCain | 50% | 1,600 LV | ±3% |
| Barack Obama | 41% | John McCain | 51% | ||||
| Gallup (Daily Tracking) [380] | March 21–22, 24–25, 2008 | Hillary Clinton | 45% | John McCain | 47% | 4,433 RV | ±2% |
| Barack Obama | 44% | John McCain | 46% | ||||
| The Economist/Polimetrix/YouGov [381] | March 21–24, 2008 | Hillary Clinton | 39% | John McCain | 48% | 995 A | ±4% |
| Barack Obama | 41% | John McCain | 45% | 992 A | |||
| Harris Interactive [382] | March 14–24, 2008 | Hillary Clinton | 39% | John McCain | 35% | Not reported | Not reported |
| Barack Obama | 40% | John McCain | 35% | ||||
| Pew Research Center [383] | March 19–22, 2008 | Hillary Clinton | 49% | John McCain | 44% | 1,248 RV | ±3.5% |
| Barack Obama | 49% | John McCain | 43% | ||||
| Rasmussen Reports/Pulse Opinion Research (Daily Tracking) [384] | March 18–21, 2008 | Hillary Clinton | 43% | John McCain | 49% | 1,600 LV | ±3% |
| Barack Obama | 41% | John McCain | 49% | ||||
| Gallup (Daily Tracking) [371] | March 16–20, 2008 | Hillary Clinton | 45% | John McCain | 48% | 4,377 RV | ±2% |
| Barack Obama | 44% | John McCain | 47% | ||||
| Fox News/Opinion Dynamics Corporation [385] | March 18–19, 2008 | Hillary Clinton | 46% | John McCain | 43% | 900 RV | ±3% |
| Barack Obama | 43% | John McCain | 44% | ||||
| CBS News [386] | March 15–18, 2008 | Hillary Clinton | 46% | John McCain | 44% | Not reported | Not reported |
| Barack Obama | 44% | John McCain | 46% | ||||
| Rasmussen Reports/Pulse Opinion Research (Daily Tracking) [387] | March 14–17, 2008 | Hillary Clinton | 42% | John McCain | 48% | 1,600 LV | ±3% |
| Barack Obama | 42% | John McCain | 48% | ||||
| CNN/Opinion Research Corporation [388] | March 14–16, 2008 | Hillary Clinton | 49% | John McCain | 47% | 950 RV | ±3% |
| Barack Obama | 47% | John McCain | 46% | ||||
| USA Today/Gallup [389] | March 14–16, 2008 | Hillary Clinton | 51% | John McCain | 46% | 685 LV | ±4% |
| Barack Obama | 49% | John McCain | 47% | ||||
| Reuters/Zogby International [390] | March 13–14, 2008 | Hillary Clinton | 40% | John McCain | 48% | 1,004 LV | ±3.2% |
| Barack Obama | 40% | John McCain | 46% | ||||
| Rasmussen Reports/Pulse Opinion Research (Daily Tracking) [387] | March 10–13, 2008 | Hillary Clinton | 44% | John McCain | 46% | 1,600 LV | ±3% |
| Barack Obama | 42% | John McCain | 47% | ||||
| Gallup (Daily Tracking) [391] | March 7–11, 2008 | Hillary Clinton | 47% | John McCain | 45% | 4,372 RV | ±2% |
| Barack Obama | 46% | John McCain | 44% | ||||
| NBC News/Wall Street Journal [392] | March 7–10, 2008 | Hillary Clinton | 47% | John McCain | 45% | 1,012 RV | ±3.1% |
| Barack Obama | 47% | John McCain | 44% | ||||
| Rasmussen Reports/Pulse Opinion Research (Daily Tracking) [387] | March 6–9, 2008 | Hillary Clinton | 46% | John McCain | 45% | 1,600 LV | ±3% |
| Barack Obama | 44% | John McCain | 45% | ||||
| Rasmussen Reports/Pulse Opinion Research (Daily Tracking) [393] | March 2–5, 2008 | Hillary Clinton | 45% | John McCain | 46% | 1,600 LV | ±3% |
| Barack Obama | 44% | John McCain | 46% | ||||
| SurveyUSA [394] | March 4, 2008 | Hillary Clinton | 48% | John McCain | 46% | 1,041 RV | Not reported |
| Barack Obama | 46% | John McCain | 46% | ||||
| Cook Political Report/RT Strategies [395] | February 28 – March 2, 2008 | Barack Obama | 47% | John McCain | 38% | 802 RV | ±3.5% |
| ABC News/Washington Post [396] | February 28 – March 2, 2008 | Hillary Clinton | 50% | John McCain | 47% | Not reported | Not reported |
| Barack Obama | 53% | John McCain | 42% | ||||
| Rasmussen Reports/Pulse Opinion Research (Daily Tracking) [397] | February 27–March 1, 2008 | Hillary Clinton | 44% | John McCain | 47% | 1,600 LV | ±3% |
| Barack Obama | 43% | John McCain | 48% | ||||
| Democracy Corps/Greenberg Quinlan Rosner (D) [359] | February 24–26, 2008 | Barack Obama | 48% | John McCain | 47% | 1,956 LV | Not reported |
| Rasmussen Reports/Pulse Opinion Research (Daily Tracking) [397] | February 23–26, 2008 | Hillary Clinton | 43% | John McCain | 48% | 1,600 LV | ±3% |
| Barack Obama | 43% | John McCain | 46% | ||||
| Los Angeles Times/Bloomberg [398] | February 21–25, 2008 | Hillary Clinton | 40% | John McCain | 46% | 1,246 RV | ±3% |
| Barack Obama | 42% | John McCain | 44% | ||||
| Associated Press/Ipsos [399] | February 22–24, 2008 | Hillary Clinton | 48% | John McCain | 43% | 755 RV | ±3.6% |
| Barack Obama | 51% | John McCain | 41% | ||||
| USA Today/Gallup [400] | February 21–24, 2008 | Hillary Clinton | 46% | John McCain | 50% | 1,653 LV | ±3% |
| Barack Obama | 47% | John McCain | 48% | ||||
| Pew Research Center [401] | February 20–24, 2008 | Hillary Clinton | 50% | John McCain | 45% | 1,240 RV | ±3.5% |
| Barack Obama | 50% | John McCain | 43% | ||||
| CBS News/New York Times [402] | February 20–24, 2008 | Hillary Clinton | 46% | John McCain | 46% | 1,115 RV | ±3% |
| Barack Obama | 50% | John McCain | 38% | ||||
| Rasmussen Reports/Pulse Opinion Research (Daily Tracking) [397] | February 19–22, 2008 | Hillary Clinton | 44% | John McCain | 47% | 1,600 LV | ±3% |
| Barack Obama | 43% | John McCain | 46% | ||||
| Fox News/Opinion Dynamics Corporation [403] | February 19–20, 2008 | Hillary Clinton | 44% | John McCain | 47% | 900 RV | ±3% |
| Barack Obama | 47% | John McCain | 43% | ||||
| Rasmussen Reports/Pulse Opinion Research (Daily Tracking) [397] | February 15–18, 2008 | Hillary Clinton | 43% | John McCain | 47% | 1,600 LV | ±3% |
| Barack Obama | 46% | John McCain | 43% | ||||
| Diageo/The Hotline/Financial Dynamics [404] | February 14–17, 2008 | Hillary Clinton | 40% | John McCain | 48% | 803 RV | ±3.5% |
| Barack Obama | 48% | John McCain | 40% | ||||
| Reuters/Zogby International [405] | February 13–16, 2008 | Hillary Clinton | 38% | John McCain | 50% | 1,105 LV | ±3% |
| Barack Obama | 47% | John McCain | 40% | ||||
| Rasmussen Reports/Pulse Opinion Research (Daily Tracking) [397] | February 11–14, 2008 | Hillary Clinton | 41% | John McCain | 49% | 1,600 LV | ±3% |
| Barack Obama | 46% | John McCain | 43% | ||||
| USA Today/Gallup [406] | February 8–10, 2008 | Hillary Clinton | 48% | John McCain | 49% | 706 LV | ±4% |
| Barack Obama | 50% | John McCain | 46% | ||||
| Rasmussen Reports/Pulse Opinion Research (Daily Tracking) [397] | February 7–10, 2008 | Hillary Clinton | 43% | John McCain | 46% | 1,600 LV | ±3% |
| Barack Obama | 44% | John McCain | 40% | ||||
| Associated Press/Ipsos [407] | February 7–10, 2008 | Hillary Clinton | 46% | John McCain | 45% | 790 RV | ±3.5% |
| Barack Obama | 48% | John McCain | 42% | ||||
| Rasmussen Reports/Pulse Opinion Research (Daily Tracking) [408] | February 3–6, 2008 | Hillary Clinton | 44% | John McCain | 46% | 1,600 LV | ±3% |
| Barack Obama | 46% | John McCain | 43% | ||||
| Time/Schulman, Ronca, & Bucuvalas Inc. (SRBI) [409] | February 1–4, 2008 | Hillary Clinton | 46% | John McCain | 46% | 958 LV | ±3% |
| Barack Obama | 48% | John McCain | 41% | ||||
Three-way race
| Poll source | Date administered | Democrat | % | Republican | % | Independent | % | Sample size | Margin of error |
|---|---|---|---|---|---|---|---|---|---|
| Associated Press/Yahoo News/Knowledge Networks [410] | April 2–14, 2008 | Barack Obama | 34% | John McCain | 36% | Ralph Nader | 3% | 1,576 RV | ±2.5% |
| Hillary Clinton | 36% | John McCain | 37% | Ralph Nader | 3% | ||||
| Reuters/Zogby International [390] | March 13–14, 2008 | Barack Obama | 39% | John McCain | 44% | Ralph Nader | 5% | 1,004 LV | ±3.2% |
| Hillary Clinton | 39% | John McCain | 45% | Ralph Nader | 6% |
Four-way race
| Poll source | Date administered | Democrat | % | Republican | % | Independent | % | Libertarian | % | Sample size | Margin of error |
|---|---|---|---|---|---|---|---|---|---|---|---|
| Reuters/Zogby International [321] | May 15–18, 2008 | Barack Obama | 47% | John McCain | 37% | Ralph Nader | 4% | Bob Barr | 3% | 1,076 LV | ±3.0% |
| Hillary Clinton | 41% | John McCain | 40% | Ralph Nader | 4% | Bob Barr | 3% | ||||
| Rasmussen Reports/Pulse Opinion Research [411] | May 14–15, 2008 | Barack Obama | 42% | John McCain | 38% | Ralph Nader | 4% | Bob Barr | 6% | 800 LV | ±3.5% |
| Zogby Interactive [412] | April 25–28, 2008 | Barack Obama | 45% | John McCain | 42% | Ralph Nader | 1% | Bob Barr | 3% | 7,653 LV | ±1.1% |
| Hillary Clinton | 34% | John McCain | 44% | Ralph Nader | 3% | Bob Barr | 4% | ||||
| Reuters/Zogby International [364] | April 10–12, 2008 | Barack Obama | 44% | John McCain | 42% | Ralph Nader | 3% | Bob Barr | 2% | 1,046 LV | ±3.1% |
| Hillary Clinton | 39% | John McCain | 45% | Ralph Nader | 3% | Bob Barr | 2% |
| Poll Source | Date administered | Democrat | % | Republican | % | Sample size | Margin of error |
|---|---|---|---|---|---|---|---|
| The Economist/Polimetrix/YouGov [413] | February 25–26, 2008 | Hillary Clinton | 44% | Mike Huckabee | 45% | 994 A | ±4% |
| Hillary Clinton | 40% | John McCain | 46% | 991 A | |||
| Barack Obama | 47% | Mike Huckabee | 41% | 988 A | |||
| Barack Obama | 43% | John McCain | 44% | 993 A | |||
| The Economist/Polimetrix/YouGov [414] | February 19–20, 2008 | Hillary Clinton | 46% | Mike Huckabee | 40% | 999 A | ±4% |
| Hillary Clinton | 43% | John McCain | 44% | 996 A | |||
| Barack Obama | 49% | Mike Huckabee | 45% | 997 A | |||
| Barack Obama | 45% | John McCain | 41% | 1,000 A | |||
| The Economist/Polimetrix/YouGov [415] | February 10–11, 2008 | Hillary Clinton | 48% | Mike Huckabee | 41% | 999 A | ±4% |
| Hillary Clinton | 43% | John McCain | 44% | 998 A | |||
| Barack Obama | 51% | Mike Huckabee | 37% | 998 A | |||
| Barack Obama | 49% | John McCain | 39% | 996 A | |||
| Zogby International [416] | February 8−11, 2008 | Hillary Clinton | 37% | John McCain | 42% | 7,468 LV | ±1.2% |
| Barack Obama | 47% | John McCain | 36% | ||||
| Hillary Clinton | 40% | Mike Huckabee | 37% | ||||
| Barack Obama | 49% | Mike Huckabee | 34% | ||||
| The Economist/Polimetrix/YouGov [417] | February 4–5, 2008 | Hillary Clinton | 51% | Mitt Romney | 36% | 998 A | ±4% |
| Hillary Clinton | 46% | John McCain | 39% | 994 A | |||
| Barack Obama | 49% | Mitt Romney | 35% | 997 A | |||
| Barack Obama | 44% | John McCain | 38% | 993 A | |||
| CNN/Opinion Research Corporation [418] | February 1−3, 2008 | Barack Obama | 59% | Mitt Romney | 36% | 974 RV | ±3% |
| Hillary Clinton | 56% | Mitt Romney | 41% | ||||
| Barack Obama | 52% | John McCain | 44% | ||||
| Hillary Clinton | 50% | John McCain | 47% | ||||
| Rasmussen Reports/Pulse Opinion Research (Daily Tracking) [419] | January 31 − February 3, 2008 | Hillary Clinton | 39% | John McCain | 47% | 1,600 LV | ±3% |
| Hillary Clinton | 50% | Mitt Romney | 37% | ||||
| Barack Obama | 44% | John McCain | 44% | ||||
| Barack Obama | 44% | Mitt Romney | 41% | ||||
| Cook Political Report/RT Strategies [420] | January 31 – February 2, 2008 | Hillary Clinton | 41% | John McCain | 45% | 855 RV | ±3.4% |
| Hillary Clinton | 48% | Mitt Romney | 42% | ||||
| Barack Obama | 45% | John McCain | 43% | ||||
| Barack Obama | 50% | Mitt Romney | 41% | ||||
| ABC News/Washington Post [421] | January 30 – February 1, 2008 | Hillary Clinton | 45% | John McCain | 50% | Not reported | Not reported |
| Hillary Clinton | 51% | Mitt Romney | 43% | ||||
| Barack Obama | 47% | John McCain | 48% | ||||
| Barack Obama | 57% | Mitt Romney | 36% | ||||
| Fox News/Opinion Dynamics Corporation [422] | January 30–31, 2008 | Hillary Clinton | 44% | John McCain | 45% | 900 RV | ±3% |
| Hillary Clinton | 50% | Mitt Romney | 36% | ||||
| Barack Obama | 44% | John McCain | 43% | ||||
| Barack Obama | 51% | Mitt Romney | 33% | ||||
| Democracy Corps/Greenberg Quinlan Rosner (D) [359] | January 29–31, 2008 | Hillary Clinton | 46% | John McCain | 48% | 500 LV | Not reported |
| Barack Obama | 47% | John McCain | 48% | ||||
| NPR/Public Opinion Research/Greenberg Quinlan Rosner [423] | January 29–31, 2008 | Hillary Clinton | 45% | John McCain | 48% | 1,000 LV | ±3% |
| Hillary Clinton | 49% | Mitt Romney | 44% | ||||
| Barack Obama | 47% | John McCain | 48% | ||||
| Barack Obama | 53% | Mitt Romney | 41% | ||||
| Rasmussen Reports/Pulse Opinion Research [424] | January 25–27, 2008 | Hillary Clinton | 40% | John McCain | 48% | 1,200 LV | ±3% |
| Barack Obama | 41% | John McCain | 47% | ||||
| Rasmussen Reports/Pulse Opinion Research [425] | January 21–22, 2008 | Barack Obama | 47% | Mitt Romney | 38% | 800 LV | ±4% |
| Hillary Clinton | 47% | Mitt Romney | 42% | ||||
| NBC News/Wall Street Journal [426] | January 20–22, 2008 | Barack Obama | 41% | John McCain | 43% | Not reported | Not reported |
| Barack Obama | 48% | Mitt Romney | 35% | ||||
| Barack Obama | 54% | Rudy Giuliani | 34% | ||||
| Barack Obama | 55% | Mike Huckabee | 33% | ||||
| Hillary Clinton | 43% | John McCain | 47% | ||||
| Hillary Clinton | 50% | Mike Huckabee | 41% | ||||
| Hillary Clinton | 52% | Rudy Giuliani | 37% | ||||
| Hillary Clinton | 52% | Mitt Romney | 36% | ||||
| Los Angeles Times/Bloomberg [427] | January 18–22, 2008 | Barack Obama | 47% | Mike Huckabee | 37% | 643 RV | ±4% |
| Barack Obama | 41% | John McCain | 42% | ||||
| Barack Obama | 49% | Rudy Giuliani | 32% | ||||
| Barack Obama | 46% | Mitt Romney | 35% | ||||
| Hillary Clinton | 51% | Mike Huckabee | 38% | 669 RV | |||
| Hillary Clinton | 53% | Rudy Giuliani | 37% | ||||
| Hillary Clinton | 46% | John McCain | 42% | ||||
| Hillary Clinton | 50% | Mitt Romney | 39% | ||||
| Rasmussen Reports/Pulse Opinion Research [428] | January 18–20, 2008 | Barack Obama | 51% | Mike Huckabee | 35% | 800 LV | ±3.5% |
| Hillary Clinton | 48% | Mike Huckabee | 40% | ||||
| Rasmussen Reports/Pulse Opinion Research [429] | January 16–17, 2008 | Barack Obama | 46% | John McCain | 41% | 800 LV | ±4.5% |
| Hillary Clinton | 47% | John McCain | 45% | ||||
| USA Today/Gallup [430] | January 10–13, 2008 | Barack Obama | 53% | Mike Huckabee | 43% | 1,598 LV | ±3% |
| Barack Obama | 45% | John McCain | 50% | ||||
| Hillary Clinton | 47% | John McCain | 50% | ||||
| Hillary Clinton | 51% | Mike Huckabee | 45% | ||||
| Diageo/The Hotline/Financial Dynamics [431] | January 10–12, 2008 | Barack Obama | 41% | John McCain | 39% | 803 RV | ±3.5% |
| Hillary Clinton | 43% | John McCain | 47% | ||||
| Barack Obama | 53% | Mike Huckabee | 30% | ||||
| Hillary Clinton | 48% | Mike Huckabee | 39% | ||||
| Barack Obama | 56% | Mitt Romney | 26% | ||||
| Hillary Clinton | 49% | Mitt Romney | 37% | ||||
| Barack Obama | 54% | Rudy Giuliani | 33% | ||||
| Hillary Clinton | 50% | Rudy Giuliani | 40% | ||||
| John Edwards | 48% | Rudy Giuliani | 31% | ||||
| John Edwards | 39% | John McCain | 47% | ||||
| John Edwards | 47% | Mike Huckabee | 31% | ||||
| John Edwards | 48% | Mitt Romney | 33% | ||||
| Reuters/Zogby International [432] | January 10–11, 2008 | Hillary Clinton | 47% | Mitt Romney | 37% | 1,006 LV | ±3.1% |
| Hillary Clinton | 47% | Mike Huckabee | 38% | ||||
| Hillary Clinton | 46% | Rudy Giuliani | 35% | ||||
| Barack Obama | 53% | Mitt Romney | 34% | ||||
| Barack Obama | 51% | Mike Huckabee | 36% | ||||
| Barack Obama | 51% | Rudy Giuliani | 34% | ||||
| Rasmussen Reports/Pulse Opinion Research [433] | January 9–10, 2008 | Hillary Clinton | 38% | John McCain | 49% | 800 LV | ±4.5% |
| Hillary Clinton | 42% | Mike Huckabee | 45% | ||||
| CNN/Opinion Research Corporation [434] | January 9–10, 2008 | Hillary Clinton | 50% | John McCain | 48% | 840 RV | ±3.5% |
| Hillary Clinton | 55% | Rudy Giuliani | 42% | ||||
| Hillary Clinton | 56% | Mike Huckabee | 42% | ||||
| Hillary Clinton | 58% | Mitt Romney | 40% | ||||
| Barack Obama | 49% | John McCain | 48% | ||||
| Barack Obama | 56% | Rudy Giuliani | 40% | ||||
| Barack Obama | 58% | Mike Huckabee | 39% | ||||
| Barack Obama | 59% | Mitt Romney | 37% | ||||
| Rasmussen Reports/Pulse Opinion Research | Jan 7−8, 2008 | Barack Obama | 47% | Mitt Romney | 40% | 800 LV | ±3.5% |
| Barack Obama | 48% | Rudy Giuliani | 38% | ||||
| Rasmussen Reports/Pulse Opinion Research [435] | Jan 4–6, 2008 | Barack Obama | 43% | John McCain | 46% | 800 LV | ±4.5% |
| Barack Obama | 45% | Mike Huckabee | 43% | ||||
| Rasmussen Reports/Pulse Opinion Research [436] | Jan 2–3, 2008 | Barack Obama | 45% | Mitt Romney | 39% | 800 LV | ±3.5% |
| Barack Obama | 47% | Rudy Giuliani | 37% | ||||
| Fox News/Opinion Dynamics Corporation [437] | Dec 18–19, 2007 | Barack Obama | 40% | John McCain | 44% | 900 RV | ±3% |
| Barack Obama | 44% | Mike Huckabee | 35% | ||||
| Hillary Clinton | 42% | John McCain | 47% | ||||
| Hillary Clinton | 47% | Mike Huckabee | 38% | ||||
| ABC News/Facebook [438] | Dec 16–19, 2007 | Hillary Clinton | 45% | Rudy Giuliani | 47% | 1,142 A | ±3% |
| Hillary Clinton | 50% | Mike Huckabee | 42% | ||||
| Barack Obama | 48% | Rudy Giuliani | 41% | ||||
| Barack Obama | 52% | Mike Huckabee | 35% | ||||
| Rasmussen Reports/Pulse Opinion Research [439] | Dec 17–18, 2007 | Hillary Clinton | 44% | Rudy Giuliani | 45% | 800 LV | ±4.5% |
| Hillary Clinton | 43% | Mitt Romney | 44% | ||||
| Rasmussen Reports/Pulse Opinion Research [440] | Not reported (Dec 15-16?) | Barack Obama | 43% | John McCain | 45% | Not reported | Not reported |
| Barack Obama | 47% | Fred Thompson | 40% | ||||
| NBC News/Wall Street Journal [441] | Dec 14–17, 2007 | Barack Obama | 49% | Rudy Giuliani | 40% | Not reported | Not reported |
| Hillary Clinton | 46% | Mike Huckabee | 44% | ||||
| Barack Obama | 48% | Mike Huckabee | 36% | ||||
| Hillary Clinton | 46% | Rudy Giuliani | 43% | 1,005 A | ±3.1% | ||
| Hillary Clinton | 48% | Mitt Romney | 41% | ||||
| USA Today/Gallup [442] | Dec 14–16, 2007 | Barack Obama | 51% | Rudy Giuliani | 45% | 906 RV | ±4% |
| Barack Obama | 53% | Mike Huckabee | 42% | ||||
| Barack Obama | 57% | Mitt Romney | 39% | ||||
| Hillary Clinton | 49% | Rudy Giuliani | 48% | ||||
| Hillary Clinton | 52% | Mitt Romney | 46% | ||||
| Hillary Clinton | 53% | Mike Huckabee | 44% | ||||
| Zogby International [443] | Dec 12–14, 2007 | Barack Obama | 53% | Mitt Romney | 35% | 1,000 LV | ±3.2% |
| Barack Obama | 47% | Mike Huckabee | 42% | ||||
| Barack Obama | 48% | Rudy Giuliani | 39% | ||||
| Barack Obama | 47% | John McCain | 43% | ||||
| Barack Obama | 52% | Fred Thompson | 36% | ||||
| Hillary Clinton | 46% | Mitt Romney | 44% | ||||
| Hillary Clinton | 43% | Mike Huckabee | 48% | ||||
| Hillary Clinton | 42% | Rudy Giuliani | 46% | ||||
| Hillary Clinton | 42% | John McCain | 49% | ||||
| Hillary Clinton | 48% | Fred Thompson | 42% | ||||
| John Edwards | 50% | Mitt Romney | 38% | ||||
| John Edwards | 47% | Mike Huckabee | 41% | ||||
| John Edwards | 44% | Rudy Giuliani | 45% | ||||
| John Edwards | 42% | John McCain | 46% | ||||
| John Edwards | 51% | Fred Thomson | 35% | ||||
| Rasmussen Reports/Pulse Opinion Research [444] | Dec 12–13, 2007 | John Edwards | 46% | John McCain | 39% | 800 LV | ±3.5% |
| John Edwards | 49% | Mike Huckabee | 37% | ||||
| George Washington University/Tarrance Group/Lake Research Group [445] | Dec 9–12, 2007 | Hillary Clinton | 50% | Rudy Giuliani | 44% | 1,000 LV | ±3.1% |
| Hillary Clinton | 50% | Mitt Romney | 44% | ||||
| Barack Obama | 46% | Rudy Giuliani | 43% | ||||
| Barack Obama | 48% | Mitt Romney | 42% | ||||
| Rasmussen Reports/Pulse Opinion Research [446] | Dec 10–11, 2007 | Barack Obama | 43% | Rudy Giuliani | 43% | 800 LV | ±3.5% |
| Barack Obama | 45% | Mitt Romney | 41% | ||||
| Rasmussen Reports/Pulse Opinion Research [447] | Dec 7–9, 2007 | Barack Obama | 50% | Ron Paul | 31% | 1,200 LV | ±3% |
| Hillary Clinton | 49% | Ron Paul | 37% | ||||
| CNN/Opinion Research Corporation [448] | Dec 6–9, 2007 | John Edwards | 52% | John McCain | 44% | 912 RV | ±3% |
| John Edwards | 53% | Rudy Giuliani | 44% | ||||
| John Edwards | 59% | Mitt Romney | 37% | ||||
| John Edwards | 60% | Mike Huckabee | 35% | ||||
| Barack Obama | 48% | John McCain | 48% | ||||
| Barack Obama | 52% | Rudy Giualiani | 45% | ||||
| Barack Obama | 54% | Mitt Romney | 41% | ||||
| Barack Obama | 55% | Mike Huckabee | 40% | ||||
| Hillary Clinton | 48% | John McCain | 50% | ||||
| Hillary Clinton | 51% | Rudy Giuliani | 45% | ||||
| Hillary Clinton | 54% | Mike Huckabee | 44% | ||||
| Hillary Clinton | 54% | Mitt Romney | 43% | ||||
| Rasmussen Reports/Pulse Opinion Research [449] | Dec 5–6, 2007 | John Edwards | 44% | Rudy Giuliani | 44% | 800 LV | ±4.5% |
| John Edwards | 44% | Mike Huckabee | 40% | ||||
| Rasmussen Reports/Pulse Opinion Research [450] | Dec 3–4, 2007 | Hillary Clinton | 46% | Rudy Giuliani | 43% | 800 LV | ±4.5% |
| Hillary Clinton | 46% | Mitt Romney | 43% | ||||
| Los Angeles Times/Bloomberg [451] | Nov 30 – Dec 3, 2007 | Barack Obama | 44% | Rudy Giuliani | 39% | 1,245 RV | ±3% |
| Barack Obama | 45% | Mitt Romney | 33% | ||||
| Hillary Clinton | 46% | Rudy Giuliani | 42% | ||||
| Hillary Clinton | 47% | Mitt Romney | 39% | ||||
| Rasmussen Reports/Pulse Opinion Research [452] | Nov 30 – Dec 2, 2007 | Barack Obama | 45% | Mike Huckabee | 41% | 1,200 LV | ±3% |
| Hillary Clinton | 46% | Mike Huckabee | 45% | ||||
| Rasmussen Reports/Pulse Opinion Research [453] | Nov 28–29, 2007 | Barack Obama | 44% | John McCain | 44% | 800 LV | ±3.5% |
| Barack Obama | 48% | Mitt Romney | 39% | ||||
| Rasmussen Reports/Pulse Opinion Research [454] | Nov 26–27, 2007 | Barack Obama | 43% | Rudy Giuliani | 41% | 800 LV | ±3.5% |
| Barack Obama | 48% | Fred Thompson | 41% | ||||
| Zogby Interactive [455] | Nov 21–26, 2007 | Barack Obama | 46% | Rudy Giuliani | 41% | 9,150 LV | ±1% |
| Barack Obama | 46% | Mike Huckabee | 40% | ||||
| Barack Obama | 46% | Mitt Romney | 40% | ||||
| Barack Obama | 47% | Fred Thompson | 40% | ||||
| Barack Obama | 45% | John McCain | 38% | ||||
| John Edwards | 42% | John McCain | 42% | ||||
| John Edwards | 43% | Rudy Giuliani | 42% | ||||
| John Edwards | 43% | Mike Huckabee | 42% | ||||
| John Edwards | 44% | Mitt Romney | 42% | ||||
| John Edwards | 45% | Fred Thompson | 42% | ||||
| Hillary Clinton | 39% | Mike Huckabee | 44% | ||||
| Hillary Clinton | 40% | Fred Thompson | 44% | ||||
| Hillary Clinton | 38% | John McCain | 42% | ||||
| Hillary Clinton | 40% | Rudy Giuliani | 43% | ||||
| Hillary Clinton | 40% | Mitt Romney | 43% | ||||
| Rasmussen Reports/Pulse Opinion Research [456] | Nov 19–20, 2007 | Hillary Clinton | 42% | Rudy Giuliani | 46% | 800 LV | ±3.5% |
| Hillary Clinton | 46% | Fred Thompson | 44% | ||||
| Rasmussen Reports/Pulse Opinion Research [453] | Nov 17–18, 2007 | Barack Obama | 46% | John McCain | 43% | 800 LV | ±3.5% |
| Barack Obama | 46% | Mitt Romney | 40% | ||||
| Fox News/Opinion Dynamics Corporation [457] | Nov 13–14, 2007 | Hillary Clinton | 46% | John McCain | 45% | 900 RV | ±3% |
| Hillary Clinton | 47% | Rudy Giuliani | 43% | ||||
| Hillary Clinton | 49% | Fred Thompson | 40% | ||||
| Hillary Clinton | 50% | Mitt Romney | 37% | ||||
| USA Today/Gallup [458] | Nov 11–14, 2007 | Hillary Clinton | 49% | Rudy Giuliani | 44% | 897 RV | ±4% |
| Hillary Clinton | 50% | John McCain | 44% | ||||
| Hillary Clinton | 54% | Mitt Romney | 38% | ||||
| Hillary Clinton | 53% | Fred Thompson | 40% | ||||
| Barack Obama | 45% | Rudy Giuliani | 45% | ||||
| Barack Obama | 47% | John McCain | 44% | ||||
| Barack Obama | 52% | Mitt Romney | 35% | ||||
| Barack Obama | 51% | Fred Thompson | 38% | ||||
| Rasmussen Reports/Pulse Opinion Research [454] | Nov 12–13, 2007 | Barack Obama | 43% | Rudy Giuliani | 41% | 800 LV | ±3.5% |
| Barack Obama | 47% | Fred Thompson | 42% | ||||
| Rasmussen Reports/Pulse Opinion Research [459] | Nov 7–8, 2007 | Hillary Clinton | 45% | John McCain | 47% | 800 LV | ±3.5% |
| Hillary Clinton | 47% | Mitt Romney | 42% | ||||
| Rasmussen Reports/Pulse Opinion Research [460] | Nov 5–6, 2007 | Hillary Clinton | 48% | Rudy Giuliani | 42% | 800 LV | ±3.5% |
| Hillary Clinton | 48% | Fred Thompson | 42% | ||||
| NBC News/Wall Street Journal [461] | Nov 1–5, 2007 | Hillary Clinton | 46% | Rudy Giuliani | 45% | 1,509 A | ±2.5% |
| Hillary Clinton | 50% | Mitt Romney | 39% | ||||
| Barack Obama | 44% | Rudy Giuliani | 42% | ||||
| Hillary Clinton | 51% | Fred Thompson | 37% | Not reported | Not reported | ||
| Hillary Clinton | 47% | John McCain | 43% | ||||
| Barack Obama | 48% | Mitt Romney | 34% | ||||
| John Edwards | 45% | Rudy Giuliani | 44% | ||||
| Al Gore | 46% | Rudy Giuliani | 47% | ||||
| Rasmussen Reports/Pulse Opinion Research [462] | Nov 2–4, 2007 | Barack Obama | 49% | Mike Huckabee | 38% | 1,200 LV | ±3% |
| Hillary Clinton | 46% | Mike Huckabee | 43% | ||||
| USA Today/Gallup [463] | Nov 2–4, 2007 | Hillary Clinton | 51% | Rudy Giuliani | 45% | 1,024 A | ±3% |
| CNN/Opinion Research Corporation [464] | Nov 2–4, 2007 | Hillary Clinton | 51% | Rudy Giuliani | 45% | 929 RV | ±3% |
| Newsweek/Princeton Survey Research Associates International [465] | Oct 31 – Nov 1, 2007 | Hillary Clinton | 49% | Rudy Giuliani | 45% | 1,002 RV | ±4% |
| Hillary Clinton | 49% | Fred Thompson | 45% | ||||
| Hillary Clinton | 49% | Mitt Romney | 45% | ||||
| John Edwards | 48% | Rudy Giuliani | 45% | ||||
| John Edwards | 53% | Fred Thompson | 39% | ||||
| John Edwards | 53% | Mitt Romney | 37% | ||||
| Barack Obama | 48% | Rudy Giuliani | 45% | ||||
| Barack Obama | 52% | Fred Thompson | 39% | ||||
| Barack Obama | 53% | Mitt Romney | 37% | ||||
| Rasmussen Reports/Pulse Opinion Research [466] | Oct 31 – Nov 1, 2007 | John Edwards | 47% | John McCain | 38% | 800 LV | ±3.5% |
| John Edwards | 50% | Mitt Romney | 34% | ||||
| WNBC/Marist College [467] | Oct 29 – Nov 1, 2007 | Hillary Clinton | 50% | Rudy Giuliani | 40% | 811 RV | ±3.5% |
| ABC News/Washington Post [468] | Oct 29 – Nov 1, 2007 | Hillary Clinton | 50% | Rudy Giuliani | 46% | 1,131 A | ±3% |
| Hillary Clinton | 52% | John McCain | 43% | ||||
| Hillary Clinton | 56% | Fred Thompson | 40% | ||||
| Hillary Clinton | 57% | Mitt Romney | 39% | ||||
| Rasmussen Reports/Pulse Opinion Research [469] | Oct 29–30, 2007 | Barack Obama | 43% | Rudy Giuliani | 45% | 800 LV | ±3.5% |
| Barack Obama | 44% | Fred Thompson | 43% | ||||
| Quinnipiac University [470] | Oct 23–29, 2007 | Barack Obama | 43% | John McCain | 43% | 1,636 RV | ±2.4% |
| Barack Obama | 43% | Rudy Giuliani | 42% | ||||
| Barack Obama | 45% | Fred Thompson | 37% | ||||
| Barack Obama | 46% | Mitt Romney | 36% | ||||
| Hillary Clinton | 43% | Rudy Giuliani | 45% | ||||
| Hillary Clinton | 44% | John McCain | 44% | ||||
| Hillary Clinton | 46% | Fred Thompson | 41% | ||||
| Hillary Clinton | 48% | Mitt Romney | 38% | ||||
| John Edwards | 41% | Rudy Giuliani | 44% | ||||
| John Edwards | 42% | John McCain | 42% | ||||
| John Edwards | 46% | Fred Thompson | 36% | ||||
| John Edwards | 47% | Mitt Romney | 34% | ||||
| Rasmussen Reports/Pulse Opinion Research [471] | Oct 26–28, 2007 | Stephen Colbert | 36% | Ron Paul | 32% | 1,200 LV | ±3% |
| Dennis Kucinich | 32% | Stephen Colbert | 37% | ||||
| Rasmussen Reports/Pulse Opinion Research [472] | Oct 24–25, 2007 | John Edwards | 44% | Rudy Giuliani | 45% | 800 LV | ±3.5% |
| John Edwards | 48% | Fred Thompson | 39% | ||||
| Rasmussen Reports/Pulse Opinion Research [473] | Oct 22–23, 2007 | Hillary Clinton | 44% | Rudy Giuliani | 46% | 800 LV | ±3.5% |
| Hillary Clinton | 47% | Fred Thompson | 45% | ||||
| Democracy Corps/Greenberg Quinlan Rosner (D) [474] | Oct 21–23, 2007 | Hillary Clinton | 49% | Rudy Giuliani | 45% | 994 LV | Not reported |
| Hillary Clinton | 51% | Fred Thompson | 44% | ||||
| Pew Research Center [475] | Oct 17–23, 2007 | Hillary Clinton | 51% | Rudy Giuliani | 43% | 1607 RV | Not reported |
| Los Angeles Times/Bloomberg [476] | Oct 19–22, 2007 | Hillary Clinton | 47% | Rudy Giuliani | 41% | 512 RV | ±4% |
| Hillary Clinton | 48% | John McCain | 38% | ||||
| Hillary Clinton | 49% | Fred Thompson | 38% | ||||
| Hillary Clinton | 49% | Mitt Romney | 34% | ||||
| Barack Obama | 43% | Rudy Giuliani | 40% | 522 RV | |||
| Barack Obama | 44% | John McCain | 36% | ||||
| Barack Obama | 42% | Mitt Romney | 32% | ||||
| Barack Obama | 46% | Fred Thompson | 31% | ||||
| Cook Political Report/RT Strategies [477] | Oct 18–21, 2007 | Hillary Clinton | 43% | Rudy Giuliani | 39% | 855 RV | ±3.4% |
| Hillary Clinton | 46% | Mitt Romney | 37% | ||||
| Rasmussen Reports/Pulse Opinion Research [478] | Oct 15–16, 2007 | Barack Obama | 44% | John McCain | 45% | 800 LV | ±3.5% |
| Barack Obama | 48% | Mitt Romney | 39% | ||||
| Rasmussen Reports/Pulse Opinion Research [479] | Oct 15–16, 2007 | Barack Obama | 46% | Rudy Giuliani | 41% | 800 LV | ±3.5% |
| Barack Obama | 47% | Fred Thompson | 41% | ||||
| Rasmussen Reports/Pulse Opinion Research [480] | Oct 12–14, 2007 | Barack Obama | 50% | Ron Paul | 33% | 1,200 LV | ±3% |
| Hillary Clinton | 48% | Ron Paul | 38% | ||||
| CNN/Opinion Research Corporation [481] | Oct 12–14, 2007 | Hillary Clinton | 49% | Rudy Giuliani | 47% | 927 RV | ±3% |
| Rasmussen Reports/Pulse Opinion Research [482] | Oct 10–11, 2007 | Hillary Clinton | 44% | John McCain | 43% | 800 LV | ±3.5% |
| Hillary Clinton | 47% | Mitt Romney | 41% | ||||
| Fox News/Opinion Dynamics Corporation [483] | Oct 9–10, 2007 | Hillary Clinton | 47% | John McCain | 44% | 900 RV | ±3% |
| Hillary Clinton | 47% | Rudy Giuliani | 43% | ||||
| Hillary Clinton | 50% | Fred Thompson | 38% | ||||
| Hillary Clinton | 50% | Mitt Romney | 38% | ||||
| Rasmussen Reports/Pulse Opinion Research [484] | Oct 8–9, 2007 | Hillary Clinton | 48% | Rudy Giuliani | 41% | 800 LV | ±3.5% |
| Hillary Clinton | 52% | Fred Thompson | 37% | ||||
| NPR/Public Opinion Research/Greenberg Quinlan Rosner [485] | Oct 4–7, 2007 | Hillary Clinton | 47% | Rudy Giuliani | 44% | 800 LV | ±3.46% |
| Barack Obama | 44% | Rudy Giuliani | 44% | ||||
| Barack Obama | 48% | Fred Thompson | 39% | ||||
| Hillary Clinton | 50% | Fred Thompson | 42% | ||||
| Rasmussen Reports/Pulse Opinion Research [486] | Oct 3–4, 2007 | John Edwards | 47% | John McCain | 40% | 800 LV | ±3.5% |
| John Edwards | 52% | Mitt Romney | 35% | ||||
| Rasmussen Reports/Pulse Opinion Research [487] | Oct 1–2, 2007 | Barack Obama | 47% | Rudy Giuliani | 42% | 800 LV | ±3.5% |
| Barack Obama | 49% | Fred Thompson | 38% | ||||
| Rasmussen Reports/Pulse Opinion Research [488] | Sep 28–30, 2007 | Barack Obama | 47% | Mike Huckabee | 38% | 1,200 LV | ±3% |
| Hillary Clinton | 48% | Mike Huckabee | 40% | ||||
| ABC News/Washington Post [489] | Sep 27–30, 2007 | Hillary Clinton | 51% | Rudy Giuliani | 43% | 1,114 A | ±3% |
| Rasmussen Reports/Pulse Opinion Research [490] | Sep 26–27, 2007 | John Edwards | 50% | Rudy Giuliani | 41% | 800 LV | ±3.5% |
| John Edwards | 49% | Fred Thompson | 39% | ||||
| Fox News/Opinion Dynamics Corporation [491] | Sep 25–26, 2007 | Hillary Clinton | 46% | Rudy Giuliani | 39% | 900 RV | ±3% |
| Hillary Clinton | 46% | John McCain | 39% | ||||
| Hillary Clinton | 48% | Fred Thompson | 35% | ||||
| Barack Obama | 41% | Rudy Giuliani | 40% | ||||
| Barack Obama | 40% | John McCain | 38% | ||||
| Barack Obama | 45% | Fred Thompson | 33% | ||||
| Rasmussen Reports/Pulse Opinion Research [492] | Sep 24–25, 2007 | Hillary Clinton | 48% | Rudy Giuliani | 43% | 800 LV | ±3.5% |
| Hillary Clinton | 49% | Fred Thompson | 41% | ||||
| Rasmussen Reports/Pulse Opinion Research [493] | Sep 21–23, 2007 | Bill Richardson | 40% | Rudy Giuliani | 43% | 1,200 LV | ±2.9% |
| Bill Richardson | 41% | Fred Thompson | 42% | ||||
| Rasmussen Reports/Pulse Opinion Research [494] | Sep 19–20, 2007 | Barack Obama | 46% | Mitt Romney | 43% | 800 LV | ±3.5% |
| Barack Obama | 46% | John McCain | 41% | ||||
| Rasmussen Reports/Pulse Opinion Research [487] | Sep 17–18, 2007 | Barack Obama | 47% | Rudy Giuliani | 42% | 800 LV | ±3.5% |
| Barack Obama | 47% | Fred Thompson | 41% | ||||
| The Cook Political Report/RT Strategies [495] | Sep 13–16, 2007 | Hillary Clinton | 45% | Rudy Giuliani | 43% | 855 RV | ±3.4% |
| Rasmussen Reports/Pulse Opinion Research [496] | Sep 12–13, 2007 | Hillary Clinton | 46% | John McCain | 45% | 800 LV | ±3.5% |
| Hillary Clinton | 49% | Mitt Romney | 40% | ||||
| Rasmussen Reports/Pulse Opinion Research [497] | Sep 10–11, 2007 | Hillary Clinton | 46% | Rudy Giuliani | 45% | 800 LV | ±3.5% |
| Hillary Clinton | 48% | Fred Thompson | 43% | ||||
| NBC News/Wall Street Journal [498] | Sep 7–10, 2007 | Hillary Clinton | 49% | Rudy Giuliani | 42% | 1,002 A | ±3.1% |
| Hillary Clinton | 50% | Fred Thompson | 41% | ||||
| Hillary Clinton | 51% | Mitt Romney | 38% | ||||
| Hillary Clinton | 50% | Mike Huckabee | 36% | ||||
| Barack Obama | 47% | Fred Thompson | 38% | ||||
| Barack Obama | 51% | Mitt Romney | 34% | ||||
| CNN/Opinion Research Corporation [499] | Sep 7–9, 2007 | Hillary Clinton | 50% | Rudy Giuliani | 46% | 914 RV | ±3% |
| Hillary Clinton | 55% | Fred Thompson | 42% | ||||
| Barack Obama | 45% | Rudy Giuliani | 49% | ||||
| Barack Obama | 53% | Fred Thompson | 41% | ||||
| Rasmussen Reports/Pulse Opinion Research [500] | Sep 4, 2007 | Barack Obama | 44% | Rudy Giuliani | 45% | 800 LV | ±3.5% |
| Barack Obama | 46% | Fred Thompson | 42% | ||||
| Rasmussen Reports/Pulse Opinion Research [501] | Aug 29–30, 2007 | John Edwards | 45% | John McCain | 41% | 800 LV | ±3.5% |
| John Edwards | 49% | Mitt Romney | 38% | ||||
| Rasmussen Reports/Pulse Opinion Research [502] | Aug 27–28, 2007 | Hillary Clinton | 44% | Rudy Giuliani | 47% | 800 LV | ±3.5% |
| Hillary Clinton | 48% | Fred Thompson | 44% | ||||
| Rasmussen Reports/Pulse Opinion Research [503] | Aug 24–26, 2007 | Barack Obama | 48% | Tom Tancredo | 31% | 1,200 LV | ±3% |
| Hillary Clinton | 50% | Tom Tancredo | 37% | ||||
| Rasmussen Reports/Pulse Opinion Research [504] | Aug 22–23, 2007 | John Edwards | 49% | Rudy Giuliani | 41% | 800 LV | ±4% |
| John Edwards | 49% | Fred Thompson | 35% | ||||
| Rasmussen Reports/Pulse Opinion Research [505] | Aug 20–21, 2007 | Barack Obama | 45% | Rudy Giuliani | 43% | 800 LV | ±3.5% |
| Barack Obama | 45% | Fred Thompson | 41% | ||||
| Rasmussen Reports/Pulse Opinion Research [506] | Aug 17–19, 2007 | Barack Obama | 48% | Mike Huckabee | 39% | 1,200 LV | ±2.9% |
| Hillary Clinton | 49% | Mike Huckabee | 41% | ||||
| Rasmussen Reports/Pulse Opinion Research [507] | Aug 15–16, 2007 | Hillary Clinton | 46% | John McCain | 44% | 800 LV | ±3.5% |
| Hillary Clinton | 51% | Mitt Romney | 40% | ||||
| Rasmussen Reports/Pulse Opinion Research [508] | Aug 13–14, 2007 | Hillary Clinton | 40% | Rudy Giuliani | 47% | 800 LV | ±3.5% |
| Hillary Clinton | 46% | Fred Thompson | 43% | ||||
| Quinnipiac University [509] | Aug 7–13, 2007 | Hillary Clinton | 46% | Rudy Giuliani | 43% | 1,545 RV | ±2.5% |
| Hillary Clinton | 47% | John McCain | 41% | ||||
| Hillary Clinton | 49% | Fred Thompson | 38% | ||||
| John Edwards | 43% | Rudy Giuliani | 42% | ||||
| John Edwards | 45% | John McCain | 37% | ||||
| John Edwards | 49% | Fred Thompson | 32% | ||||
| Barack Obama | 42% | Rudy Giuliani | 42% | ||||
| Barack Obama | 43% | John McCain | 39% | ||||
| Barack Obama | 46% | Fred Thompson | 35% | ||||
| Rasmussen Reports/Pulse Opinion Research [510] | Aug 10–12, 2007 | Joe Biden | 34% | Rudy Giuliani | 50% | 1,200 LV | ±2.8% |
| Joe Biden | 39% | Fred Thompson | 39% | ||||
| Rasmussen Reports/Pulse Opinion Research [511] | Aug 8–9, 2007 | John Edwards | 46% | Rudy Giuliani | 44% | 800 LV | ±3.5% |
| John Edwards | 47% | Fred Thompson | 41% | ||||
| Rasmussen Reports/Pulse Opinion Research [512] | Aug 6–7, 2007 | Barack Obama | 44% | Rudy Giuliani | 43% | 800 LV | ±3.5% |
| Barack Obama | 46% | Fred Thompson | 39% | ||||
| Rasmussen Reports/Pulse Opinion Research [513] | Aug 3–5, 2007 | Bill Richardson | 39% | Rudy Giuliani | 47% | 1,200 LV | ±2.9% |
| Bill Richardson | 40% | Fred Thompson | 41% | ||||
| Rasmussen Reports/Pulse Opinion Research [514] | Aug 1–2, 2007 | Barack Obama | 46% | John McCain | 40% | 800 LV | ±4% |
| Hillary Clinton | 45% | John McCain | 43% | ||||
| Rasmussen Reports/Pulse Opinion Research [515] | Jul 30–31, 2007 | Hillary Clinton | 45% | Rudy Giuliani | 46% | 839 LV | ±3.5% |
| Hillary Clinton | 45% | Fred Thompson | 46% | ||||
| NBC News/Wall Street Journal [516] | Jul 27–30, 2007 | Hillary Clinton | 47% | Rudy Giuliani | 41% | 1,005 A | ±3.1% |
| Barack Obama | 45% | Rudy Giuliani | 40% | ||||
| Rasmussen Reports/Pulse Opinion Research [517] | Jul 27–29, 2007 | Dennis Kucinich | 34% | Rudy Giuliani | 48% | 1,200 LV | ±2.9% |
| Dennis Kucinich | 34% | Fred Thompson | 43% | ||||
| Rasmussen Reports/Pulse Opinion Research [518] | Jul 25–26, 2007 | John Edwards | 49% | Rudy Giuliani | 42% | 643 LV | ±4% |
| John Edwards | 50% | Fred Thompson | 39% | ||||
| Rasmussen Reports/Pulse Opinion Research [519] | Jul 23–24, 2007 | Barack Obama | 47% | Rudy Giuliani | 41% | 1,472 LV | ±2.6% |
| Barack Obama | 46% | Fred Thompson | 40% | ||||
| Rasmussen Reports/Pulse Opinion Research [520] | Jul 20–22, 2007 | Barack Obama | 50% | Ron Paul | 30% | 1,461 LV | ±2.6% |
| Hillary Clinton | 49% | Ron Paul | 34% | ||||
| Rasmussen Reports/Pulse Opinion Research [521] | Jul 18–19, 2007 | John Edwards | 45% | Mitt Romney | 38% | 800 LV | ±4% |
| John Edwards | 52% | John McCain | 36% | ||||
| Fox News/Opinion Dynamics Corporation [522] | Jul 17–18, 2007 | Hillary Clinton | 45% | John McCain | 42% | 900 RV | ±3% |
| Hillary Clinton | 46% | Rudy Giuliani | 41% | ||||
| Hillary Clinton | 47% | Fred Thompson | 38% | ||||
| Hillary Clinton | 50% | Mitt Romney | 35% | ||||
| Barack Obama | 45% | Rudy Giuliani | 41% | ||||
| Barack Obama | 47% | John McCain | 37% | ||||
| Barack Obama | 48% | Fred Thompson | 32% | ||||
| George Washington University/Tarrance Group/Lake Research Group [523] | Jul 15–18, 2007 | Barack Obama | 52% | Rudy Giuliani | 43% | 1,000 LV | ±3.1% |
| Barack Obama | 56% | Fred Thompson | 36% | ||||
| Hillary Clinton | 44% | Rudy Giuliani | 50% | ||||
| Hillary Clinton | 47% | Fred Thompson | 45% | ||||
| Rasmussen Reports/Pulse Opinion Research [524] | Jul 16–17, 2007 | Barack Obama | 47% | Mitt Romney | 38% | 1,029 LV | ±3% |
| Barack Obama | 47% | John McCain | 38% | ||||
| Rasmussen Reports/Pulse Opinion Research [525] | Jul 13–15, 2007 | Joe Biden | 37% | Rudy Giuliani | 46% | 1,200 LV | ±3% |
| Joe Biden | 38% | Fred Thompson | 40% | ||||
| USA Today/Gallup [526] | Jul 12–15, 2007 | Hillary Clinton | 46% | Rudy Giuliani | 49% | 908 RV | ±4% |
| Hillary Clinton | 48% | Fred Thompson | 45% | ||||
| Barack Obama | 45% | Rudy Giuliani | 49% | ||||
| Barack Obama | 51% | Fred Thompson | 40% | ||||
| Zogby America Poll [527] | Jul 12–14, 2007 | Hillary Clinton | 45% | John McCain | 43% | 1,012 LV | ±3.1% |
| Hillary Clinton | 47% | Rudy Giuliani | 41% | ||||
| Hillary Clinton | 48% | Fred Thompson | 41% | ||||
| Hillary Clinton | 48% | Mitt Romney | 38% | ||||
| Barack Obama | 45% | John McCain | 42% | ||||
| Barack Obama | 46% | Rudy Giuliani | 42% | ||||
| Barack Obama | 48% | Fred Thompson | 40% | ||||
| Barack Obama | 49% | Mitt Romney | 35% | ||||
| John Edwards | 43% | Rudy Giuliani | 46% | ||||
| John Edwards | 43% | John McCain | 43% | ||||
| John Edwards | 46% | Fred Thompson | 40% | ||||
| John Edwards | 47% | Mitt Romney | 38% | ||||
| Rasmussen Reports/Pulse Opinion Research [528] | Jul 9–10, 2007 | Hillary Clinton | 44% | Rudy Giuliani | 43% | 800 LV | ±4% |
| Hillary Clinton | 47% | John McCain | 38% | ||||
| Rasmussen Reports/Pulse Opinion Research [529] | Jun 27–28, 2007 | Hillary Clinton | 45% | Fred Thompson | 45% | 800 LV | ±4% |
| Hillary Clinton | 46% | Mitt Romney | 42% | ||||
| Rasmussen Reports/Pulse Opinion Research [530] | Jun 25–26, 2007 | John Edwards | 45% | Rudy Giuliani | 45% | 800 LV | ±4% |
| John Edwards | 50% | Fred Thompson | 41% | ||||
| Rasmussen Reports/Pulse Opinion Research [531] | Jun 22–24, 2007 | Barack Obama | 41% | Rudy Giuliani | 44% | 1,200 LV | ±3% |
| Barack Obama | 43% | Fred Thompson | 41% | ||||
| CNN/Opinion Research Corporation [532] | Jun 22–24, 2007 | Hillary Clinton | 49% | Rudy Giuliani | 48% | 907 RV | ±3.5% |
| Hillary Clinton | 50% | Fred Thompson | 46% | ||||
| Hillary Clinton | 49% | John McCain | 47% | ||||
| Barack Obama | 46% | Rudy Giuliani | 48% | ||||
| Barack Obama | 52% | Fred Thompson | 40% | ||||
| Barack Obama | 48% | John McCain | 44% | ||||
| Cook Political Report/RT Strategies [533] | Jun 21–23, 2007 | Hillary Clinton | 45% | Rudy Giuliani | 44% | 844 RV | ±3.4% |
| Hillary Clinton | 45% | Fred Thompson | 40% | ||||
| Hillary Clinton | 48% | Mitt Romney | 38% | ||||
| Barack Obama | 42% | Rudy Giuliani | 41% | ||||
| Barack Obama | 46% | Fred Thompson | 35% | ||||
| Barack Obama | 47% | Mitt Romney | 34% | ||||
| Newsweek/Princeton Survey Research Associates International [534] | Jun 20–21, 2007 | Hillary Clinton | 51% | Rudy Giuliani | 44% | 831 RV | ±4% |
| Hillary Clinton | 53% | Fred Thompson | 42% | ||||
| Hillary Clinton | 50% | John McCain | 45% | ||||
| Hillary Clinton | 55% | Mitt Romney | 40% | ||||
| Barack Obama | 49% | Rudy Giuliani | 44% | ||||
| Barack Obama | 53% | Fred Thompson | 39% | ||||
| Barack Obama | 51% | John McCain | 41% | ||||
| Barack Obama | 53% | Mitt Romney | 37% | ||||
| John Edwards | 48% | Rudy Giuliani | 46% | ||||
| John Edwards | 54% | Fred Thompson | 38% | ||||
| John Edwards | 50% | John McCain | 44% | ||||
| John Edwards | 57% | Mitt Romney | 36% | ||||
| Rasmussen Reports/Pulse Opinion Research [535] | Jun 20–21, 2007 | Hillary Clinton | 45% | Rudy Giuliani | 46% | 792 LV | ±4% |
| Hillary Clinton | 46% | John McCain | 42% | ||||
| Rasmussen Reports/Pulse Opinion Research [536] | Jun 18–19, 2007 | Bill Richardson | 38% | Rudy Giuliani | 44% | 800 LV | ±4% |
| Bill Richardson | 35% | Fred Thompson | 43% | ||||
| Rasmussen Reports/Pulse Opinion Research [537] | Jun 15–17, 2007 | John Edwards | 49% | John McCain | 36% | 800 LV | ±4% |
| John Edwards | 51% | Mitt Romney | 33% | ||||
| Cook Political Report/RT Strategies [538] | Jun 15–17, 2007 | Hillary Clinton | 42% | Rudy Giuliani | 42% | 855 RV | ±3.4% |
| Hillary Clinton | 42% | Fred Thompson | 42% | ||||
| Hillary Clinton | 45% | Mitt Romney | 38% | ||||
| Barack Obama | 42% | Rudy Giuliani | 42% | ||||
| Barack Obama | 46% | Fred Thompson | 33% | ||||
| Barack Obama | 47% | Mitt Romney | 31% | ||||
| Rasmussen Reports/Pulse Opinion Research [539] | Jun 13–14, 2007 | Barack Obama | 46% | John McCain | 38% | 800 LV | ±4% |
| USA Today/Gallup [540] | Jun 11–14, 2007 | Hillary Clinton | 50% | Rudy Giuliani | 46% | 927 RV | ±4% |
| Hillary Clinton | 49% | John McCain | 46% | ||||
| Hillary Clinton | 53% | Mitt Romney | 40% | ||||
| Barack Obama | 50% | Rudy Giuliani | 45% | ||||
| Barack Obama | 48% | John McCain | 46% | ||||
| Barack Obama | 57% | Mitt Romney | 36% | ||||
| John Edwards | 50% | Rudy Giuliani | 45% | ||||
| John Edwards | 50% | John McCain | 44% | ||||
| John Edwards | 61% | Mitt Romney | 32% | ||||
| Rasmussen Reports/Pulse Opinion Research [541] | Jun 11–12, 2007 | Hillary Clinton | 48% | Fred Thompson | 43% | 800 LV | ±4% |
| Hillary Clinton | 50% | Mitt Romney | 41% | ||||
| NBC News/Wall Street Journal [542] | Jun 8–11, 2007 | Hillary Clinton | 48% | Rudy Giuliani | 43% | 1,008 A | ±3.1% |
| Barack Obama | 50% | Fred Thompson | 31% | ||||
| Quinnipiac University [543] | Jun 5–11, 2007 | Hillary Clinton | 45% | Rudy Giuliani | 44% | 1,711 RV | ±2.4% |
| Hillary Clinton | 44% | John McCain | 42% | ||||
| Hillary Clinton | 46% | Fred Thompson | 39% | ||||
| Barack Obama | 42% | Rudy Giuliani | 42% | ||||
| Barack Obama | 43% | John McCain | 41% | ||||
| Barack Obama | 46% | Fred Thompson | 34% | ||||
| Al Gore | 45% | Rudy Giuliani | 43% | ||||
| Al Gore | 44% | John McCain | 41% | ||||
| Al Gore | 49% | Fred Thompson | 37% | ||||
| Los Angeles Times/Bloomberg [544] | Jun 7–10, 2007 | Hillary Clinton | 41% | John McCain | 45% | 513 RV | ±4% |
| Hillary Clinton | 39% | Rudy Giuliani | 49% | ||||
| Hillary Clinton | 41% | Mitt Romney | 43% | ||||
| John Edwards | 40% | John McCain | 45% | ||||
| John Edwards | 46% | Mitt Romney | 32% | ||||
| Barack Obama | 46% | Rudy Giuliani | 41% | 543 RV | |||
| Barack Obama | 47% | John McCain | 35% | ||||
| Barack Obama | 50% | Mitt Romney | 34% | ||||
| John Edwards | 46% | Rudy Giuliani | 43% | ||||
| Rasmussen Reports/Pulse Opinion Research [545] | Jun 6–7, 2007 | John Edwards | 47% | Rudy Giuliani | 43% | 800 LV | ±4% |
| John Edwards | 51% | Fred Thompson | 38% | ||||
| FOX News/Opinion Dynamics Poll [546] | Jun 5–6, 2007 | Hillary Clinton | 42% | Rudy Giuliani | 45% | 900 RV | ±3% |
| Hillary Clinton | 43% | John McCain | 43% | ||||
| Hillary Clinton | 48% | Fred Thompson | 38% | ||||
| Hillary Clinton | 46% | Mitt Romney | 36% | ||||
| Barack Obama | 41% | Rudy Giuliani | 46% | ||||
| Barack Obama | 47% | Fred Thompson | 34% | ||||
| Rasmussen Reports/Pulse Opinion Research [547] | Jun 4–5, 2007 | Barack Obama | 39% | Rudy Giuliani | 51% | 800 LV | ±4% |
| Barack Obama | 47% | Fred Thompson | 44% | ||||
| USA Today/Gallup [548] | Jun 1–3, 2007 | Hillary Clinton | 45% | Rudy Giuliani | 52% | 1,004 A | ±3% |
| Rasmussen Reports/Pulse Opinion Research [549] | May 30–31, 2007 | Hillary Clinton | 44% | Rudy Giuliani | 47% | 800 LV | ±4% |
| Hillary Clinton | 42% | John McCain | 48% | ||||
| Rasmussen Reports/Pulse Opinion Research [550] | May 29, 2007 | Bill Richardson | 39% | Rudy Giuliani | 43% | 800 LV | ±4% |
| Bill Richardson | 38% | John McCain | 43% | ||||
| Rasmussen Reports/Pulse Opinion Research [551] | May 21–22, 2007 | Hillary Clinton | 48% | Mike Huckabee | 43% | 800 LV | ±4% |
| Hillary Clinton | 49% | Sam Brownback | 41% | ||||
| Zogby International [552] | May 17–20, 2007 | Hillary Clinton | 43% | Rudy Giuliani | 48% | 993 LV | ±3.2% |
| Hillary Clinton | 43% | John McCain | 47% | ||||
| Hillary Clinton | 48% | Fred Thompson | 41% | ||||
| Hillary Clinton | 48% | Mitt Romney | 40% | ||||
| Barack Obama | 48% | Rudy Giuliani | 42% | ||||
| Barack Obama | 46% | John McCain | 43% | ||||
| Barack Obama | 52% | Fred Thompson | 35% | ||||
| Barack Obama | 52% | Mitt Romney | 35% | ||||
| John Edwards | 43% | Rudy Giuliani | 47% | ||||
| John Edwards | 41% | John McCain | 46% | ||||
| John Edwards | 48% | Fred Thompson | 40% | ||||
| John Edwards | 50% | Mitt Romney | 36% | ||||
| Bill Richardson | 35% | Rudy Giuliani | 50% | ||||
| Bill Richardson | 31% | John McCain | 52% | ||||
| Bill Richardson | 39% | Fred Thompson | 40% | ||||
| Bill Richardson | 40% | Mitt Romney | 37% | ||||
| Diageo/The Hotline/Financial Dynamics [553] | May 16–20, 2007 | Hillary Clinton | 43% | Rudy Giuliani | 45% | 800 RV | ±3.5% |
| Hillary Clinton | 45% | John McCain | 43% | ||||
| Barack Obama | 43% | Rudy Giuliani | 41% | ||||
| Barack Obama | 42% | John McCain | 39% | ||||
| John Edwards | 42% | Rudy Giuliani | 43% | ||||
| John Edwards | 44% | John McCain | 39% | ||||
| Rasmussen Reports/Pulse Opinion Research [554] | May 16–17, 2007 | John Edwards | 53% | Fred Thompson | 32% | 800 LV | ±4% |
| John Edwards | 54% | Mitt Romney | 33% | ||||
| Rasmussen Reports/Pulse Opinion Research [555] | May 14–15, 2007 | Barack Obama | 49% | Fred Thompson | 42% | 800 LV | ±4% |
| Barack Obama | 49% | Mitt Romney | 37% | ||||
| Rasmussen Reports/Pulse Opinion Research [556] | May 9–10, 2007 | Hillary Clinton | 47% | Fred Thompson | 44% | 800 LV | ±4% |
| Hillary Clinton | 47% | Mitt Romney | 44% | ||||
| Rasmussen Reports/Pulse Opinion Research [557] | May 7–8, 2007 | John Edwards | 47% | Rudy Giuliani | 45% | 800 LV | ±4% |
| John Edwards | 48% | John McCain | 41% | ||||
| Newsweek/Princeton Survey Research Associates International [558] | May 2–3, 2007 | Hillary Clinton | 49% | Rudy Giuliani | 46% | 831 RV | ±4% |
| Hillary Clinton | 50% | John McCain | 44% | ||||
| Hillary Clinton | 57% | Mitt Romney | 35% | ||||
| Barack Obama | 50% | Rudy Giuliani | 43% | ||||
| Barack Obama | 52% | John McCain | 39% | ||||
| Barack Obama | 58% | Mitt Romney | 29% | ||||
| John Edwards | 50% | Rudy Giuliani | 44% | ||||
| John Edwards | 52% | John McCain | 42% | ||||
| John Edwards | 64% | Mitt Romney | 27% | ||||
| Rasmussen Reports/Pulse Opinion Research [559] | Apr 30 – May 1, 2007 | Hillary Clinton | 45% | Rudy Giuliani | 45% | 800 LV | ±4% |
| Hillary Clinton | 48% | John McCain | 44% | ||||
| WNBC/Marist College [560] | Apr 26 – May 1, 2007 | Hillary Clinton | 48% | Rudy Giuliani | 43% | 822 RV | ±3.5% |
| Hillary Clinton | 47% | John McCain | 42% | ||||
| Barack Obama | 41% | Rudy Giuliani | 43% | ||||
| John Edwards | 49% | Rudy Giuliani | 43% | ||||
| Barack Obama | 39% | John McCain | 46% | ||||
| John Edwards | 49% | John McCain | 39% | ||||
| Quinnipiac University [561] | Apr 25 – May 1, 2007 | Hillary Clinton | 40% | Rudy Giuliani | 49% | 1,166 RV | ±2.9% |
| Barack Obama | 41% | Rudy Giuliani | 44% | ||||
| Al Gore | 41% | Rudy Giuliani | 48% | ||||
| Hillary Clinton | 41% | John McCain | 46% | ||||
| Barack Obama | 42% | John McCain | 42% | ||||
| Al Gore | 41% | John McCain | 47% | ||||
| Hillary Clinton | 46% | Fred Thompson | 39% | ||||
| Barack Obama | 47% | Fred Thompson | 34% | ||||
| Al Gore | 47% | Fred Thompson | 37% | ||||
| Diageo/The Hotline/Financial Dynamics [562] | Apr 26–30, 2007 | Hillary Clinton | 41% | Rudy Giuliani | 44% | 801 RV | ±3.5% |
| Hillary Clinton | 42% | John McCain | 43% | ||||
| Hillary Clinton | 47% | Mitt Romney | 33% | ||||
| Barack Obama | 45% | Rudy Giuliani | 36% | ||||
| Barack Obama | 46% | John McCain | 34% | ||||
| Barack Obama | 50% | Mitt Romney | 23% | ||||
| John Edwards | 44% | Rudy Giuliani | 38% | ||||
| John Edwards | 45% | John McCain | 36% | ||||
| John Edwards | 49% | Mitt Romney | 24% | ||||
| NBC News/Wall Street Journal [563] | Apr 20–23, 2007 | Barack Obama | 45% | John McCain | 39% | 1,004 A | ±3.1% |
| Rasmussen Reports/Pulse Opinion Research [564] | Apr 18–19, 2007 | Barack Obama | 43% | Rudy Giuliani | 46% | 800 LV | ±4% |
| Barack Obama | 47% | Fred Thompson | 37% | ||||
| Rasmussen Reports/Pulse Opinion Research [565] | Apr 11–12, 2007 | Bill Richardson | 34% | Rudy Giuliani | 51% | 800 LV | ±4% |
| Bill Richardson | 42% | Mitt Romney | 34% | ||||
| Rasmussen Reports/Pulse Opinion Research [566] | Apr 9–10, 2007 | Barack Obama | 48% | John McCain | 42% | 800 LV | ±4% |
| Barack Obama | 52% | Mitt Romney | 37% | ||||
| Time/Schulman, Ronca, & Bucuvalas Inc. (SRBI) [567] | April 5–9, 2007 | Hillary Clinton | 43% | Rudy Giuliani | 48% | 1,102 RV | ±3% |
| Barack Obama | 45% | Rudy Giuliani | 45% | ||||
| Hillary Clinton | 49% | Mitt Romney | 37% | ||||
| Barack Obama | 54% | Mitt Romney | 31% | ||||
| Hillary Clinton | 44% | John McCain | 46% | ||||
| Barack Obama | 47% | John McCain | 42% | ||||
| Los Angeles Times/Bloomberg [568] | April 5−9, 2007 | Barack Obama | 48% | John McCain | 40% | 603 RV | ±4% |
| Hillary Clinton | 45% | John McCain | 42% | ||||
| Hillary Clinton | 42% | Rudy Giuliani | 48% | ||||
| Barack Obama | 46% | Rudy Giuliani | 42% | ||||
| Rasmussen Reports/Pulse Opinion Research [569] | Apr 4–5, 2007 | John Edwards | 49% | Rudy Giuliani | 43% | 800 LV | ±4% |
| John Edwards | 50% | Fred Thompson | 36% | ||||
| Rasmussen Reports/Pulse Opinion Research [570] | Apr 2–3, 2007 | Hillary Clinton | 47% | Rudy Giuliani | 48% | 800 LV | ±4% |
| Hillary Clinton | 47% | John McCain | 46% | ||||
| Rasmussen Reports/Pulse Opinion Research [571] | Mar 28–29, 2007 | Barack Obama | 43% | Rudy Giuliani | 44% | 800 LV | ±4% |
| Barack Obama | 52% | Mike Huckabee | 32% | ||||
| Rasmussen Reports/Pulse Opinion Research [572] | Mar 26–27, 2007 | John Edwards | 47% | John McCain | 38% | 800 LV | ±4% |
| John Edwards | 55% | Mitt Romney | 29% | ||||
| Time/Schulman, Ronca, & Bucuvalas Inc. (SRBI) [573] | March 23–26, 2007 | Hillary Clinton | 41% | Rudy Giuliani | 50% | 1,102 RV | ±3% |
| Barack Obama | 44% | Rudy Giuliani | 45% | ||||
| Hillary Clinton | 42% | John McCain | 48% | ||||
| Barack Obama | 43% | John McCain | 45% | ||||
| Hillary Clinton | 51% | Mitt Romney | 34% | ||||
| Barack Obama | 53% | Mitt Romney | 29% | ||||
| McLaughlin & Associates [574] | March 21–25, 2007 | Hillary Clinton | 40% | Rudy Giuliani | 42% | 1,000 LV | ±3.1% |
| Hillary Clinton | 38% | John McCain | 44% | ||||
| Barack Obama | 38% | Rudy Giuliani | 40% | ||||
| Barack Obama | 39% | John McCain | 38% | ||||
| Democracy Corps/Greenberg Quinlan Rosner (D) [359] | March 20–25, 2007 | Hillary Clinton | 46% | John McCain | 48% | 763 LV | Not reported |
| Barack Obama | 50% | John McCain | 44% | ||||
| Rasmussen Reports/Pulse Opinion Research [575] | Mar 21–22, 2007 | Hillary Clinton | 43% | Fred Thompson | 44% | 800 LV | ±4% |
| Barack Obama | 49% | Fred Thompson | 37% | ||||
| Time/Schulman, Ronca, & Bucuvalas Inc. (SRBI) [576] | Mar 9–12, 2007 | Hillary Clinton | 43% | Rudy Giuliani | 47% | 1,500 RV | ±3% |
| Hillary Clinton | 44% | John McCain | 43% | ||||
| Barack Obama | 44% | Rudy Giuliani | 43% | ||||
| Barack Obama | 44% | John McCain | 41% | ||||
| American Research Group [577] | Mar 2–5, 2007 | Hillary Clinton | 42% | Rudy Giuliani | 48% | 2,104 LV | ±2.2% |
| Barack Obama | 41% | Rudy Giuliani | 46% | ||||
| Hillary Clinton | 42% | John McCain | 45% | ||||
| Barack Obama | 42% | John McCain | 46% | ||||
| Newsweek/Princeton Survey Research Associates International [578] | Feb 28 – Mar 1, 2007 | Hillary Clinton | 46% | Rudy Giuliani | 47% | 1,202 RV | ±3% |
| Barack Obama | 43% | Rudy Giuliani | 48% | ||||
| John Edwards | 45% | Rudy Giuliani | 47% | ||||
| Hillary Clinton | 47% | John McCain | 46% | ||||
| Barack Obama | 45% | John McCain | 43% | ||||
| John Edwards | 48% | John McCain | 43% | ||||
| Hillary Clinton | 53% | Mitt Romney | 38% | ||||
| Barack Obama | 54% | Mitt Romney | 34% | ||||
| John Edwards | 58% | Mitt Romney | 30% | ||||
| Time/Schulman, Ronca, & Bucuvalas Inc. (SRBI) [579] | Feb 23–26, 2007 | Hillary Clinton | 44% | Rudy Giuliani | 47% | 1,144 RV | ±3% |
| Hillary Clinton | 46% | John McCain | 45% | ||||
| Barack Obama | 42% | Rudy Giuliani | 47% | ||||
| Barack Obama | 46% | John McCain | 42% | ||||
| Zogby International [580] | Feb 22–24, 2007 | Hillary Clinton | 40% | Rudy Giuliani | 47% | 1,078 LV | ±3% |
| Hillary Clinton | 39% | John McCain | 47% | ||||
| Hillary Clinton | 45% | Mitt Romney | 35% | ||||
| Barack Obama | 46% | Rudy Giuliani | 40% | ||||
| Barack Obama | 44% | John McCain | 40% | ||||
| Barack Obama | 51% | Mitt Romney | 29% | ||||
| John Edwards | 40% | Rudy Giuliani | 46% | ||||
| John Edwards | 38% | John McCain | 47% | ||||
| John Edwards | 47% | Mitt Romney | 32% | ||||
| Democracy Corps/Greenberg Quinlan Rosner (D) [359] | February 19, 2007 | Hillary Clinton | 44% | John McCain | 46% | 1,014 LV | Not reported |
| Quinnipiac University [581] | Feb 13–19, 2007 | Hillary Clinton | 43% | Rudy Giuliani | 48% | 1,536 RV | ±2.5% |
| Hillary Clinton | 44% | John McCain | 46% | ||||
| Hillary Clinton | 49% | Mitt Romney | 37% | ||||
| Barack Obama | 40% | Rudy Giuliani | 47% | ||||
| Barack Obama | 43% | John McCain | 43% | ||||
| Barack Obama | 49% | Mitt Romney | 29% | ||||
| John Edwards | 40% | Rudy Giuliani | 48% | ||||
| John Edwards | 42% | John McCain | 43% | ||||
| John Edwards | 48% | Mitt Romney | 32% | ||||
| Rasmussen Reports/Pulse Opinion Research [582] | Feb 14–15, 2007 | Hillary Clinton | 48% | Chuck Hagel | 40% | 800 LV | ±4% |
| Barack Obama | 50% | Chuck Hagel | 34% | ||||
| WNBC/Marist College [583] | Feb 12–15, 2007 | Hillary Clinton | 45% | Rudy Giuliani | 47% | 978 RV | ±3.5% |
| Barack Obama | 41% | Rudy Giuliani | 45% | ||||
| John Edwards | 44% | Rudy Giuliani | 44% | ||||
| Hillary Clinton | 46% | John McCain | 46% | ||||
| Barack Obama | 41% | John McCain | 44% | ||||
| John Edwards | 43% | John McCain | 44% | ||||
| Hillary Clinton | 49% | Mitt Romney | 36% | ||||
| Hillary Clinton | 56% | Newt Gingrich | 36% | ||||
| Fox News/Opinion Dynamics Corporation [584] | Feb 13–14, 2007 | Hillary Clinton | 40% | Rudy Giuliani | 49% | 900 RV | ±3% |
| Barack Obama | 39% | Rudy Giuliani | 45% | ||||
| USA Today/Gallup [585] | Feb 9–11, 2007 | Hillary Clinton | 50% | John McCain | 47% | 1,006 A | ±3% |
| Hillary Clinton | 48% | Rudy Giuliani | 50% | ||||
| Barack Obama | 48% | John McCain | 48% | ||||
| Barack Obama | 43% | Rudy Giuliani | 52% | ||||
| Times Union/Siena College [586] | Feb 6–9, 2007 | Hillary Clinton | 45% | John McCain | 44% | 1,120 RV | ±2.9% |
| Hillary Clinton | 44% | Rudy Giuliani | 45% | ||||
| Democracy Corps/Greenberg Quinlan Rosner (D) [359] | January 28, 2007 | Hillary Clinton | 47% | John McCain | 48% | 1,002 LV | Not reported |
| Newsweek/Princeton Survey Research Associates International [587] | Jan 24–25, 2007 | Hillary Clinton | 50% | John McCain | 44% | 837 RV | ±4% |
| Barack Obama | 48% | John McCain | 42% | ||||
| John Edwards | 48% | John McCain | 44% | ||||
| Hillary Clinton | 49% | Rudy Giuliani | 46% | ||||
| Barack Obama | 47% | Rudy Giuliani | 44% | ||||
| John Edwards | 46% | Rudy Giuliani | 47% | ||||
| Hillary Clinton | 56% | Mitt Romney | 37% | ||||
| Barack Obama | 56% | Mitt Romney | 30% | ||||
| John Edwards | 60% | Mitt Romney | 26% | ||||
| Rasmussen Reports/Pulse Opinion Research [588] | Jan 22–23, 2007 | Bill Richardson | 34% | Rudy Giuliani | 49% | 800 LV | ±4% |
| Bill Richardson | 39% | John McCain | 43% | ||||
| Time/Schulman, Ronca, & Bucuvalas, Inc. (SRBI) [589] | Jan 22–23, 2007 | Hillary Clinton | 47% | John McCain | 47% | 1,064 RV | ±3% |
| Barack Obama | 42% | John McCain | 49% | ||||
| John Edwards | 42% | John McCain | 49% | ||||
| Cook Political Report/RT Strategies [590] | Jan 18–21, 2007 | Hillary Clinton | 42% | John McCain | 48% | 872 RV | ±3.3% |
| ABC News/Washington Post [591] | Jan 16–19, 2007 | Hillary Clinton | 50% | John McCain | 45% | 1,000 A | ±3% |
| Barack Obama | 47% | John McCain | 45% | ||||
| Barack Obama | 45% | Rudy Giuliani | 49% | ||||
| Hillary Clinton | 49% | Rudy Giuliani | 47% | ||||
| Rasmussen Reports/Pulse Opinion Research [592] | Jan 17–18, 2007 | Barack Obama | 47% | John McCain | 44% | 800 LV | ±4% |
| John Edwards | 46% | John McCain | 43% | ||||
| Newsweek/Princeton Survey Research Associates International [593] | Jan 17–18, 2007 | Hillary Clinton | 48% | John McCain | 47% | 896 RV | ±4% |
| Barack Obama | 46% | John McCain | 44% | ||||
| John Edwards | 48% | John McCain | 43% | ||||
| Hillary Clinton | 47% | Rudy Giuliani | 48% | ||||
| Barack Obama | 45% | Rudy Giuliani | 47% | ||||
| John Edwards | 48% | Rudy Giuliani | 45% | ||||
| Democracy Corps/Greenberg Quinlan Rosner (D) [359] | January 16, 2007 | Hillary Clinton | 44% | John McCain | 49% | 1,000 LV | Not reported |
| Diageo/The Hotline/Financial Dynamics [594] | Jan 11–14, 2007 | Hillary Clinton | 39% | John McCain | 48% | 800 RV | ±3.5% |
| Barack Obama | 38% | John McCain | 43% | ||||
| John Edwards | 35% | John McCain | 45% | ||||
| Hillary Clinton | 40% | Rudy Giuliani | 48% | ||||
| Barack Obama | 38% | Rudy Giuliani | 41% | ||||
| John Edwards | 41% | Rudy Giuliani | 40% | ||||
| George Washington University Battleground Poll [595] | Jan 8–11, 2007 | Hillary Clinton | 43% | Rudy Giuliani | 53% | 1,000 LV | ±3.1% |
| Hillary Clinton | 43% | John McCain | 53% | ||||
| Barack Obama | 41% | Rudy Giuliani | 50% | ||||
| Barack Obama | 39% | John McCain | 51% | ||||
| Investor's Business Daily/TIPP [596] | Jan 2–4, 2007 | Hillary Clinton | 43% | Rudy Giuliani | 48% | 951 A | ±3% |
| Barack Obama | 36% | Rudy Giuliani | 49% | ||||
| John Edwards | 42% | Rudy Giuliani | 47% | ||||
| Hillary Clinton | 41% | John McCain | 48% | ||||
| Barack Obama | 36% | John McCain | 48% | ||||
| John Edwards | 43% | John McCain | 44% | ||||
| Hillary Clinton | 48% | Mitt Romney | 35% | ||||
| Barack Obama | 43% | Mitt Romney | 31% | ||||
| John Edwards | 53% | Mitt Romney | 29% | ||||
| Rasmussen Reports/Pulse Opinion Research [597] | Dec 18–19, 2006 | Al Gore | 43% | Rudy Giuliani | 46% | 1,000 LV | ±3% |
| Hillary Clinton | 43% | Rudy Giuliani | 47% | ||||
| CNN/Opinion Research Corporation [598] | Dec 15–17, 2006 | Barack Obama | 43% | John McCain | 47% | 1019 | ±4.5% |
| Barack Obama | 42% | Rudy Giuliani | 49% | ||||
| Barack Obama | 51% | Mitt Romney | 35% | ||||
| Al Gore | 47% | John McCain | 46% | ||||
| Al Gore | 46% | Rudy Giuliani | 46% | ||||
| Al Gore | 53% | Mitt Romney | 37% | ||||
| Rasmussen Reports/Pulse Opinion Research [599] | Dec 14–15, 2006 | Hillary Clinton | 45% | John McCain | 49% | 1,000 LV | ±3% |
| Al Gore | 44% | John McCain | 49% | ||||
| Rasmussen Reports/Pulse Opinion Research [600] | Dec 12–13, 2006 | John Edwards | 41% | John McCain | 46% | 1,000 LV | ±3% |
| Barack Obama | 40% | John McCain | 46% | ||||
| Los Angeles Times/Bloomberg [601] | Dec 8–11, 2006 | Hillary Clinton | 36% | John McCain | 50% | 1,555 A | ±3% |
| Hillary Clinton | 42% | Mitt Romney | 36% | ||||
| NBC News/Wall Street Journal [602] | Dec 8–11, 2006 | Hillary Clinton | 43% | John McCain | 47% | Not reported | ±3.3% |
| Barack Obama | 38% | John McCain | 43% | ||||
| John Edwards | 43% | John McCain | 41% | ||||
| Hillary Clinton | 47% | Mitt Romney | 37% | ||||
| NPR/Public Opinion Strategies/Greenberg Quinlan Rosner [603] | Dec 7, 9–10, 2006 | Hillary Clinton | 41% | John McCain | 48% | 800 LV | ±3.46% |
| Barack Obama | 43% | Mitt Romney | 27% | ||||
| Newsweek/Princeton Survey Research Associates International [604] | Dec 6–7, 2006 | Hillary Clinton | 50% | John McCain | 43% | 1,000 A | Not reported |
| Hillary Clinton | 48% | Rudy Giuliani | 47% | ||||
| Hillary Clinton | 58% | Mitt Romney | 32% | ||||
| Barack Obama | 43% | John McCain | 45% | ||||
| Barack Obama | 44% | Rudy Giuliani | 47% | ||||
| Barack Obama | 55% | Mitt Romney | 25% | ||||
| Fox News/Opinion Dynamics Corporation [605] | Dec 5–6, 2006 | Barack Obama | 35% | Rudy Giuliani | 46% | 900 RV | ±3% |
| Hillary Clinton | 39% | Rudy Giuliani | 48% | ||||
| Barack Obama | 30% | John McCain | 49% | ||||
| Hillary Clinton | 40% | John McCain | 48% | ||||
| Rasmussen Reports/Pulse Opinion Research [606] | Dec 4–5, 2006 | Barack Obama | 47% | Mitt Romney | 38% | 1,000 LV | ±3% |
| John Edwards | 50% | Mitt Romney | 37% | ||||
| WNBC/Marist College [607] | Nov 27 – Dec 3, 2006 | Hillary Clinton | 43% | Rudy Giuliani | 49% | 967 RV | ±3.5% |
| Hillary Clinton | 43% | John McCain | 49% | ||||
| Hillary Clinton | 47% | Condoleezza Rice | 43% | ||||
| Rasmussen Reports/Pulse Opinion Research [608] | Nov 28–29, 2006 | Barack Obama | 48% | Newt Gingrich | 38% | 1,000 LV | ±3% |
| Hillary Clinton | 50% | Newt Gingrich | 41% | ||||
| Rasmussen Reports/Pulse Opinion Research [609] | Nov 13–14, 2006 | John Edwards | 43% | John McCain | 47% | 1,000 LV | ±3% |
| John Edwards | 41% | Rudy Giuliani | 50% | ||||
| John Edwards | 50% | Mike Huckabee | 33% | ||||
| John Edwards | 51% | Mitt Romney | 34% | ||||
| Rasmussen Reports/Pulse Opinion Research [610] | Nov 10–11, 2006 | Tom Vilsack | 32% | John McCain | 49% | 1,000 LV | ±3% |
| Tom Vilsack | 39% | Mitt Romney | 35% | ||||
| Diageo/The Hotline/Financial Dynamics [611] | Nov 8–12, 2006 | Hillary Clinton | 40% | John McCain | 45% | 1,005 RV | ±3.1% |
| John Edwards | 35% | John McCain | 42% | ||||
| Barack Obama | 35% | John McCain | 39% | ||||
| Rasmussen Reports/Pulse Opinion Research [612] | Nov 8–9, 2006 | Al Gore | 41% | John McCain | 48% | 1,000 LV | ±3% |
| Al Gore | 44% | Rudy Giuliani | 47% | ||||
| McLaughlin & Associates [613] | Nov 7, 2006 | Hillary Clinton | 35% | John McCain | 51% | 1,000 LV | ±3.1% |
| Hillary Clinton | 37% | Rudy Giuliani | 51% | ||||
| Rasmussen Reports/Pulse Opinion Research [614] | Nov 6–7, 2006 | Barack Obama | 39% | John McCain | 47% | 1,000 LV | ±3% |
| Barack Obama | 39% | Rudy Giuliani | 48% | ||||
| Barack Obama | 48% | Mitt Romney | 33% | ||||
| Barack Obama | 50% | Mike Huckabee | 31% | ||||
| Hillary Clinton | 43% | John McCain | 48% | ||||
| Hillary Clinton | 46% | Rudy Giuliani | 46% | ||||
| CNN/Opinion Research Corporation [598] | Nov 3–5, 2006 | Hillary Clinton | 47% | John McCain | 48% | 1,008 A | ±3% |
| Hillary Clinton | 47% | Rudy Giuliani | 47% | ||||
| Barack Obama | 40% | John McCain | 49% | ||||
| Barack Obama | 41% | Rudy Giuliani | 50% | ||||
| John Kerry | 37% | John McCain | 55% | ||||
| John Kerry | 40% | Rudy Giuliani | 53% | ||||
| Fox News/Opinion Dynamics Corporation [615] | Oct 24–25, 2006 | Clinton/Obama | 40% | McCain/Giuliani | 48% | 900 LV | ±3% |
| Barack Obama | 38% | John McCain | 41% | ||||
| Hillary Clinton | 39% | John McCain | 45% | ||||
| CNN/Opinion Research Corporation [598] | Oct 13–15, 2006 | Hillary Clinton | 51% | John McCain | 44% | Not reported | ±4.5% |
| Hillary Clinton | 48% | Rudy Giuliani | 47% | ||||
| Hillary Clinton | 47% | John McCain | 48% | ||||
| Hillary Clinton | 50% | Rudy Giuliani | 46% | ||||
| WNBC/Marist College [616] | Sep 18–20, 2006 | Hillary Clinton | 43% | John McCain | 48% | 1,018 RV | ±3% |
| Hillary Clinton | 42% | Rudy Giuliani | 49% | ||||
| Hillary Clinton | 49% | Condoleezza Rice | 43% | ||||
| Fox News/Opinion Dynamics Corporation [617] | Aug 29–30, 2006 | Hillary Clinton | 39% | John McCain | 47% | 900 RV | ±3% |
| Hillary Clinton | 42% | Rudy Giuliani | 46% | ||||
| Al Gore | 40% | John McCain | 47% | ||||
| Al Gore | 42% | Rudy Giuliani | 46% | ||||
| Diageo/The Hotline/Financial Dynamics [618] | Jul 20–23, 2006 | Hillary Clinton | 37% | John McCain | 49% | 800 RV | ±3.5% |
| Time/Schulman, Ronca, & Bucuvalas Inc. (SRBI) [619] | Jul 13–17, 2006 | Hillary Clinton | 47% | John McCain | 49% | 902 RV | Not reported |
| John Kerry | 42% | John McCain | 52% | ||||
| Al Gore | 43% | John McCain | 52% | ||||
| Diageo/The Hotline/Financial Dynamics [620] | Jun 21–25, 2006 | Hillary Clinton | 40% | John McCain | 50% | 800 RV | ±3.5% |
| John Edwards | 36% | John McCain | 49% | ||||
| Cook Political Report/RT Strategies [621] | Jun 1–4, 2006 | Hillary Clinton | 40% | John McCain | 47% | 874 RV | Not reported |
| Diageo/The Hotline/Financial Dynamics [622] | May 18–21, 2006 | Hillary Clinton | 38% | John McCain | 49% | 801 RV | ±3.5% |
| Al Gore | 33% | John McCain | 51% | ||||
| Fox News/Opinion Dynamics Corporation [623] | May 16–18, 2006 | Hillary Clinton | 51% | Jeb Bush | 35% | 900 RV | ±3% |
| Hillary Clinton | 42% | John McCain | 46% | ||||
| Hillary Clinton | 40% | Rudy Giuliani | 49% | ||||
| Al Gore | 50% | Jeb Bush | 33% | ||||
| Al Gore | 36% | John McCain | 48% | ||||
| Al Gore | 37% | Rudy Giuliani | 50% | ||||
| NBC News/Wall Street Journal [624] | Apr 21–24, 2006 | Hillary Clinton | 37% | John McCain | 46% | 1,005 A | ±3.1% |
| Cook Political Report/RT Strategies [625] | Apr 6–9, 2006 | Hillary Clinton | 37% | John McCain | 46% | Not reported | ±3.1% |
| Fox News/Opinion Dynamics Corporation [626] | Mar 14–15, 2006 | Hillary Clinton | 39% | John McCain | 50% | 900 RV | ±3% |
| John Kerry | 33% | John McCain | 53% | ||||
| Al Gore | 34% | John McCain | 52% | ||||
| Hillary Clinton | 39% | Rudy Giuliani | 51% | ||||
| Hillary Clinton | 50% | Dick Cheney | 37% | ||||
| Al Gore | 48% | Dick Cheney | 36% | ||||
| Cook Political Report/RT Strategies [627] | Feb 23–26, 2006 | Hillary Clinton | 36% | John McCain | 48% | Not reported | Not reported |
| Diageo/The Hotline/Financial Dynamics [628] | Feb 16–19, 2006 | Hillary Clinton | 40% | John McCain | 50% | 807 RV | ±3.5% |
| WNBC/Marist College [629] | Feb 13–15, 2006 | John Kerry | 45% | Rudy Giuliani | 48% | 931 RV | ±3.5% |
| John Kerry | 37% | John McCain | 54% | ||||
| John Kerry | 44% | Condoleezza Rice | 50% | ||||
| John Edwards | 44% | Rudy Giuliani | 47% | ||||
| John Edwards | 41% | John McCain | 47% | ||||
| John Edwards | 51% | Condoleezza Rice | 42% | ||||
| Al Gore | 42% | Rudy Giuliani | 53% | ||||
| Al Gore | 38% | John McCain | 55% | ||||
| Hillary Clinton | 47% | Rudy Giuliani | 48% | ||||
| Hillary Clinton | 42% | John McCain | 52% | ||||
| Hillary Clinton | 49% | Condoleezza Rice | 44% | ||||
| Fox News/Opinion Dynamics Corporation [630] | Feb 7–8, 2006 | Hillary Clinton | 38% | John McCain | 51% | 900 RV | ±3% |
| John Kerry | 33% | John McCain | 53% | ||||
| Hillary Clinton | 40% | Rudy Giuliani | 51% | ||||
| John Kerry | 34% | Rudy Giuliani | 53% | ||||
| Diageo/The Hotline/Financial Dynamics [631] | Jan 12–15, 2006 | Hillary Clinton | 36% | John McCain | 52% | 806 RV | ±3.5% |
| Zogby Interactive [632] | Dec 6–8, 2005 | Hillary Clinton | 37% | John McCain | 52% | 1,013 LV | ±3.1% |
| Hillary Clinton | 46% | Condoleezza Rice | 47% | ||||
| John Kerry | 34% | John McCain | 55% | ||||
| John Kerry | 45% | Condoleezza Rice | 48% | ||||
| Mark Warner | 23% | John McCain | 58% | ||||
| Mark Warner | 32% | Condoleezza Rice | 50% | ||||
| Quinnipiac University [633] | Nov 28 – Dec 4, 2005 | Hillary Clinton | 40% | John McCain | 44% | 1,230 RV | ±2.8% |
| Diageo/The Hotline/Financial Dynamics [634] | Nov 11–15, 2005 | Hillary Clinton | 39% | John McCain | 52% | 700 RV | ±3.7% |
| NBC News/Wall Street Journal [635] | Nov 4–7, 2005 | Hillary Clinton | 42% | John McCain | 44% | Not reported | Not reported |
| Hillary Clinton | 50% | Bill Frist | 37% | ||||
| John Kerry | 35% | John McCain | 53% | ||||
| John Kerry | 45% | Bill Frist | 35% | ||||
| WNBC/Marist College [636] | Oct 12–13, 17, 2005 | Hillary Clinton | 43% | Rudy Giuliani | 50% | 827 RV | ±3.5% |
| Hillary Clinton | 41% | John McCain | 50% | ||||
| Hillary Clinton | 50% | Condoleezza Rice | 41% | ||||
| John Kerry | 40% | Rudy Giuliani | 53% | ||||
| John Kerry | 40% | John McCain | 51% | ||||
| John Kerry | 46% | Condoleezza Rice | 45% | ||||
| John Edwards | 43% | Rudy Giuliani | 48% | ||||
| John Edwards | 41% | John McCain | 49% | ||||
| John Edwards | 49% | Condoleezza Rice | 42% | ||||
| Fox News/Opinion Dynamics Corporation [637] | Sep 27–28, 2005 | Hillary Clinton | 39% | Rudy Giuliani | 50% | 900 RV | ±3% |
| Hillary Clinton | 38% | John McCain | 49% | ||||
| Hillary Clinton | 46% | Condoleezza Rice | 43% | ||||
| John Kerry | 36% | Rudy Giuliani | 52% | ||||
| John Kerry | 35% | John McCain | 53% | ||||
| John Kerry | 43% | Condoleezza Rice | 45% | ||||
| Al Gore | 29% | John McCain | 57% | ||||
| Al Gore | 32% | Rudy Giuliani | 55% | ||||
| Gallup [638] | July 25–28, 2005 | John Kerry | 41% | John McCain | 54% | 922 RV | ±4% |
| John Kerry | 41% | Rudy Giuliani | 54% | ||||
| Zogby Interactive [632] | Jun 20–22, 2005 | Hillary Clinton | 35% | John McCain | 54% | 1,000 LV | ±3.2% |
| John Kerry | 35% | John McCain | 55% | ||||
| Rasmussen Reports/Pulse Opinion Research [639] | Apr 25–26, 2005 | Hillary Clinton | 38% | John McCain | 45% | 1,000 A | ±3% |
| Hillary Clinton | 40% | Rudy Giuliani | 42% | ||||
| Marist College [640] | Apr 18–21, 2005 | Hillary Clinton | 42% | John McCain | 50% | 838 RV | ±3.5% |
| Hillary Clinton | 46% | Rudy Giuliani | 47% | ||||
| John Kerry | 41% | John McCain | 51% | ||||
| Hillary Clinton | 55% | Jeb Bush | 38% | ||||
| John Kerry | 46% | Rudy Giuliani | 48% | ||||
| John Edwards | 43% | John McCain | 46% | ||||
| John Edwards | 48% | Rudy Giuliani | 45% | ||||
| Moore Information [641] | Mar 21–23, 2005 | Hillary Clinton | 38% | John McCain | 49% | 800 RV | ±3% |
| Hillary Clinton | 41% | Rudy Giuliani | 47% | ||||
| Democracy Corps/Greenberg Quinlan Rosner (D) [642] | Mar 15–21, 2005 | Hillary Clinton | 50% | Jeb Bush | 47% | 501 LV | Not reported |
| Quinnipiac University [643] | Mar 2–7, 2005 | Hillary Clinton | 43% | Rudy Giuliani | 44% | 1,534 RV | ±2.5% |
| Hillary Clinton | 41% | John McCain | 43% | ||||
| The Hotline/Westhill Partners [644] | Feb 24–27, 2005 | Bill Richardson | 36% | Arnold Schwarzenegger | 27% | 800 RV | ±3.5% |
| Marist College [645] | Feb 14–16, 2005 | Hillary Clinton | 42% | John McCain | 54% | 851 RV | ±3.5% |
| John Kerry | 37% | John McCain | 55% | ||||
| Hillary Clinton | 47% | Rudy Giuliani | 49% | ||||
| John Kerry | 44% | Rudy Giuliani | 50% | ||||
| John Edwards | 39% | John McCain | 51% | ||||
| John Edwards | 43% | Rudy Giuliani | 49% | ||||
| Hillary Clinton | 51% | Condoleezza Rice | 43% | ||||
| Rasmussen Reports/Pulse Opinion Research [646] | Jan 29–30, 2005 | Hillary Clinton | 47% | Condoleezza Rice | 40% | 1,000 A | ±3% |
| John Kerry | 43% | Condoleezza Rice | 45% | ||||
| The Hotline/Westhill Partners [647] | Jan 25–27, 2005 | Hillary Clinton | 46% | Jeb Bush | 37% | 800 RV | ±3.5% |
| Fox News/Opinion Dynamics Corporation [648] | Dec 14–15, 2004 | John Kerry | 45% | Jeb Bush | 37% | 900 RV | ±3% |
| Hillary Clinton | 46% | Jeb Bush | 35% | ||||
| Hillary Clinton | 41% | George Pataki | 35% | ||||
| Hillary Clinton | 40% | Bill Frist | 33% | ||||
| Quinnipiac University [649] | Dec 7–12, 2004 | Hillary Clinton | 43% | Rudy Giuliani | 45% | 1,529 RV | ±2.5% |
| Fox News/Opinion Dynamics Corporation [650] | Nov 16–17, 2004 | Hillary Clinton | 38% | Rudy Giuliani | 49% | 900 RV | ±3% |
| Hillary Clinton | 37% | John McCain | 53% | ||||
| John Kerry | 41% | Rudy Giuliani | 49% | ||||
| John Kerry | 38% | John McCain | 50% | ||||
| John Edwards | 38% | Rudy Giuliani | 50% |
See [651]
| Poll Source | Date | Democrat(s) | % | Republican(s) | % | Independent(s) | % |
|---|---|---|---|---|---|---|---|
| Fox News/Opinion Dynamics [652] | January 30–31, 2008 | Hillary Clinton | 41% | John McCain | 41% | Michael Bloomberg | 6% |
| Fox News/Opinion Dynamics [652] | January 30–31, 2008 | Hillary Clinton | 46% | Mitt Romney | 30% | Michael Bloomberg | 8% |
| Rasmussen Reports Poll [653] | Nov 9–11, 2007 | Hillary Clinton | 43% | Rudy Giuliani | 38% | Michael Bloomberg | 11% |
| Rasmussen Reports Poll [654] | Oct 19–21, 2007 | Hillary Clinton | 45% | Rudy Giuliani | 35% | Stephen Colbert | 13% |
| Rasmussen Reports Poll [654] | Oct 19–21, 2007 | Hillary Clinton | 46% | Fred Thompson | 34% | Stephen Colbert | 12% |
| Rasmussen Reports Poll [655] | Sep 25–26, 2007 | Hillary Clinton | 42% | Rudy Giuliani | 32% | Mike Bloomberg | 7% |
| NBC News/Wall Street Journal Poll [656] | July 27–30, 2007 | Hillary Clinton | 42% | Rudy Giuliani | 34% | Michael Bloomberg | 11% |
| Zogby America Poll [657] | July 12–14, 2007 | Hillary Clinton | 41% | John McCain | 36% | Mike Bloomberg | 11% |
| Zogby America Poll [657] | July 12–14, 2007 | Hillary Clinton | 44% | Rudy Giuliani | 37% | Mike Bloomberg | 7% |
| Zogby America Poll [657] | July 12–14, 2007 | Hillary Clinton | 44% | Fred Thompson | 37% | Mike Bloomberg | 8% |
| Zogby America Poll [657] | July 12–14, 2007 | Hillary Clinton | 44% | Mitt Romney | 32% | Mike Bloomberg | 10% |
| Zogby America Poll [657] | July 12–14, 2007 | Barack Obama | 43% | Rudy Giuliani | 39% | Mike Bloomberg | 6% |
| Zogby America Poll [657] | July 12–14, 2007 | Barack Obama | 41% | John McCain | 37% | Mike Bloomberg | 9% |
| Zogby America Poll [657] | July 12–14, 2007 | Barack Obama | 44% | Fred Thompson | 36% | Mike Bloomberg | 7% |
| Zogby America Poll [657] | July 12–14, 2007 | Barack Obama | 45% | Mitt Romney | 29% | Mike Bloomberg | 9% |
| Zogby America Poll [657] | July 12–14, 2007 | John Edwards | 39% | Rudy Giuliani | 41% | Mike Bloomberg | 9% |
| Zogby America Poll [657] | July 12–14, 2007 | John Edwards | 39% | John McCain | 36% | Mike Bloomberg | 11% |
| Zogby America Poll [657] | July 12–14, 2007 | John Edwards | 42% | Fred Thompson | 37% | Mike Bloomberg | 8% |
| Zogby America Poll [657] | July 12–14, 2007 | John Edwards | 43% | Mitt Romney | 31% | Mike Bloomberg | 10% |
| Daily News Poll [658] | July 10–12, 2007 | Hillary Clinton | 40% | Rudy Giuliani | 33% | Michael Bloomberg | 10% |
| USA Today/Gallup Poll [659] | July 6–8, 2007 | Hillary Clinton | 45% | Rudy Giuliani | 39% | Michael Bloomberg | 12% |
| FOX News/Opinion Dynamics Poll [660] | June 26–27, 2007 | Hillary Clinton | 39% | Rudy Giuliani | 37% | Michael Bloomberg | 7% |
| CNN/Opinion Research Corporation Poll [661] | June 22–24, 2007 | Hillary Clinton | 41% | Rudy Giuliani | 38% | Michael Bloomberg | 17% |
| CNN/Opinion Research Corporation Poll [661] | June 22–24, 2007 | Barack Obama | 40% | John McCain | 34% | Michael Bloomberg | 21% |
| Newsweek Poll [662] | June 20–21, 2007 | Hillary Clinton | 46% | Rudy Giuliani | 37% | Michael Bloomberg | 11% |
| Newsweek Poll [662] | June 20–21, 2007 | Hillary Clinton | 48% | Fred Thompson | 33% | Michael Bloomberg | 13% |
| Newsweek Poll [662] | June 20–21, 2007 | Hillary Clinton | 46% | John McCain | 35% | Michael Bloomberg | 13% |
| Newsweek Poll [662] | June 20–21, 2007 | Barack Obama | 44% | Rudy Giuliani | 38% | Michael Bloomberg | 11% |
| Newsweek Poll [662] | June 20–21, 2007 | Barack Obama | 47% | Fred Thompson | 32% | Michael Bloomberg | 14% |
| Newsweek Poll [662] | June 20–21, 2007 | Barack Obama | 46% | John McCain | 35% | Michael Bloomberg | 11% |
| Rasmussen Reports (New Jersey) Poll [663] | June 3, 2007 | Hillary Clinton | 38% | Rudy Giuliani | 29% | Michael Bloomberg | 21% |
| Rasmussen Reports (New Jersey) Poll [663] | June 3, 2007 | Barack Obama | 32% | Fred Thompson | 20% | Michael Bloomberg | 32% |
| Rasmussen Reports (New Jersey) Poll [663] | June 3, 2007 | John Edwards | 34% | Mitt Romney | 18% | Michael Bloomberg | 32% |
| FOX News/Opinion Dynamics Poll [664] | Feb 13–14, 2007 | Hillary Clinton | 40% | Rudy Giuliani | 46% | Ralph Nader | 5% |
| Cook Political Report/RT Strategies Poll [665] | Dec 14–17, 2006 | Hillary Clinton | 37% | Rudy Giuliani | 28% | John McCain | 20% |
| NBC News/Wall Street Journal Poll [666] | Dec 8–11, 2006 | Hillary Clinton | 40% | John McCain | 39% | Michael Bloomberg | 10% |
| WNBC/Marist Poll [667] | Nov 27 – Dec 3, 2006 | Hillary Clinton | 41% | Rudy Giuliani | 45% | Donald Trump | 7% |
| WNBC/Marist Poll [667] | Sep 18–20, 2006 | Hillary Clinton | 39% | Rudy Giuliani | 44% | Michael Bloomberg | 8% |
| Diageo/Hotline Poll [668] | Nov 11–15, 2005 | Hillary Clinton | 34% | Jeb Bush | 18% | John McCain | 40% |
| Diageo/Hotline Poll [668] | Nov 11–15, 2005 | Hillary Clinton | 35% | Condoleezza Rice | 20% | John McCain | 35% |
| Poll Source | Date | Candidate | Support | Consider | Oppose | Never Heard Of | Unsure |
|---|---|---|---|---|---|---|---|
| WNBC/Marist Poll [669] | Feb 12–15, 2007 | Hillary Clinton | 25% | 30% | 43% | 2% | |
| WNBC/Marist Poll [669] | Feb 12–15, 2007 | Barack Obama | 17% | 42% | 32% | 9% | |
| WNBC/Marist Poll [669] | Feb 12–15, 2007 | Al Gore | 12% | 33% | 52% | 3% | |
| WNBC/Marist Poll [669] | Feb 12–15, 2007 | John Edwards | 12% | 45% | 35% | 8% | |
| WNBC/Marist Poll [669] | Feb 12–15, 2007 | Rudy Giuliani | 16% | 51% | 30% | 3% | |
| WNBC/Marist Poll [669] | Feb 12–15, 2007 | John McCain | 14% | 44% | 37% | 5% | |
| WNBC/Marist Poll [669] | Feb 12–15, 2007 | Newt Gingrich | 6% | 25% | 64% | 5% | |
| WNBC/Marist Poll [669] | Feb 12–15, 2007 | Mitt Romney | 7% | 25% | 44% | 24% | |
| FOX News/Opinion Dynamics Poll [660] | Feb 13–14, 2007 | Hillary Clinton | 18% | 34% | 44% | 3% | |
| FOX News/Opinion Dynamics Poll [660] | Feb 13–14, 2007 | Rudy Giuliani | 15% | 44% | 36% | 5% | |
| FOX News/Opinion Dynamics Poll [660] | Feb 13–14, 2007 | Barack Obama | 12% | 45% | 34% | 10% | |
| FOX News/Opinion Dynamics Poll [660] | Feb 13–14, 2007 | John McCain | 9% | 43% | 40% | 8% | |
| FOX News/Opinion Dynamics Poll [660] | Feb 13–14, 2007 | John Edwards | 7% | 39% | 45% | 9% | |
| FOX News/Opinion Dynamics Poll [660] | Feb 13–14, 2007 | Newt Gingrich | 7% | 19% | 64% | 9% | |
| FOX News/Opinion Dynamics Poll [660] | Feb 13–14, 2007 | Ralph Nader | 3% | 14% | 76% | 8% | |
| Newsweek Poll [662] | Nov 9–10, 2006 | Hillary Clinton | 33% | 20% | 45% | 0% | 2% |
| Newsweek Poll [662] | Nov 9–10, 2006 | Rudy Giuliani | 24% | 30% | 32% | 10% | 4% |
| Newsweek Poll [662] | Nov 9–10, 2006 | Condoleezza Rice | 24% | 27% | 43% | 4% | 2% |
| Newsweek Poll [662] | Nov 9–10, 2006 | Al Gore | 21% | 24% | 53% | 0% | 2% |
| Newsweek Poll [662] | Nov 9–10, 2006 | John McCain | 20% | 34% | 32% | 10% | 4% |
| Newsweek Poll [662] | Nov 9–10, 2006 | Barack Obama | 20% | 19% | 24% | 34% | 3% |
| Newsweek Poll [662] | Nov 9–10, 2006 | John Kerry | 16% | 24% | 55% | 2% | 3% |
| Newsweek Poll [662] | Nov 9–10, 2006 | John Edwards | 15% | 28% | 36% | 16% | 5% |
| Newsweek Poll [662] | Nov 9–10, 2006 | Newt Gingrich | 10% | 17% | 58% | 12% | 3% |
| Newsweek Poll [662] | Nov 9–10, 2006 | Joe Biden | 7% | 17% | 34% | 36% | 6% |
| Newsweek Poll [662] | Nov 9–10, 2006 | Mitt Romney | 6% | 13% | 27% | 48% | 6% |
| Newsweek Poll [662] | Nov 9–10, 2006 | Sam Brownback | 3% | 7% | 23% | 61% | 6% |
| Newsweek Poll [662] | Nov 9–10, 2006 | Duncan Hunter | 1% | 6% | 19% | 69% | 5% |
| Time Poll [670] | Oct 3–4, 2006 | Rudy Giuliani | 17% | 55% | 19% | 18% | |
| Time Poll [670] | Oct 3–4, 2006 | Hillary Rodham Clinton | 23% | 36% | 37% | 5% | |
| Time Poll [670] | Oct 3–4, 2006 | John McCain | 12% | 56% | 19% | 13% | |
| Time Poll [670] | Oct 3–4, 2006 | Al Gore | 16% | 44% | 35% | 5% | |
| Time Poll [670] | Oct 3–4, 2006 | John Kerry | 14% | 43% | 34% | 9% | |
| Time Poll [670] | Jul 13–17, 2006 | Rudy Giuliani | 17% | 54% | 14% | 15% | |
| Time Poll [670] | Jul 13–17, 2006 | Hillary Rodham Clinton | 19% | 41% | 34% | 6% | |
| Time Poll [670] | Jul 13–17, 2006 | John McCain | 12% | 52% | 13% | 22% | |
| Time Poll [670] | Jul 13–17, 2006 | Al Gore | 16% | 45% | 32% | 7% | |
| Time Poll [670] | Jul 13–17, 2006 | John Kerry | 12% | 48% | 30% | 10% | |
| CNN Poll [671] | Jun 1–6, 2006 | Hillary Rodham Clinton | 22% | 28% | 47% | 3% | |
| CNN Poll [671] | Jun 1–6, 2006 | Al Gore | 17% | 32% | 48% | 3% | |
| CNN Poll [671] | Jun 1–6, 2006 | John Kerry | 14% | 35% | 47% | 4% | |
| CNN Poll [671] | Jun 1–6, 2006 | Rudolph Giuliani | 19% | 45% | 30% | 6% | |
| CNN Poll [671] | Jun 1–6, 2006 | John McCain | 12% | 48% | 34% | 6% | |
| CNN Poll [671] | Jun 1–6, 2006 | Jeb Bush | 9% | 26% | 63% | 2% | |
| ABC News/Washington Post Poll [672] | May 11–15, 2006 | Hillary Clinton | 19% | 38% | 42% | 1% | |
| ABC News/Washington Post Poll [672] | May 11–15, 2006 | John McCain | 9% | 57% | 28% | 6% | |
| FOX News/Opinion Dynamics Poll [660] | Feb 7–8, 2006 | Hillary Clinton | 35% | 19% | 44% | 2% | |
| FOX News/Opinion Dynamics Poll [660] | Feb 7–8, 2006 | Rudy Giuliani | 33% | 38% | 24% | 6% | |
| FOX News/Opinion Dynamics Poll [660] | Feb 7–8, 2006 | John McCain | 30% | 40% | 22% | 7% | |
| FOX News/Opinion Dynamics Poll [660] | Feb 7–8, 2006 | John Kerry | 29% | 23% | 45% | 3% | |
| FOX News/Opinion Dynamics Poll [660] | Feb 7–8, 2006 | Condoleezza Rice | 14% | 38% | 46% | 3% | |
| CNN/USA Today/Gallup Poll [673] | Jan 20–22, 2006 | Hillary Rodham Clinton | 16% | 32% | 51% | 1% | |
| Diageo/Hotline Poll [674] | Nov 11–15, 2005 | John McCain | 23% | 46% | 15% | 15% | |
| CNN/USA Today/Gallup Poll [673] | May 20–22, 2005 | Hillary Rodham Clinton | 28% | 31% | 40% | 1% | |
| CNN/USA Today/Gallup Poll [673] | Jun 9–10, 2003 | Hillary Rodham Clinton | 20% | 33% | 45% | 2% |
Would you be willing to vote for a female presidential candidate in 2008?
| Poll Source | Date | Yes | No |
|---|---|---|---|
| USA Today/Gallup Poll [675] | Feb 9–11, 2007 | 88% | 11% |
| Times Union/Siena College Poll [676] | Feb 6–9, 2007 | 81% | 12% |
| Newsweek Poll [677] | Dec 6–7, 2006 | 86% | 8% |
| CBS News/New York Times Poll [678] | Jan 20–25, 2006 | 92% | 5% |
| Rasmussen Reports Poll [679] | Apr 6–7, 2005 | 72% | 17% |
Would you be willing to vote for an African American presidential candidate in 2008?
| Poll Source | Date | Yes | No |
|---|---|---|---|
| USA Today/Gallup Poll [675] | Feb 9–11, 2007 | 94% | 5% |
| Rasmussen Reports Poll [680] | Jan 17–18, 2007 | 79% | 12% |
| Newsweek Poll [677] | Dec 6–7, 2006 | 93% | 3% |
Would you be willing to vote for a Mormon (a member of the Church of Jesus Christ of Latter-day Saints) presidential candidate in 2008?
| Poll Source | Date | Yes | No |
|---|---|---|---|
| USA Today/Gallup Poll [675] | Feb 9–11, 2007 | 72% | 24% |
| Newsweek Poll [677] | Dec 6–7, 2006 | 66% | 25% |
| Rasmussen Reports [681] | Nov 20, 2006 | 38% | 43% |
Would you be willing to vote for a Roman Catholic presidential candidate in 2008?
| Poll Source | Date | Yes | No |
|---|---|---|---|
| USA Today/Gallup Poll [675] | Feb 9–11, 2007 | 95% | 4% |
Would you be willing to vote for a Jewish presidential candidate in 2008?
| Poll Source | Date | Yes | No |
|---|---|---|---|
| USA Today/Gallup Poll [675] | Feb 9–11, 2007 | 92% | 7% |
Would you be willing to vote for a Hispanic presidential candidate in 2008?
| Poll Source | Date | Yes | No |
|---|---|---|---|
| USA Today/Gallup Poll [675] | Feb 9–11, 2007 | 87% | 12% |
Would you be willing to vote for a thrice-married candidate in 2008?
| Poll Source | Date | Yes | No |
|---|---|---|---|
| USA Today/Gallup Poll [675] | Feb 9–11, 2007 | 67% | 30% |
| Poll Source | Date | Comfortable | Reservations | Uncomfortable |
|---|---|---|---|---|
| USA Today/Gallup Poll [675] | Feb 9–11, 2007 | 54% | 13% | 30% |
Would you be willing to vote for a seventy-two year old candidate in 2008?
| Poll Source | Date | Yes | No |
|---|---|---|---|
| USA Today/Gallup Poll [675] | Feb 9–11, 2007 | 57% | 42% |
| Poll Source | Date | Comfortable | Reservations | Uncomfortable |
|---|---|---|---|---|
| USA Today/Gallup Poll [675] | Feb 9–11, 2007 | 43% | 15% | 42% |
Would you be willing to vote for a homosexual candidate in 2008?
| Poll Source | Date | Yes | No |
|---|---|---|---|
| USA Today/Gallup Poll [675] | Feb 9–11, 2007 | 55% | 43% |
Would you be willing to vote for an atheist candidate in 2008?
| Poll Source | Date | Yes | No |
|---|---|---|---|
| USA Today/Gallup Poll [675] | Feb 9–11, 2007 | 45% | 53% |
| Poll Source | Date | Candidate | Good | Bad | Unsure |
|---|---|---|---|---|---|
| USA Today/Gallup Poll [659] | Feb 9–11, 2007 | Rudy Giuliani | 65% | 19% | 15% |
| USA Today/Gallup Poll [659] | Feb 9–11, 2007 | Hillary Clinton | 60% | 35% | 5% |
| USA Today/Gallup Poll [659] | Feb 9–11, 2007 | John McCain | 60% | 20% | 20% |
| USA Today/Gallup Poll [659] | Feb 9–11, 2007 | Barack Obama | 53% | 19% | 28% |
Do you think the following candidate is too liberal, too conservative, or about right?
| Poll Source | Date | Candidate | Too Liberal % | Too Conservative % | About Right % | Unsure % |
|---|---|---|---|---|---|---|
| WNBC/Marist Poll [669] | Feb 12–15, 2007 | Rudy Giuliani | 16% | 16% | 51% | 17% |
| WNBC/Marist Poll [669] | Feb 12–15, 2007 | Hillary Clinton | 39% | 6% | 44% | 11% |
{{cite web}}: Missing or empty |title= (help){{cite web}}: |last= has generic name (help)