In order to secure the nomination at the convention, a candidate must receive at least 2,117 votes from delegates (a simple majority of the 4,233 delegate votes, bearing in mind half-votes from Florida, Michigan, Democrats Abroad and the territories of Guam, American Samoa, and the U.S. Virgin Islands).
At the time of Hillary Clinton's suspending her campaign early on June 7, 2008, the superdelegate count was 246½ for her, and 478 for Barack Obama, with 99 still uncommitted[1] of the 823½ total then existing.
The breakdown by position for Clinton: 145 DNC, 52½ Representatives, 14 Senators, 17 add-ons, 10½ Governors, and 7½ DPLs. The breakdown by position for Obama: 229 DNC, 157 Representatives, 34 Senators, 29 add-ons, 20 Governors, and 9 DPLs. The breakdown for uncommitted voters was: 39 DNC, 22 Representatives, 1½ Senators, 32½ add-ons, 1 Governor, and 3 DPLs.
Dodd and Byrd are considered Senators, the DNC lists them as DPL. Rendell is a Governor, the DNC lists him as a DPL.[2]
National summary
The following table summarizes the results of the local contests below, thus providing a nationwide overview of the nomination process. The data contained in the row entitled Total bound pledged delegates is a subset of the data in the row entitled Total estimated pledged delegates. The bound delegates row does not include estimated delegates from contests in which the final allocation depends on the outcome of further caucuses or conventions.
Total estimated pledged delegates[6] (3,409½ of 3,409½, 100% of 81%)
0
1,726½ 49%
1,828½ 51%
4½ <1%
Total bound pledged delegates[7] (3,341½ of 3,409½, 98% of 81%)
0
1,617½ 48%
1,722½ 52%
1½ <1%
Local contests
The following table lists events that determine how many pledged delegates are allocated to each presidential candidate. Most states hold a single event to determine delegate allocation. For example, California's primary on February 5 determined how all 370 of that state's pledged delegates would be apportioned.
Some states, however, hold multiple events to determine delegate allocation. For example, Iowa uses a series of events to award pledged delegates. The precinct caucus held on January 3 provided an estimate of delegates to be awarded at later events, but the estimate changed as a result of the March 15 county conventions. Iowa delegates were not actually allocated to candidates until the district conventions on April 26 (when 29 of 45 delegates were awarded) and the state convention on June 14 (when the remaining 16 were awarded). In states with multiple events, like Iowa, the results for early events show the delegate split as it was projected at that time. The rows for later events show updated projections, and outdated projections are indicated with strikeout. In states with events that apportion some but not all of the state's delegates, both actual and estimated allocations are provided.
This table does not list nomination events that have no effect on the allocation of pledged delegates. For example, it does not list state conventions that determine which persons will fill the role of delegates but not the number of delegates awarded or to whom the delegates are pledged.
Additional notes:
Except where indicated, data comes from the sources referenced at each state's primary or caucus Wikipedia article, available by clicking on a state's name.
For past events, a dash (–) indicates that a candidate was not on the ballot.
AThe delegate numbers in brackets are estimates. Delegates will be officially allocated during later caucuses, primaries, or conventions.
BThese delegations use multiple caucus, primary, or convention processes to choose national delegates on different days. These processes are explained on each state's caucus article.
To re-sort this table, click on the double-arrow symbol () at the top of a column.
Texas state convention (see 3/29) Pledged delegates: 67 (of 193)[B]
–
29
38
–
–
–
–
–
–
June 1–10
Nebraska county conventions Pledged delegates: 0 (of 24)[A][B]
–
–
–
–
–
–
–
–
–
June 12–14
Idaho state convention (2/5 caucus) Pledged delegates: 6 (of 18)[B]
–
–
–
–
–
–
–
–
–
June 14
Iowa state convention (4/26 conv.) Pledged delegates: 16 (of 45)[B]
–
–
–
–
–
–
–
–
–
June 13–15
Washington state convention (5/17 caucus) Pledged delegates: 27 (of 78)[B]
–
–
–
–
–
–
–
–
–
June 21
Puerto Rico commonwealth convention Pledged delegates: 0 (of 55)[B]
–
–
–
–
–
–
–
–
–
June 20–22
Nebraska state convention (2/9 caucus) Pledged delegates: 8 (of 24)[B]
–
–
–
–
–
–
–
–
–
Popular vote
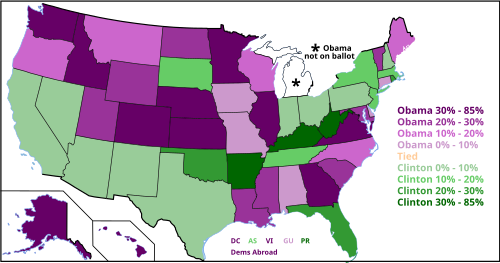
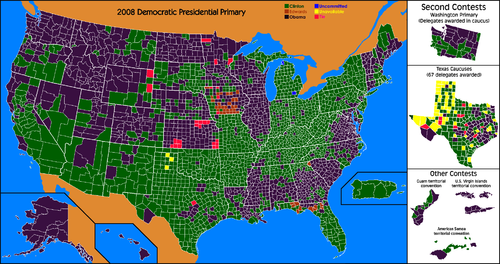
Popular vote margins in the Democratic primaries and caucuses. The darkest purple states voted for Obama by the largest margins, while the darkest green states voted for Clinton by the largest margins. Popular vote winners and delegate winners differ in five states: NH, NV, MO, TX, and GU. (Compare to delegate map.)Popular vote, first-place results by county. Green for Clinton, purple for Obama, orange for Edwards. (First place may be a plurality, less than 50 percent).
'We're winning the popular vote,' Hillary Clinton said last week.... 'More people have voted for me than for anyone who has ever run for the Democratic nomination.' These statements must be read with the sort of close grammatical and definitional care that used to inform her husband’s descriptions of his personal entanglements. They are not quite true in the normal sense, but if made under oath they would not be prosecutable for perjury, either.
This section reports popular vote data for the two leading candidates, Barack Obama and Hillary Clinton. Officially, the popular vote does not matter in the Democratic presidential nomination. However, political experts sometimes look to the popular vote as an indicator of candidate support and momentum. News media frequently report the popular vote on election night, declaring states "won" on this basis. Superdelegates may also consider the popular vote when making their decision about whom to support. Nevertheless, the popular vote count presents many problems and should be interpreted carefully.
After winning West Virginia, the Clinton campaign claimed a lead in the popular vote. However, the math behind this claim relied upon a number of points that were disputed by neutral political observers and by the Obama campaign.[10][11][9][12] Most problematically, the Clinton campaign count gave Clinton 328,309 votes and Obama 0 votes in the disputed Michigan primary as Obama had withdrawn his name from the ballot.
Problems with popular vote metrics
Caucus states
The popular vote is easiest to tally in primary elections, where a simple vote for a candidate is recorded. In caucuses, the "popular vote" is often interpreted as the number of supporters who vote for each candidate at the conclusion of precinct-level caucuses. The table uses the official "popular vote" reported in all primary states and in the caucus states of Alaska, American Samoa, Colorado, Idaho, Minnesota, North Dakota, Nebraska, Hawaii, Wyoming, and Guam. Official numbers were not reported in the caucus states of Iowa, Nevada, Washington, and Maine. These four states have been estimated by RealClearPolitics based on other information released by the states.[13] In Texas, two-thirds of pledged delegates were selected through a primary, while one-third were selected through caucuses. However, voters were eligible to participate in the caucuses only if they also voted in the primary, so RealClearPolitics used the primary results and ignored the caucus in determining the popular vote.
Nationwide, the RealClearPolitics tally counted one caucus participant as equal to one primary participant. However, turnout is generally lower in caucuses, and as a result, the popular vote may overweight the influence of primary states.[14] For example, Hawaii and Rhode Island have similar populations, but the opinion of Rhode Islanders is weighted more heavily in the popular vote total. Clinton won the Rhode Island primary 58-40% and received 33,600 more votes than Obama. In contrast, Obama won the Hawaii caucuses 76-24%, but received only 19,500 more votes than Clinton.[13] Thus, some researchers argue that the popular vote underestimates the depth of Obama's support in caucus states.[15] If these states were to hold primaries and Obama were to win by a similar margin, his popular vote total would be considerably higher.[15] However, Clinton argued that she would have done better in these states if primaries were held.[16]
Florida and Michigan
Florida and Michigan were penalized by the Democratic party, and under the rules as they existed at the time of the elections, the delegates were not to be seated at the Democratic Convention. Toward the end of the primary season, on May 31, the Democratic National Committee restored "half votes" to the disputed primaries, as well as accepting a reapportionment of Michigan delegates proposed by the state party.
In Florida, where both candidates pledged not to campaign, Clinton beat Obama 50-33% in the disputed primary. In Michigan, where Obama and other candidates removed their name from the ballot, Clinton won against "Uncommitted" 55-40%. Exit poll respondents said that if all candidates had been on the ballot, they would have voted 46% Clinton, 35% Obama, 12% Edwards, 3% other.[17] These results do not record the preferences of voters who chose to stay home, believing that their votes would not count.
The Clinton campaign argued that popular vote totals should include Florida and Michigan and that Obama should receive 0 votes in Michigan.[9] Obama's supporters, and some neutral observers, countered that his standing would have improved in these states if the race had been contested normally and that most or all of the "uncommitted" votes in Michigan should be counted as votes for him.[12] Obama argued that the nullified primaries do not represent a true test of popular support, noting that primaries where the candidates are not allowed to campaign amount to little more than a "referendum on name recognition".[18]
Nomination rules
Finally, the nomination was decided by delegates under the Democratic Party's rules, so the candidates campaigned to maximize their delegate advantage. If the nomination were decided by popular vote, they likely would have campaigned differently, in order to run up the vote in populous states like New York and Illinois. House Speaker Nancy Pelosi has said that the popular vote should have no effect under the current rules: "It’s a delegate race. The way the system works is that the delegates choose the nominee."[19] Obama's chief strategist suggested that the Clinton campaign's focus on the popular vote was a distraction tactic: "When they started off, it was all about delegates.... Now that we have more delegates, it’s all about the popular vote. And if that does not work out, they will probably challenge us to a game of cribbage to choose the nominee."[19] Nevertheless, polls have shown that a plurality of Democrats think superdelegates should consider the popular vote when deciding which candidate to support.[20]
Popular vote table
The table below presents various combinations of the "popular vote," accounting for some, but not all, of the problems noted above. The source for the popular vote totals in each state is RealClearPolitics,[13] which aggregates data from official state results and news sources. Not all combinations are reported, only those most commonly cited as popular vote estimates. For example, the table does not reflect exit poll findings on how many voters would have voted for Obama had Obama's name been on the Michigan ballot, since there are many ways to generate this estimate.
In all graphs below, purple represents Obama, green represents Clinton, and orange represents Edwards. Yellow represents a tie.
Pledged delegate margins by state. Obama won the delegate count in the darkest purple states by the largest margins, while Clinton won the delegate count in the darkest green states by the largest margins. They tied in MO, NH, and GU. (Compare to popular vote map.)
Pledged delegates awarded in the Democratic primaries. Clinton won several larger states, while Obama established the delegate lead by winning more smaller and caucus states and winning his states by a greater average margin. States arranged by delegate "winner", with Clinton's states above and Obama's below.
Pledged delegates awarded in the Democratic primaries. Clinton won several larger states, while Obama established the delegate lead by winning more total states and winning his states by a greater average margin. States are arranged geographically.
1 2 Except where noted otherwise, this column displays the number of delegates who have voted as uncommitted, not the number of potential delegates that have yet to be selected in future primaries or caucuses.
↑ Sum of estimated delegates in each contest in the table.
↑ Sum of bound delegates in each contest in the table.
↑ All of Nevada's county conventions took place on February 23, but one county's convention (Clark County) had attendance that overwhelmed its ability to continue. That convention was therefore recessed to April 12.
1 2 3 Hertzberg, Henrik (June 2, 2008). "Memory Lapse". The New Yorker. Retrieved May 27, 2008.
↑ The official popular vote numbers reported in all primary contests and in the caucus contests of Alaska, American Samoa, Colorado, Idaho, Minnesota, North Dakota, Nebraska, Hawaii, Wyoming, and Guam are included in all rows of this table. However, the official popular vote was not reported in IA, NV, WA, ME, and so RealClearPolitics estimated the popular vote in these states based on other figures. This column provides two options: Include those four states or don't include those four states. All other contests are always included.
This page is based on this Wikipedia article Text is available under the CC BY-SA 4.0 license; additional terms may apply. Images, videos and audio are available under their respective licenses.