1948 Democratic Party presidential primaries

Last updated

1948 Democratic Party presidential primaries
Flag of the United States (1912-1959).svg
  1944 March 9–June 1, 1948 1952  
  Harry S Truman, bw half-length photo portrait, facing front, 1945 (cropped).jpg NOTA Option Logo 3x4.svg General of the Army Dwight D. Eisenhower 1947.jpg
Candidate Harry S. Truman Uncommitted Dwight D. Eisenhower
Home state Missouri New York
Contests won860
Popular vote1,375,452653,5099,502
Percentage63.9%30.4%1.3%

1948 Democratic Party presidential primaries.svg
First place by popular vote

Previous Democratic nominee

Franklin D. Roosevelt

Democratic nominee

Harry S. Truman

From March 9 to June 1, 1948, presidential primaries were organized by the Democratic Party to select delegates to the 1948 Democratic National Convention, to determine the party's nominee for president in the 1948 United States presidential election. The elections took place in 14 states where delegates were chosen in primary elections. [1]

Contents

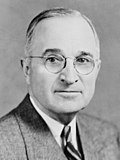
Incumbent president Harry S. Truman won eight contests, while uncommitted delegates won the remaining six. Truman was ultimately nominated for re-election at the Democratic National Convention in Philadelphia. [2]

Delegates per state

StateDelegates [3] Primary date
New Hampshire 12March 9
New York 98April 6
Wisconsin 24April 6
Illinois 60April 13
Nebraska 12April 13
New Jersey 36April 20
Massachusetts 36April 27
Pennsylvania 74April 27
Maryland 20May 3
Alabama 26May 4
Florida 20May 4
Ohio 50May 4
West Virginia 20May 11
Oregon 16May 21
California 54June 1
South Dakota 8June 1

Contests

DateContestPopular vote [2]
Truman Uncommitted Eisenhower Wallace Stassen MacArthur Lucas Others
March 9New Hampshire4,409
(100.0%)
April 6Wisconsin25,415
(83.8%)
4,906
(16.2%)
April 13Illinois16,299
(81.7%)
1,709
(8.6%)
427
(2.1%)
1,513
(7.6%)
Nebraska67,672
(98.7%)
894
(1.3%)
April 20New Jersey1,100
(92.5%)
87
(7.3%)
2
(0.2%)
April 27Massachusetts51,207
(100.0%)
Pennsylvania328,891
(96.0%)
4,502
(1.3%)
4,329
(1.3%)
1,301
(0.4%)
1,220
(0.4%)
2,409
(0.7%)
May 4Alabama161,629
(100.0%)
Florida92,169
(100.0%)
Ohio271,146
(100.0%)
May 11West Virginia157,102
(100.0%)
May 21Oregon112,962
(93.8)
7,436 (6.2%)
June 1California811,920
(100.0%)
South Dakota11,193
(58.3%)
8,016
(41.6%)
TOTAL1,375,452
(63.9%)
653,509
(30.4%)
6,211
(0.3%)
4,416
(0.2%)
1,301
(0.1%)
1,220
(0.1%)
427
(0.0%)
109,329
(5.1%)

See also

Notes

  1. Congressional Quarterly 1985, pp. 406–7.
  2. 1 2 Congressional Quarterly 1985, pp. 406–7; Kalb 2016, pp. 417–18.
  3. McNickle, R. K; Patch, B. W. (January 14, 1948). "Presidential Primaries". CQ Press. Retrieved February 22, 2022.

Bibliography