From January 3 to June 3, 2008, voters of the Republican Party chose their nominee for president in the 2008 United States presidential election. Senator John McCain of Arizona was selected as the nominee through a series of primary elections and caucuses culminating in the 2008 Republican National Convention held from Monday, September 1, through Thursday, September 4, 2008, in Saint Paul, Minnesota. President George W. Bush was ineligible to be elected to a third term due to the term limits established by the 22nd Amendment.
This article lists statewide public opinion polls conducted relating to the 2008 Republican Party presidential primaries, typically using standard statistical methodology.
This article contains the results of the 2008 Republican presidential primaries and caucuses.

The 2008 Oklahoma Republican presidential primary was held on February 5, with 41 delegates at stake. It was a closed primary, meaning only registered Republicans could vote in the election. The primary was on Super Tuesday on the same day as twenty-three other states. John McCain won Oklahoma's primary with 37% of the vote, although Mike Huckabee picked up some delegate votes as well by receiving 33% of the vote.

The 2008 California Republican presidential primary was held on February 5, 2008, with a total of 173 national delegates at stake.

The 2008 Minnesota Democratic presidential caucuses took place on Super Tuesday, February 5, 2008 with 78 delegates at stake. The winner in each of Minnesota's eight congressional districts was awarded all of that district's delegates, totaling 47. Another 25 delegates were awarded to the statewide winner, Barack Obama. The 72 delegates represented Minnesota at the Democratic National Convention in Denver, Colorado. Sixteen other unpledged delegates, known as superdelegates, also attended the convention and cast their votes as well.

The 2008 United States presidential election in California took place on November 4, 2008, in California as part of the 2008 United States presidential election. Voters chose 55 electors, the most out of any of the 50 states, to the Electoral College, who voted for president and vice president.

The 2008 Texas Democratic presidential primary and caucuses were a series of events to determine the delegates that the Texas Democratic Party sent to the 2008 Democratic National Convention. Delegates were selected using results from two sources: the Texas Presidential Primary held on March 4 by the Secretary of State of Texas's office, and a series of caucus events held between March 4 and June 7 by the Texas Democratic Party. The indecisive results of Super Tuesday, and the fact that Texas had the largest number of delegates among the states remaining on the Democratic primary calendar, resulted in the Texas primary receiving significant attention from both the Hillary Clinton and Barack Obama campaigns.

From January 3 to June 5, 2012, voters of the Democratic Party chose its nominee for president in the 2012 United States presidential election. President Barack Obama won the Democratic Party nomination by securing more than the required 2,383 delegates on April 3, 2012, after a series of primary elections and caucuses. He was formally nominated by the 2012 Democratic National Convention on September 5, 2012, in Charlotte, North Carolina.

This article contains the results of the 2012 Republican presidential primaries and caucuses, which resulted in the nomination of Mitt Romney as the Republican nominee for President of the United States. The 2012 Republican primaries were the selection processes by which the Republican Party selected delegates to attend the 2012 Republican National Convention from August 27–30. The series of primaries, caucuses, and state conventions culminated in the national convention, where the delegates cast their votes to formally select a candidate. A simple majority (1,144) of the total delegate votes (2,286) was required to become the party's nominee.

The 2012 United States presidential election in Connecticut took place on November 6, 2012, as part of the 2012 United States presidential election in which all 50 states plus the District of Columbia participated. Connecticut voters chose seven electors to represent them in the Electoral College via a popular vote pitting incumbent Democratic President Barack Obama and his running mate, Vice President Joe Biden, against Republican challenger and former Massachusetts Governor Mitt Romney and his running mate, Congressman Paul Ryan. Obama and Biden carried Connecticut with 58.1% of the popular vote to Romney's and Ryan's 40.7%, thus winning the state's seven electoral votes. Romney managed to flip the traditionally Republican Litchfield County, which Obama had won in 2008. As of the 2020 United States presidential election, this was the last election that the Democratic presidential nominee won Windham County.

The 2012 United States presidential election in Missouri took place on November 6, 2012, as part of the 2012 United States presidential election, in which all 50 states plus the District of Columbia participated. Missouri voters chose 10 electors to represent them in the Electoral College via a popular vote pitting incumbent Democratic President Barack Obama and his running mate, Vice President Joe Biden, against Republican challenger and former Massachusetts Governor Mitt Romney and his running mate, Congressman Paul Ryan.

The 2012 United States presidential election in North Carolina took place on November 6, 2012, as part of the 2012 general election in which all 50 states plus the District of Columbia participated. North Carolina voters chose 15 electors to represent them in the Electoral College via a popular vote pitting incumbent Democratic President Barack Obama and his running mate, Vice President Joe Biden, against Republican challenger and former Massachusetts Governor Mitt Romney and his running mate, Congressman Paul Ryan.

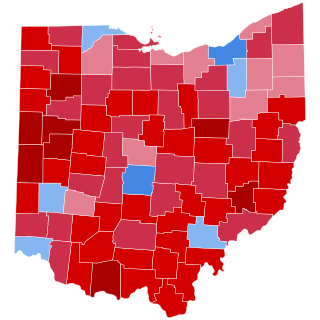
The 2020 United States presidential election in Ohio was held on Tuesday, November 3, 2020, as part of the 2020 United States presidential election in which all 50 states plus the District of Columbia participated. Ohio voters chose electors to represent them in the Electoral College via a popular vote, pitting the Republican Party's nominee—incumbent President Donald Trump and his running mate, Vice President Mike Pence—against the Democratic Party nominee, former Vice President Joe Biden and his running mate, California Senator Kamala Harris. Ohio had 18 electoral votes in the Electoral College.

The 2020 United States presidential election in Tennessee was held on Tuesday, November 3, 2020, as part of the 2020 United States presidential election in which all 50 states plus the District of Columbia participated. Tennessee voters chose electors to represent them in the Electoral College via a popular vote, pitting the Republican Party's nominee, incumbent President Donald Trump, and running mate Vice President Mike Pence against Democratic Party nominee, former Vice President Joe Biden, and his running mate California Senator Kamala Harris. Tennessee has 11 electoral votes in the Electoral College.

The 2020 United States presidential election in Montana was held on Tuesday, November 3, 2020, as part of the 2020 United States presidential election in which all 50 states plus the District of Columbia participated. Montana voters chose electors to represent them in the Electoral College via a popular vote, pitting the Republican Party's nominee, incumbent President Donald Trump and running mate Vice President Mike Pence, against Democratic Party nominee, former Vice President Joe Biden, and his running mate California Senator Kamala Harris. Montana had three electoral votes in the Electoral College for the 2020 election.

The 2020 Missouri Democratic presidential primary took place on March 10, 2020, as one of several states voting the week after Super Tuesday in the Democratic Party primaries for the 2020 presidential election. The Missouri primary was an open primary, with the state awarding 79 delegates towards the 2020 Democratic National Convention, of which 68 were pledged delegates allocated on the basis of the results of the primary.

The 2012 Libertarian Party presidential primaries allowed voters to indicate non-binding preferences for the Libertarian Party's presidential candidate. These differed from the Republican or Democratic presidential primaries and caucuses in that they did not appoint delegates to represent a candidate at the party's convention to select the party's nominee for the United States presidential election. The party's nominee for the 2012 presidential election was chosen directly by registered delegates at the 2012 Libertarian National Convention, which ran from May 2 to 6, 2012. The delegates nominated former New Mexico Governor Gary Johnson for President and former judge Jim Gray for Vice President.

The 2008 Libertarian Party presidential primaries allowed voters to indicate non-binding preferences for the Libertarian Party's presidential candidate. These differed from the Republican or Democratic presidential primaries and caucuses in that they did not appoint delegates to represent a candidate at the party's convention to select the party's nominee for the United States presidential election. The party's nominee for the 2008 presidential election was chosen directly by registered delegates at the 2008 Libertarian National Convention, which ran from May 22 to 26, 2008. The delegates nominated former congressman Bob Barr for president and media personality Wayne Allyn Root for vice president.

The 2004 Libertarian Party presidential primaries allowed voters to indicate non-binding preferences for the Libertarian Party's presidential candidate. These differed from the Republican or Democratic presidential primaries and caucuses in that they did not appoint delegates to represent a candidate at the party's convention to select the party's nominee for the United States presidential election. The party's nominee for the 2004 presidential election was chosen directly by registered delegates at the 2004 Libertarian National Convention, which ran from May 28 to 31, 2008. The delegates nominated Michael Badnarik for president and Richard Campagna for vice president.


