Chariton County, Missouri

Last updated

Chariton County
Chariton County Missouri courthouse 20151004-127.jpg
The Chariton County Courthouse in Keytesville
Map of Missouri highlighting Chariton County.svg
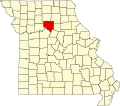
Location within the U.S. state of Missouri
Missouri in United States.svg
Missouri's location within the U.S.
Coordinates: 39°31′N92°58′W / 39.52°N 92.96°W / 39.52; -92.96
CountryFlag of the United States.svg United States
StateFlag of Missouri.svg Missouri
FoundedNovember 16, 1820
Named after The Chariton River
Seat Keytesville
Largest city Salisbury
Area
  Total
767 sq mi (1,990 km2)
  Land751 sq mi (1,950 km2)
  Water16 sq mi (40 km2)  2.0%
Population
 (2020)
  Total
7,408
  Density9.7/sq mi (3.7/km2)
Time zone UTC−6 (Central)
  Summer (DST) UTC−5 (CDT)
Congressional district 6th
Website https://www.charitonco.com/

Chariton County is a county located in the north-central portion of the U.S. state of Missouri. As of the 2020 census, the population was 7,408. [1] Its county seat is Keytesville. [2] The county was organized November 16, 1820, from part of Howard County and is named for the Chariton River.

Contents

History

The second Chariton County Courthouse 1867-1973. It replaced one destroyed by Confederate raiders in September 1864. CharitonCoCourthouse.JPG
The second Chariton County Courthouse 1867–1973. It replaced one destroyed by Confederate raiders in September 1864.

Chariton County was settled primarily from the states of the Upper South, especially Kentucky and Tennessee. They brought slaves and slaveholding traditions with them, and they quickly started cultivating crops similar to those in Middle Tennessee and Kentucky: hemp and tobacco. Chariton was one of several counties settled mostly by southerners to the north and south of the Missouri River. Given their culture and traditions, this area became known as Little Dixie and Chariton County was at its heart. It was heavily pro-Confederate during the American Civil War. [3]

Geography

According to the U.S. Census Bureau, the county has a total area of 767 square miles (1,990 km2), of which 751 square miles (1,950 km2) is land and 16 square miles (41 km2) (2.0%) is water. [4]

Adjacent counties

Major highways

National protected area

Demographics

Historical population
CensusPop.Note
1830 1,780
1840 4,746166.6%
1850 7,51458.3%
1860 12,56267.2%
1870 19,13652.3%
1880 25,22431.8%
1890 26,2544.1%
1900 26,8262.2%
1910 23,503−12.4%
1920 21,769−7.4%
1930 19,588−10.0%
1940 18,084−7.7%
1950 14,944−17.4%
1960 12,720−14.9%
1970 11,084−12.9%
1980 10,489−5.4%
1990 9,202−12.3%
2000 8,438−8.3%
2010 7,831−7.2%
2020 7,408−5.4%
U.S. Decennial Census [5]
1790-1960 [6] 1900-1990 [7]
1990-2000 [8] 2010-2015 [9]

As of the census [10] of 2000, there were 8,438 people, 3,469 households, and 2,345 families residing in the county. The population density was 11 people per square mile (4.2 people/km2). There were 4,250 housing units at an average density of 6 units per square mile (2.3/km2). The racial makeup of the county was 95.99% White, 3.19% Black or African American, 0.17% Native American, 0.13% Asian, 0.11% from other races, and 0.41% from two or more races. Approximately 0.56% of the population were Hispanic or Latino of any race. 38.8% were of German, 25.5% American, 9.7% English and 7.8% Irish ancestry.

There were 3,469 households, out of which 28.40% had children under the age of 18 living with them, 58.30% were married couples living together, 6.50% had a female householder with no husband present, and 32.40% were non-families. 29.80% of all households were made up of individuals, and 17.30% had someone living alone who was 65 years of age or older. The average household size was 2.38 and the average family size was 2.94.

In the county, the population was spread out, with 23.70% under the age of 18, 6.50% from 18 to 24, 23.70% from 25 to 44, 23.80% from 45 to 64, and 22.30% who were 65 years of age or older. The median age was 42 years. For every 100 females there were 91.90 males. For every 100 females age 18 and over, there were 91.30 males.

The median income for a household in the county was $32,285, and the median income for a family was $39,176. Males had a median income of $25,263 versus $19,068 for females. The per capita income for the county was $15,515. About 8.80% of families and 11.60% of the population were below the poverty line, including 11.40% of those under age 18 and 14.00% of those age 65 or over.

2020 Census

Chariton County Racial Composition [11]
RaceNum.Perc.
White (NH)6,92593.5%
Black or African American (NH)1442%
Native American (NH)150.2%
Asian (NH)30.04%
Pacific Islander (NH)30.04%
Other/Mixed (NH)2173%
Hispanic or Latino 1011.36%

Education

Public schools

School districts include: [12]

Private schools

Public libraries

Communities

Cities and Towns

Census-designated place

Unincorporated Communities

Notable people

Politics

Local

Chariton County, Missouri
Elected countywide officials
Assessor Darrin E. Gladbach Democratic
Circuit Clerk Eric Stallo Democratic
County Clerk Mitzi Schuchmann Republican
Collector Darlene Shipp Democratic
Commissioner
(presiding)
Evan Emmerich Republican
Commissioner
(district 1)
Jared Meyer Republican
Commissioner
(district 2)
Terry Milford Republican
Coroner Nyle Bowyer Republican
Prosecuting Attorney Cliff Thornburg Democratic
Public Administrator Brenda Bennett Republican
Recorder Eric Stallo Democratic
Sheriff Erick Billups Republican
Treasurer Darlene Shipp Democratic

State

Past Gubernatorial Elections Results
Year Republican Democratic Third Parties
2024 77.58%3,13120.61% 8321.83% 73
2020 76.13%3,10022.35% 9101.52% 62
2016 59.61%2,36438.40% 1,5231.99% 79
2012 46.59% 1,77050.99%1,9372.42% 92
2008 46.54% 1,95151.67%2,1661.79% 75
2004 54.32%2,35044.87% 1,9410.81% 35
2000 48.47% 1,99850.39%2,0771.14% 47
1996 33.31% 1,32665.16%2,5941.53% 61

Chariton County is split between two districts in the Missouri House of Representatives, with both electing Republicans.

Missouri House of Representatives — District 39 — Chariton County (2016)
PartyCandidateVotes%±%
Republican Joe Don McGaugh2,507100.00%
Missouri House of Representatives — District 39 — Chariton County (2014)
PartyCandidateVotes%±%
Republican Joe Don McGaugh1,420100.00%+45.73
Missouri House of Representatives — District 39 — Chariton County (2012)
PartyCandidateVotes%±%
Republican Joe Don McHaugh1,56254.27%
Democratic Will Talbert1,31645.73%
Missouri House of Representatives — District 48 — Chariton County (2016)
PartyCandidateVotes%±%
Republican Dave Muntzel67681.06%−18.94
Independent Debra Dilks15818.94%
Missouri House of Representatives — District 48 — Chariton County (2014)
PartyCandidateVotes%±%
Republican Dave Muntzel401100.00%+51.07
Missouri House of Representatives — District 48 — Chariton County (2012)
PartyCandidateVotes%±%
Republican Dave Muntzel41348.93%
Democratic Ron Monnig43151.07%

All of Chariton County is a part of Missouri's 18th District in the Missouri Senate and is currently represented by Cindy O'Laughlin (R-Shelbina).

Missouri Senate — District 18 — Chariton County (2014)
PartyCandidateVotes%±%
Republican Brian Munzlinger1,781100.00%

Federal

U.S. Senate — Missouri — Chariton County (2016)
PartyCandidateVotes%±%
Republican Roy Blunt2,32258.64%+13.93
Democratic Jason Kander1,46536.99%−12.11
Libertarian Jonathan Dine942.37%−3.82
Green Johnathan McFarland350.88%+0.88
Constitution Fred Ryman441.11%+1.11
U.S. Senate — Missouri — Chariton County (2012)
PartyCandidateVotes%±%
Republican Todd Akin1,69044.71%
Democratic Claire McCaskill1,85649.10%
Libertarian Jonathan Dine2346.19%

All of Chariton County is included in Missouri's 6th Congressional District and is currently represented by Sam Graves (R-Tarkio) in the U.S. House of Representatives.

U.S. House of Representatives – Missouri’s 6th Congressional District – Chariton County (2016)
PartyCandidateVotes%±%
Republican Sam Graves2,88974.17%+3.56
Democratic David M. Blackwell89422.95−2.32
Libertarian Russ Lee Monchil721.85%−2.27
Green Mike Diel401.03%+1.03
U.S. House of Representatives — Missouri's 6th Congressional District — Chariton County (2014)
PartyCandidateVotes%±%
Republican Sam Graves1,64370.61%+2.53
Democratic Bill Hedge58825.27%−4.78
Libertarian Russ Lee Monchil964.12%+2.25
U.S. House of Representatives — Missouri's 6th Congressional District — Chariton County (2012)
PartyCandidateVotes%±%
Republican Sam Graves2,54668.08%
Democratic Kyle Yarber1,12430.05%
Libertarian Russ Lee Monchil701.87%
United States presidential election results for Chariton County, Missouri [16]
Year Republican Democratic Third party(ies)
No.%No.%No.%
1888 2,34539.71%3,45258.45%1091.85%
1892 2,05735.98%3,46360.57%1973.45%
1896 2,35935.21%4,32164.49%200.30%
1900 2,13835.27%3,82863.16%951.57%
1904 2,06439.39%3,05858.36%1182.25%
1908 2,24939.78%3,35259.30%520.92%
1912 1,52827.94%3,11256.90%82915.16%
1916 2,18340.60%3,13558.30%591.10%
1920 4,33147.68%4,67551.46%780.86%
1924 3,17338.72%4,79558.52%2262.76%
1928 3,92946.22%4,55953.63%130.15%
1932 1,83524.91%5,49874.63%340.46%
1936 3,43338.33%5,49061.29%340.38%
1940 4,43946.74%5,05353.21%50.05%
1944 3,80249.12%3,93050.78%80.10%
1948 2,61538.51%4,17061.40%60.09%
1952 3,88350.91%3,73048.91%140.18%
1956 3,45948.51%3,67151.49%00.00%
1960 3,10246.63%3,55053.37%00.00%
1964 1,93233.34%3,86266.66%00.00%
1968 2,40445.50%2,37144.87%5099.63%
1972 2,81258.45%1,99941.55%00.00%
1976 2,12840.89%3,05558.70%210.40%
1980 2,64153.11%2,25045.24%821.65%
1984 2,74455.01%2,24444.99%00.00%
1988 2,19348.14%2,34751.53%150.33%
1992 1,37829.95%2,14146.53%1,08223.52%
1996 1,50837.40%2,07251.39%45211.21%
2000 2,30055.37%1,79243.14%621.49%
2004 2,42155.78%1,89243.59%270.62%
2008 2,33955.51%1,79942.69%761.80%
2012 2,40262.86%1,33935.04%802.09%
2016 2,95074.33%88822.37%1313.30%
2020 3,11176.31%91622.47%501.23%
2024 3,17977.75%87521.40%350.86%

Missouri presidential preference primary (2008)

Former U.S. Senator Hillary Clinton (D-New York) received more votes, a total of 786, than any candidate from either party in Chariton County during the 2008 presidential primary. She also received more votes than the total number of votes cast in the entire Republican primary in Chariton County.

See also

References

  1. "Explore Census Data". data.census.gov. Retrieved December 21, 2021.
  2. "Find a County". National Association of Counties. Archived from the original on May 31, 2011. Retrieved June 7, 2011.
  3. "The Story of Little Dixie, Missouri" Archived July 17, 2012, at the Wayback Machine , Missouri Division - Sons of Confederate Veterans, accessed June 3, 2008
  4. "2010 Census Gazetteer Files". United States Census Bureau. August 22, 2012. Archived from the original on October 21, 2013. Retrieved November 14, 2014.
  5. "U.S. Decennial Census". United States Census Bureau. Retrieved November 14, 2014.
  6. "Historical Census Browser". University of Virginia Library. Archived from the original on August 11, 2012. Retrieved November 14, 2014.
  7. "Population of Counties by Decennial Census: 1900 to 1990". United States Census Bureau. Retrieved November 14, 2014.
  8. "Census 2000 PHC-T-4. Ranking Tables for Counties: 1990 and 2000" (PDF). United States Census Bureau. Archived (PDF) from the original on March 27, 2010. Retrieved November 14, 2014.
  9. "State & County QuickFacts". United States Census Bureau. Archived from the original on September 5, 2015. Retrieved September 7, 2013.
  10. "U.S. Census website". United States Census Bureau . Retrieved May 14, 2011.
  11. "P2 HISPANIC OR LATINO, AND NOT HISPANIC OR LATINO BY RACE – 2020: DEC Redistricting Data (PL 94-171) – Chariton County, Missouri".
  12. "2020 CENSUS - SCHOOL DISTRICT REFERENCE MAP: Chariton County, MO" (PDF). U.S. Census Bureau . Retrieved October 14, 2024. - Text list
  13. Breeding, Marshall. "Brunswick Area Library". Libraries.org. Retrieved May 8, 2017.
  14. Breeding, Marshall. "Dulany Memorial Library". Libraries.org. Retrieved May 8, 2017.
  15. Breeding, Marshall. "Keytesville Public Library". Libraries.org. Retrieved May 8, 2017.
  16. Leip, David. "Dave Leip's Atlas of U.S. Presidential Elections". uselectionatlas.org. Retrieved March 24, 2018.

Further reading

39°31′N92°58′W / 39.52°N 92.96°W / 39.52; -92.96