St. Clair County, Missouri

Last updated

St. Clair County
St Clair County Missouri courthouse 20191026-6924.jpg
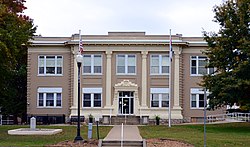
St. Clair County courthouse in Osceola
Map of Missouri highlighting St. Clair County.svg
Location within the U.S. state of Missouri
Missouri in United States.svg
Missouri's location within the U.S.
Coordinates: 38°02′N93°46′W / 38.04°N 93.77°W / 38.04; -93.77
CountryFlag of the United States.svg United States
StateFlag of Missouri.svg  Missouri
FoundedJanuary 29, 1841
Named after Arthur St. Clair
Seat Osceola
Largest city Appleton City
Area
  Total
702 sq mi (1,820 km2)
  Land670 sq mi (1,700 km2)
  Water32 sq mi (80 km2)  4.6%
Population
 (2020)
  Total
9,284
  Estimate 
(2024) [1]
9,848 Increase2.svg
  Density14.7/sq mi (5.7/km2)
Time zone UTC−6 (Central)
  Summer (DST) UTC−5 (CDT)
Congressional district 4th
Website www.stclaircomo.com

St. Clair County is a county located in the western portion of the U.S. state of Missouri. As of the 2020 census, the population was 9,284. [2] Its county seat is Osceola. [3] The largest city is Appleton City. The county was organized in 1841 and named after General Arthur St. Clair, Governor of the Northwest Territory. [4] St. Clair was also the 9th president of the United States in Congress Assembled. Under his presidency, the Northwest Ordinance and United States Constitution were passed. [5]

Contents

According to the April 1907 issue of The Century Magazine , for well over 30 years (dating from 1870) St. Clair County was in open rebellion against the U.S. Government, refusing to pay interest on bonds which it had issued to assist in the building of a railroad, which was never built.

Geography

According to the U.S. Census Bureau, the county has a total area of 702 square miles (1,820 km2), of which 670 square miles (1,700 km2) is land and 32 square miles (83 km2) (4.6%) is water. [6]

Adjacent counties

Major highways

Transit

Demographics

Historical population
CensusPop.Note
1850 3,556
1860 6,81291.6%
1870 6,742−1.0%
1880 14,125109.5%
1890 16,74718.6%
1900 17,9076.9%
1910 16,412−8.3%
1920 15,341−6.5%
1930 13,289−13.4%
1940 13,146−1.1%
1950 10,482−20.3%
1960 8,421−19.7%
1970 7,667−9.0%
1980 8,62212.5%
1990 8,457−1.9%
2000 9,65214.1%
2010 9,8051.6%
2020 9,284−5.3%
2024 (est.)9,8486.1%
U.S. Decennial Census [7]
1790–1960 [8] 1900–1990 [9]
1990–2000 [10] 2010–2015 [11] 2024 [1]

As of the census [12] of 2000, there were 9,652 people, 4,040 households, and 2,791 families residing in the county. The population density was 14 people per square mile (5.4 people/km2). There were 5,205 housing units at an average density of 8 units per square mile (3.1/km2). The racial makeup of the county was 97.36% White, 0.23% Black or African American, 0.75% Native American, 0.15% Asian, 0.02% Pacific Islander, 0.29% from other races, and 1.21% from two or more races. Approximately 0.98% of the population were Hispanic or Latino of any race.

There were 4,040 households, out of which 26.30% had children under the age of 18 living with them, 57.60% were married couples living together, 7.70% had a female householder with no husband present, and 30.90% were non-families. 27.40% of all households were made up of individuals, and 14.80% had someone living alone who was 65 years of age or older. The average household size was 2.34 and the average family size was 2.83.

In the county, the population was spread out, with 23.00% under the age of 18, 5.60% from 18 to 24, 22.90% from 25 to 44, 27.20% from 45 to 64, and 21.30% who were 65 years of age or older. The median age was 44 years. For every 100 females there were 98.60 males. For every 100 females age 18 and over, there were 94.30 males.

The median income for a household in the county was $25,321, and the median income for a family was $31,498. Males had a median income of $23,231 versus $18,351 for females. The per capita income for the county was $14,025. About 16.20% of families and 19.60% of the population were below the poverty line, including 25.30% of those under age 18 and 17.60% of those age 65 or over.

2020 Census

St. Clair County Racial Composition [13]
RaceNum.Perc.
White (NH)8,56792.3%
Black or African American (NH)260.3%
Native American (NH)630.67%
Asian (NH)190.2%
Pacific Islander (NH)70.08%
Other/Mixed (NH)4244.57%
Hispanic or Latino 1782%

Education

Public schools

Public libraries

Communities

Cities

Villages

Unincorporated communities

Townships

St. Clair County is divided into 16 townships:

Politics

Local

The Republican Party predominantly controls politics at the local level in St. Clair County.

St. Clair County, Missouri
Elected countywide officials
Assessor Gladys J. Smith Democratic
Circuit Clerk Karen Hubbard Democratic
County Clerk Debbie Peden Democratic
Collector Sharon K. Foster Democratic
Commissioner
(Presiding)
Robert Salmon Republican
Commissioner
(District 1)
Leroy D. Strope Republican
Commissioner
(District 2)
Gerald R. Williams Republican
Coroner C. Randy Shelton Republican
Prosecuting Attorney Joleene V. Wood Democratic
Public Administrator Laurie Stinnett Republican
Recorder Pat Speight Terry Democratic
Sheriff Lee Hilty Republican
Surveyor Gary Phillips Democratic
Treasurer Rhonda Shelby Republican

State

Past gubernatorial elections results
Year Republican Democratic Third Parties
2024 78.01%3,88720.11% 1,0021.88% 94
2020 78.01%3,88020.00% 9951.99% 99
2016 62.86%2,92733.51% 1,5603.63% 169
2012 50.33%2,33545.72% 2,1213.95% 183
2008 41.90% 2,09354.73%2,7343.36% 168
2004 58.21%2,88840.40% 2,0041.39% 69
2000 50.73%2,40547.35% 2,2451.92% 91
1996 42.91% 1,90954.37%2,4192.72% 121

All of St. Clair County is a part of Missouri's 125th District in the Missouri House of Representatives and is represented by Warren Love (R-Osceola).

Missouri House of Representatives — District 125 — St. Clair County (2016)
PartyCandidateVotes%±%
Republican Warren D. Love3,965100.00%
Missouri House of Representatives — District 125 — St. Clair County (2014)
PartyCandidateVotes%±%
Republican Warren D. Love2,447100.00%
Missouri House of Representatives — District 125 — St. Clair County (2012)
PartyCandidateVotes%±%
Republican Warren D. Love3,685100.00%

All of St. Clair County is a part of Missouri's 28th District in the Missouri Senate. The seat is currently Held by Sandy Crawford.

Missouri Senate — District 28 — St. Clair County (2014)
PartyCandidateVotes%±%
Republican Mike Parson2,616100.00%

Federal

U.S. Senate — Missouri — St. Clair County (2016)
PartyCandidateVotes%±%
Republican Roy Blunt2,94163.19%+17.07
Democratic Jason Kander1,46031.37%−14.08
Libertarian Jonathan Dine1382.97%−5.46
Green Johnathan McFarland450.97%+0.97
Constitution Fred Ryman701.50%+1.50
U.S. Senate — Missouri — St. Clair County (2012)
PartyCandidateVotes%±%
Republican Todd Akin2,13246.12%
Democratic Claire McCaskill2,10145.45%
Libertarian Jonathan Dine3908.43%

All of St. Clair County is included in Missouri's 4th Congressional District and is currently represented by Vicky Hartzler (R-Harrisonville) in the U.S. House of Representatives.

U.S. House of Representatives — Missouri's 4th Congressional District — St. Clair County (2016)
PartyCandidateVotes%±%
Republican Vicky Hartzler3,43874.59%+1.25
Democratic Gordon Christensen99321.55%−0.73
Libertarian Mark Bliss1783.86%−0.52
U.S. House of Representatives — Missouri's 4th Congressional District — St. Clair County (2014)
PartyCandidateVotes%±%
Republican Vicky Hartzler2,27873.34%+7.37
Democratic Nate Irvin69222.28%−8.03
Libertarian Herschel L. Young1364.38%+1.73
U.S. House of Representatives — Missouri’s 4th Congressional District — St. Clair County (2012)
PartyCandidateVotes%±%
Republican Vicky Hartzler3,03665.97%
Democratic Teresa Hensley1,39530.31%
Libertarian Thomas Holbrook1222.65%
Constitution Greg Cowan491.07%

Political culture

United States presidential election results for St. Clair County, Missouri [14]
Year Republican Democratic Third party(ies)
No.%No.%No.%
2024 3,98279.61%95919.17%611.22%
2020 3,93279.05%98819.86%541.09%
2016 3,50175.62%93620.22%1934.17%
2012 3,01965.26%1,46031.56%1473.18%
2008 2,98159.76%1,88637.81%1212.43%
2004 3,09862.40%1,84137.08%260.52%
2000 2,73157.63%1,86639.38%1423.00%
1996 1,81540.58%1,97444.13%68415.29%
1992 1,55533.72%1,96542.62%1,09123.66%
1988 2,31255.27%1,86444.56%70.17%
1984 2,66761.71%1,65538.29%00.00%
1980 2,41957.46%1,70640.52%852.02%
1976 1,80844.07%2,27155.35%240.58%
1972 2,84766.88%1,41033.12%00.00%
1968 2,27154.36%1,49635.81%4119.84%
1964 1,96143.06%2,59356.94%00.00%
1960 3,19663.15%1,86536.85%00.00%
1956 3,01857.84%2,20042.16%00.00%
1952 3,46564.17%1,91435.44%210.39%
1948 2,54850.52%2,48949.35%70.14%
1944 3,30660.87%2,11939.02%60.11%
1940 3,95057.80%2,85941.83%250.37%
1936 3,35150.13%3,30249.40%310.46%
1932 2,27137.71%3,68161.13%701.16%
1928 3,84668.88%1,70130.46%370.66%
1924 2,90749.70%2,64045.14%3025.16%
1920 3,24956.94%2,29640.24%1612.82%
1916 1,71845.80%1,88150.15%1524.05%
1912 1,04628.14%1,71046.00%96125.85%
1908 1,72346.50%1,87750.66%1052.83%
1904 1,89549.65%1,76146.14%1614.22%
1900 1,84444.91%2,03649.59%2265.50%
1896 1,82940.30%2,68659.19%230.51%
1892 1,51040.79%1,57242.46%62016.75%
1888 1,63544.33%1,69746.01%3569.65%

See also

References

  1. 1 2 "St. Clair County, Missouri". Census.gov.
  2. "Explore Census Data". data.census.gov. Retrieved December 27, 2021.
  3. "Find a County". National Association of Counties. Retrieved June 7, 2011.
  4. Eaton, David Wolfe (1918). How Missouri Counties, Towns and Streams Were Named. The State Historical Society of Missouri. pp.  357.
  5. Klos, Stanley L. (2004). "Arthur St. Clair". President Who? Forgotten Founders. Pittsburgh, Pennsylvania: Evisum, Inc. pp. 367–422. ISBN   0-9752627-5-0.
  6. "2010 Census Gazetteer Files". United States Census Bureau. August 22, 2012. Archived from the original on October 21, 2013. Retrieved November 20, 2014.
  7. "U.S. Decennial Census". United States Census Bureau. Retrieved November 20, 2014.
  8. "Historical Census Browser". University of Virginia Library. Retrieved November 20, 2014.
  9. "Population of Counties by Decennial Census: 1900 to 1990". United States Census Bureau. Retrieved November 20, 2014.
  10. "Census 2000 PHC-T-4. Ranking Tables for Counties: 1990 and 2000" (PDF). United States Census Bureau. Archived (PDF) from the original on March 27, 2010. Retrieved November 20, 2014.
  11. "State & County QuickFacts". United States Census Bureau. Retrieved September 14, 2013.
  12. "U.S. Census website". United States Census Bureau . Retrieved January 31, 2008.
  13. "P2 HISPANIC OR LATINO, AND NOT HISPANIC OR LATINO BY RACE – 2020: DEC Redistricting Data (PL 94-171) – St. Clair County, Missouri".
  14. Leip, David. "Dave Leip's Atlas of U.S. Presidential Elections". uselectionatlas.org. Retrieved March 26, 2018.

38°02′N93°46′W / 38.04°N 93.77°W / 38.04; -93.77