Miller County | |
---|---|
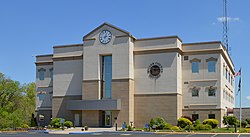
![]() The Miller County Courthouse in Tuscumbia | |
![]() Location within the U.S. state of Missouri | |
![]() Missouri's location within the U.S. | |
Coordinates: 38°13′N92°26′W / 38.22°N 92.43°W | |
Country | ![]() |
State | ![]() |
Founded | February 6, 1837 |
Named after | John Miller |
Seat | Tuscumbia |
Largest city | Eldon |
Area | |
• Total | 600 sq mi (2,000 km2) |
• Land | 593 sq mi (1,540 km2) |
• Water | 7.4 sq mi (19 km2) 1.2% |
Population (2020) | |
• Total | 24,722 |
• Density | 41/sq mi (16/km2) |
Time zone | UTC−6 (Central) |
• Summer (DST) | UTC−5 (CDT) |
Congressional district | 3rd |
Website | www |
Miller County is a county located in the northern Ozarks region of the U.S. state of Missouri. As of the 2020 United States census, the population was 24,722. [1] Its county seat is Tuscumbia. [2] The county was organized February 6, 1837, and named for John Miller, [3] former U.S. Representative and Governor of Missouri.
According to the U.S. Census Bureau, the county has a total area of 600 square miles (1,600 km2), of which 593 square miles (1,540 km2) is land and 7.4 square miles (19 km2) (1.2%) is water. [4]
Census | Pop. | Note | %± |
---|---|---|---|
1840 | 2,282 | — | |
1850 | 3,834 | 68.0% | |
1860 | 6,812 | 77.7% | |
1870 | 6,616 | −2.9% | |
1880 | 9,805 | 48.2% | |
1890 | 14,162 | 44.4% | |
1900 | 15,187 | 7.2% | |
1910 | 16,717 | 10.1% | |
1920 | 15,567 | −6.9% | |
1930 | 16,728 | 7.5% | |
1940 | 14,798 | −11.5% | |
1950 | 13,734 | −7.2% | |
1960 | 13,800 | 0.5% | |
1970 | 15,026 | 8.9% | |
1980 | 18,532 | 23.3% | |
1990 | 20,700 | 11.7% | |
2000 | 23,564 | 13.8% | |
2010 | 24,748 | 5.0% | |
2020 | 24,722 | −0.1% | |
U.S. Decennial Census [5] 1790-1960 [6] 1900-1990 [7] 1990-2000 [8] 2010-2015 [9] |
As of the census [10] of 2000, there were 23,564 people, 9,284 households, and 6,443 families residing in the county. The population density was 40 people per square mile (15 people/km2). There were 11,263 housing units at an average density of 19 units per square mile (7.3/km2). The racial makeup of the county was 97.99% White, 0.28% Black or African American, 0.46% Native American, 0.13% Asian, 0.02% Pacific Islander, 0.29% from other races, and 0.84% from two or more races. Approximately 0.98% of the population were Hispanic or Latino of any race.
There were 9,284 households, out of which 32.60% had children under the age of 18 living with them, 56.00% were married couples living together, 9.20% had a female householder with no husband present, and 30.60% were non-families. 26.10% of all households were made up of individuals, and 11.90% had someone living alone who was 65 years of age or older. The average household size was 2.50 and the average family size was 3.00.
In the county, the population was spread out, with 26.30% under the age of 18, 8.40% from 18 to 24, 27.40% from 25 to 44, 22.70% from 45 to 64, and 15.30% who were 65 years of age or older. The median age was 37 years. For every 100 females there were 97.30 males. For every 100 females age 18 and over, there were 93.70 males.
The median income for a household in the county was $30,977, and the median income for a family was $36,770. Males had a median income of $26,225 versus $18,903 for females. The per capita income for the county was $15,144. About 10.80% of families and 14.20% of the population were below the poverty line, including 19.30% of those under age 18 and 14.70% of those age 65 or over.
Race | Num. | Perc. |
---|---|---|
White (NH) | 22,908 | 92.7% |
Black or African American (NH) | 117 | 0.47% |
Native American (NH) | 113 | 0.46% |
Asian (NH) | 64 | 0.26% |
Pacific Islander (NH) | 24 | 0.1% |
Other/Mixed (NH) | 1,030 | 4.17% |
Hispanic or Latino | 466 | 1.9% |
Like most counties in rural western Missouri, Miller County is very Republican. It hasn't supported a Democrat for president since Franklin D. Roosevelt in 1932. The only other time it supported a Democrat in the 20th century was in 1912, when Woodrow Wilson carried the county against a mortally divided GOP. Lyndon Johnson is the last Democrat to garner even 40 percent of the county's vote.
Underlining how Republican the county has been over the years, it rejected native son Harry Truman in 1944 as Roosevelt's running mate, and when he headed the ticket himself in 1948.
The Republican Party completely controls politics at the local level in Miller County. Republicans currently hold all of the elected positions in the county.
Miller County, Missouri | |||
---|---|---|---|
Elected countywide officials | |||
Assessor | Joseph Cochran | Republican | |
Circuit Clerk | Sheila Curtman | Republican | |
County Clerk | Clinton Jenkins | Republican | |
Collector | Jody Vance | Republican | |
Commissioner (Presiding) | Kevin Cardwell | Republican | |
Commissioner (District 1) | Don Abbett | Republican | |
Commissioner (District 2) | Travis Rowden | Republican | |
Coroner | Caleb Shelton | Republican | |
Prosecuting Attorney | Matthew Howard | Republican | |
Public Administrator | Theresa Lupardus | Republican | |
Recorder | Kathy Plemmons | Republican | |
Sheriff | Louis Gregoire | Republican | |
Surveyor | Rick Wilson | Republican | |
Treasurer | Phil Lawson | Republican |
Year | Republican | Democratic | Third Parties |
---|---|---|---|
2024 | 82.84%10,638 | 14.76% 1,893 | 2.40% 308 |
2020 | 82.82%10,212 | 15.31% 1,888 | 1.87% 231 |
2016 | 69.65%7,924 | 27.37% 3,114 | 2.98% 339 |
2012 | 59.85%6,547 | 36.67% 4,012 | 3.48% 381 |
2008 | 55.86%6,414 | 42.31% 4,858 | 1.84% 211 |
2004 | 67.76%7,331 | 31.15% 3,370 | 1.09% 118 |
2000 | 57.12%5,343 | 39.38% 3,684 | 3.50% 327 |
1996 | 45.28% 3,984 | 51.76%4,554 | 2.97% 261 |
Miller County is divided into four legislative districts in the Missouri House of Representatives, all of which are represented by Republicans.
Party | Candidate | Votes | % | ±% | |
---|---|---|---|---|---|
Republican | Willard Haley | 2,307 | 98.67% | ||
Write In | 31 | 1.33% |
Party | Candidate | Votes | % | ±% | |
---|---|---|---|---|---|
Republican | David Wood | 1,940 | 83.40% | −16.60 | |
Democratic | Travis Maupin | 386 | 16.60% | +16.60 |
Party | Candidate | Votes | % | ±% | |
---|---|---|---|---|---|
Republican | David Wood | 1,021 | 100.00% |
Party | Candidate | Votes | % | ±% | |
---|---|---|---|---|---|
Republican | David Wood | 2,067 | 100.00% |
Party | Candidate | Votes | % | ±% | |
---|---|---|---|---|---|
Republican | Rudy Veit | 1,056 | 99.15% | ||
Write In | 9 | 0.85% |
Party | Candidate | Votes | % | ±% | |
---|---|---|---|---|---|
Republican | Mike Bernskoetter | 941 | 100.00% | +13.18% |
Party | Candidate | Votes | % | ±% | |
---|---|---|---|---|---|
Republican | Mike Bernskoetter | 428 | 86.82% | +8.73 | |
Constitution | Michael Eberle | 65 | 13.18% | +13.18 |
Party | Candidate | Votes | % | ±% | |
---|---|---|---|---|---|
Republican | Mike Bernskoetter | 802 | 78.09% | ||
Democratic | Vonnieta E. Trickey | 225 | 21.91% |
Party | Candidate | Votes | % | ±% | |
---|---|---|---|---|---|
Republican | Bruce Sassmann | 877 | 89.95% | ||
Democratic | Nancy Ragan | 97 | 9.95% |
Party | Candidate | Votes | % | ±% | |
---|---|---|---|---|---|
Republican | Tom Hurst | 878 | 100.00% |
Party | Candidate | Votes | % | ±% | |
---|---|---|---|---|---|
Republican | Tom Hurst | 450 | 100.00% | +23.17 |
Party | Candidate | Votes | % | ±% | |
---|---|---|---|---|---|
Republican | Tom Hurst | 703 | 76.83% | ||
Democratic | Greg Stratman | 212 | 23.17% |
Party | Candidate | Votes | % | ±% | |
---|---|---|---|---|---|
Republican | Lisa Thomas | 6,449 | 98.90% | ||
Write In | 72 | 1.10% |
Party | Candidate | Votes | % | ±% | |
---|---|---|---|---|---|
Republican | Rockay Miller | 6,140 | 100.00% |
Party | Candidate | Votes | % | ±% | |
---|---|---|---|---|---|
Republican | Rocky Miller | 2,842 | 100.00% |
Party | Candidate | Votes | % | ±% | |
---|---|---|---|---|---|
Republican | Rocky Miller | 5,717 | 100.00% |
All of Miller County is a part of Missouri's 6th District in the Missouri Senate and is currently represented by Mike Kehoe (R-Jefferson City).
Party | Candidate | Votes | % | ±% | |
---|---|---|---|---|---|
Republican | Mike Kehoe | 4,547 | 85.37% | ||
Democratic | Mollie Kristen Freebairn | 779 | 14.63% |
Party | Candidate | Votes | % | ±% | |
---|---|---|---|---|---|
Republican | Roy Blunt | 7,760 | 68.47% | +12.45 | |
Democratic | Jason Kander | 3,032 | 26.75% | −9.27 | |
Libertarian | Jonathan Dine | 303 | 2.67% | −5.29 | |
Green | Johnathan McFarland | 114 | 1.01% | +1.01 | |
Constitution | Fred Ryman | 124 | 1.09% | +1.09 |
Party | Candidate | Votes | % | ±% | |
---|---|---|---|---|---|
Republican | Todd Akin | 6,084 | 56.02% | ||
Democratic | Claire McCaskill | 3,912 | 36.02% | ||
Libertarian | Jonathan Dine | 865 | 7.96% |
All of Miller County is included in Missouri's 3rd Congressional District and is currently represented by Blaine Luetkemeyer (R-St. Elizabeth) in the U.S. House of Representatives.
Party | Candidate | Votes | % | ±% | |
---|---|---|---|---|---|
Republican | Blaine Luetkemeyer | 9,228 | 82.06% | −0.69 | |
Democratic | Kevin Miller | 1,641 | 14.59% | +0.94 | |
Libertarian | Dan Hogan | 278 | 2.47% | −1.13 | |
Constitution | Doanita Simmons | 99 | 0.88% | +0.88 |
Party | Candidate | Votes | % | ±% | |
---|---|---|---|---|---|
Republican | Blaine Luetkemeyer | 4,436 | 82.75% | +3.62 | |
Democratic | Courtney Denton | 732 | 13.65% | −3.57 | |
Libertarian | Steven Hedrick | 193 | 3.60% | −0.05 |
Party | Candidate | Votes | % | ±% | |
---|---|---|---|---|---|
Republican | Blaine Luetkemeyer | 8,548 | 79.13% | ||
Democratic | Eric C. Mayer | 1,860 | 17.22% | ||
Libertarian | Steven Wilson | 394 | 3.65% |
Year | Republican | Democratic | Third party(ies) | |||
---|---|---|---|---|---|---|
No. | % | No. | % | No. | % | |
2024 | 10,826 | 83.21% | 2,067 | 15.89% | 118 | 0.91% |
2020 | 10,176 | 82.08% | 2,038 | 16.44% | 183 | 1.48% |
2016 | 9,285 | 80.87% | 1,750 | 15.24% | 447 | 3.89% |
2012 | 8,099 | 73.31% | 2,651 | 24.00% | 298 | 2.70% |
2008 | 7,797 | 67.43% | 3,553 | 30.73% | 213 | 1.84% |
2004 | 7,797 | 71.99% | 2,959 | 27.32% | 75 | 0.69% |
2000 | 5,945 | 63.54% | 3,217 | 34.38% | 194 | 2.07% |
1996 | 4,387 | 50.20% | 3,110 | 35.59% | 1,242 | 14.21% |
1992 | 4,175 | 44.01% | 2,905 | 30.62% | 2,407 | 25.37% |
1988 | 5,662 | 68.82% | 2,555 | 31.06% | 10 | 0.12% |
1984 | 6,706 | 76.55% | 2,054 | 23.45% | 0 | 0.00% |
1980 | 5,560 | 67.93% | 2,469 | 30.16% | 156 | 1.91% |
1976 | 4,095 | 59.64% | 2,739 | 39.89% | 32 | 0.47% |
1972 | 5,682 | 78.05% | 1,598 | 21.95% | 0 | 0.00% |
1968 | 4,425 | 64.88% | 1,727 | 25.32% | 668 | 9.79% |
1964 | 3,784 | 56.97% | 2,858 | 43.03% | 0 | 0.00% |
1960 | 4,482 | 63.43% | 2,584 | 36.57% | 0 | 0.00% |
1956 | 4,085 | 61.71% | 2,535 | 38.29% | 0 | 0.00% |
1952 | 4,237 | 63.42% | 2,426 | 36.31% | 18 | 0.27% |
1948 | 3,088 | 55.03% | 2,514 | 44.80% | 9 | 0.16% |
1944 | 3,609 | 61.69% | 2,229 | 38.10% | 12 | 0.21% |
1940 | 3,971 | 55.87% | 3,113 | 43.80% | 23 | 0.32% |
1936 | 3,607 | 50.90% | 3,436 | 48.49% | 43 | 0.61% |
1932 | 2,615 | 40.64% | 3,776 | 58.68% | 44 | 0.68% |
1928 | 3,379 | 62.85% | 1,979 | 36.81% | 18 | 0.33% |
1924 | 3,011 | 56.16% | 1,962 | 36.60% | 388 | 7.24% |
1920 | 3,555 | 64.94% | 1,833 | 33.49% | 86 | 1.57% |
1916 | 1,862 | 55.52% | 1,395 | 41.59% | 97 | 2.89% |
1912 | 1,240 | 38.98% | 1,257 | 39.52% | 684 | 21.50% |
1908 | 2,016 | 57.47% | 1,393 | 39.71% | 99 | 2.82% |
1904 | 1,959 | 57.75% | 1,351 | 39.83% | 82 | 2.42% |
1900 | 1,796 | 53.63% | 1,493 | 44.58% | 60 | 1.79% |
1896 | 1,707 | 50.00% | 1,694 | 49.62% | 13 | 0.38% |
1892 | 1,497 | 51.23% | 1,076 | 36.82% | 349 | 11.94% |
1888 | 1,596 | 56.06% | 1,195 | 41.97% | 56 | 1.97% |
Former Governor Mike Huckabee (R-Arkansas) received more votes, a total of 1,406, than any candidate from either party in Miller County during the 2008 presidential primary.