Osage County, Missouri

Last updated

Osage County
Osage County MO Courthouse 20140920-1.jpg
The Osage County Courthouse in Linn
Map of Missouri highlighting Osage County.svg
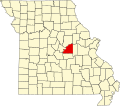
Location within the U.S. state of Missouri
Missouri in United States.svg
Missouri's location within the U.S.
Coordinates: 38°28′N91°52′W / 38.46°N 91.86°W / 38.46; -91.86
CountryFlag of the United States.svg United States
StateFlag of Missouri.svg  Missouri
FoundedJanuary 29, 1841
Named after Osage River
Seat Linn
Largest cityLinn
Area
  Total
611 sq mi (1,580 km2)
  Land604 sq mi (1,560 km2)
  Water6.1 sq mi (16 km2)  1.0%
Population
 (2020)
  Total
13,274
  Density22/sq mi (8.4/km2)
Time zone UTC−6 (Central)
  Summer (DST) UTC−5 (CDT)
Congressional district 3rd
Website osagecountygov.com

Osage County is a county in the central part of the U.S. state of Missouri. As of the 2020 census, the population was 13,274. [1] Its county seat is Linn. [2] The county was organized January 29, 1841, and named from the Osage River. [3]

Contents

Osage County is part of the Jefferson City, MO Metropolitan Statistical Area. Its geography and the founding of Westphalia Vineyards links it to the Missouri Rhineland, extending along the Missouri River valley to the western edges of the St. Louis Metropolitan Area.

According to data from the 2010 census, Osage County is the whitest county in Missouri, with 98.85 percent of residents being white.

Geography

According to the U.S. Census Bureau, the county has a total area of 610 square miles (1,600 km2), of which 604 square miles (1,560 km2) is land and 6.1 square miles (16 km2) (1.0%) is water. [4]

Adjacent counties

Major highways

Demographics

Historical population
CensusPop.Note
1850 6,704
1860 7,87917.5%
1870 10,79337.0%
1880 11,8249.6%
1890 13,08010.6%
1900 14,0967.8%
1910 14,2831.3%
1920 13,559−5.1%
1930 12,462−8.1%
1940 12,375−0.7%
1950 11,301−8.7%
1960 10,867−3.8%
1970 10,9941.2%
1980 12,0149.3%
1990 12,0180.0%
2000 13,0628.7%
2010 13,8786.2%
2020 13,274−4.4%
U.S. Decennial Census [5]
1790-1960 [6] 1900-1990 [7]
1990-2000 [8] 2010-2015 [9]

As of the census [10] of 2000, there were 13,062 people, 4,922 households, and 3,578 families residing in the county. The population density was 22 people per square mile (8.5 people/km2). There were 5,904 housing units at an average density of 10 units per square mile (3.9/km2). The racial makeup of the county was 98.64% White, 0.16% Black or African American, 0.24% Native American, 0.08% Asian, 0.02% Pacific Islander, 0.07% from other races, and 0.80% from two or more races. Approximately 0.59% of the population were Hispanic or Latino of any race.

There were 4,922 households, out of which 34.90% had children under the age of 18 living with them, 61.70% were married couples living together, 6.70% had a female householder with no husband present, and 27.30% were non-families. 23.80% of all households were made up of individuals, and 10.80% had someone living alone who was 65 years of age or older. The average household size was 2.61 and the average family size was 3.10.

In the county, the population was spread out, with 26.30% under the age of 18, 9.50% from 18 to 24, 27.70% from 25 to 44, 21.70% from 45 to 64, and 14.70% who were 65 years of age or older. The median age was 36 years. For every 100 females, there were 103.00 males. For every 100 females age 18 and over, there were 102.50 males.

The median income for a household in the county was $39,565, and the median income for a family was $46,503. Males had a median income of $29,538 versus $22,353 for females. The per capita income for the county was $17,245. About 5.90% of families and 8.30% of the population were below the poverty line, including 9.00% of those under age 18 and 10.40% of those age 65 or over.

2020 Census

Osage County Racial Composition [11]
RaceNum.Perc.
White (NH)12,68895.58%
Black or African American (NH)240.18%
Native American (NH)280.21%
Asian (NH)30.02%
Pacific Islander (NH)100.08%
Other/Mixed (NH)3963%
Hispanic or Latino 1251%

Education

Public schools

Private schools

Post-secondary

Public libraries

Communities

Cities and Towns

Unincorporated Communities

Politics

Local

The Republican Party mostly controls politics at the local level in Osage County. Republicans currently hold over half of the elected positions in the county.

Osage County, Missouri
Elected countywide officials
Assessor Tina Kammerich Republican
Circuit Clerk Beth Billington Democratic
County Clerk Nicci Kammerich Republican
Collector Denise Nolte Republican
Commissioner
(Presiding)
Darryl Griffin Republican
Commissioner
(District 1)
John Trenshaw Republican
Commissioner
(District 2)
Larry Kliethermes Republican
Coroner A.J. Probst Republican
Prosecuting Attorney Amanda L. Grellner Republican
Public Administrator Paul G. Stratman Republican
Recorder Cindy Hoffman Democratic
Sheriff Michael Bonham Republican
Surveyor Timothy Hamburg Democratic
Treasurer Valerie Prater Republican

State

Past Gubernatorial Elections Results
Year Republican Democratic Third Parties
2024 87.74%6,77710.58% 8171.68% 130
2020 86.43%6,51212.30% 9271.26% 95
2016 64.64%4,57932.76% 2,3212.60% 184
2012 58.37%4,01639.42% 2,7122.21% 152
2008 59.51%4,21239.45% 2,7921.04% 74
2004 68.67%4,58630.61% 2,0440.71% 48
2000 55.78%3,45042.78% 2,6461.44% 89
1996 38.80% 2,15159.33%3,2891.88% 104

Osage County is split between two of the districts that elect members of the Missouri House of Representatives, and both are represented by Republicans.

Missouri House of Representatives — District 61 — Osage County (2018)
PartyCandidateVotes%±%
Republican Aaron D. Griesheimer1,90981.54%+5.00
Democratic Pamela A. Menefee43118.41%−5.00
Missouri House of Representatives — District 61 — Osage County (2016)
PartyCandidateVotes%±%
Republican Justin Alferman2,14774.63%−1.48
Democratic Tom Smith59320.61%+1.48
Missouri House of Representatives — District 61 — Osage County (2012)
PartyCandidateVotes%±%
Republican Dave Schatz1,96574.80%
Democratic Michael Sage66225.20%
Missouri House of Representatives — District 62 — Osage County (2016)
PartyCandidateVotes%±%
Republican Tom Hurst3,906100.00%
Missouri House of Representatives — District 62 — Osage County (2014)
PartyCandidateVotes%±%
Republican Tom Hurst2,195100.00%+32.51
Missouri House of Representatives — District 62 — Osage County (2012)
PartyCandidateVotes%±%
Republican Tom Hurst2,75567.49%
Democratic Greg Stratman1,32732.51%

All of Osage County is a part of Missouri's 6th District in the Missouri Senate and is currently represented by Mike Kehoe (R-Jefferson City).

Missouri Senate — District 6 — Osage County (2014)
PartyCandidateVotes%±%
Republican Mike Kehoe3,54185.63%
Democratic Mollie Kristen Fairbairn59414.37%

Federal

U.S. Senate — Missouri — Osage County (2018)
PartyCandidateVotes%±%
Republican Josh Hawley4,62676.04%+9.30
Democratic Claire McCaskill1,25520.63%−5.75
Libertarian Japeth Campbell440.72%+0.72
Green Jo Crain280.46%+0.46
Independent Craig O'Dear801.31%+1.31
U.S. Senate — Missouri — Osage County (2012)
PartyCandidateVotes%±%
Republican Todd Akin3,98658.49%
Democratic Claire McCaskill2,35934.61%
Libertarian Jonathan Dine4706.90%

All of Osage County is included in Missouri's 3rd Congressional District and is currently represented by Blaine Luetkemeyer (R-St. Elizabeth) in the U.S. House of Representatives.

U.S. House of Representatives — Missouri’s 3rd Congressional District — Osage County (2016)
PartyCandidateVotes%±%
Republican Blaine Luetkemeyer5,95684.89%+2.02
Democratic Kevin Miller88912.67%−1.71
Libertarian Dan Hogan1221.74%−0.94
Constitution Doanita Simmons490.70%+0.70
U.S. House of Representatives — Missouri's 3rd Congressional District — Osage County (2014)
PartyCandidateVotes%±%
Republican Blaine Luetkemeyer3,43582.87%−0.58
Democratic Courtney Denton59614.38%−0.13
Libertarian Steven Hedrick1112.68%+0.64
Write-In Harold Davis30.07%+0.07
U.S. House of Representatives — Missouri's 3rd Congressional District — Osage County (2012)
PartyCandidateVotes%±%
Republican Blaine Luetkemeyer5,69483.45%
Democratic Eric C. Meyer99014.51%
Libertarian Steven Wilson1392.04%

Political culture

United States presidential election results for Osage County, Missouri [13]
Year Republican Democratic Third party(ies)
No.%No.%No.%
2024 6,65785.95%1,00913.03%791.02%
2020 6,42585.14%1,03713.74%841.11%
2016 5,85682.60%99814.08%2363.33%
2012 5,32977.02%1,47321.29%1171.69%
2008 5,06271.51%1,90726.94%1101.55%
2004 4,97574.58%1,67325.08%230.34%
2000 4,15467.24%1,93831.37%861.39%
1996 2,89051.90%2,04536.73%63311.37%
1992 2,78445.84%1,86030.63%1,42923.53%
1988 3,88568.58%1,77131.26%90.16%
1984 4,38176.54%1,34323.46%00.00%
1980 3,67963.19%2,04535.13%981.68%
1976 3,22461.19%2,01538.24%300.57%
1972 4,26674.18%1,48525.82%00.00%
1968 3,10761.63%1,54030.55%3947.82%
1964 2,71250.98%2,60849.02%00.00%
1960 2,67848.01%2,90051.99%00.00%
1956 3,07755.72%2,44544.28%00.00%
1952 3,40460.73%2,19139.09%100.18%
1948 2,48848.12%2,67251.68%100.19%
1944 3,28460.68%2,12139.19%70.13%
1940 3,74361.50%2,33238.32%110.18%
1936 2,83648.08%2,99550.77%681.15%
1932 1,79833.38%3,56766.21%220.41%
1928 2,47444.40%3,09255.49%60.11%
1924 2,49651.98%1,98641.36%3206.66%
1920 3,69976.17%1,11823.02%390.80%
1916 1,76955.56%1,38343.44%321.01%
1912 98133.56%1,39447.69%54818.75%
1908 1,82055.24%1,43943.67%361.09%
1904 1,69952.70%1,45145.01%742.30%
1900 1,73154.28%1,39643.78%621.94%
1896 1,70053.26%1,45645.61%361.13%
1892 1,37851.23%1,26647.06%461.71%
1888 1,44654.04%1,19044.47%401.49%

Missouri presidential preference primary (2008)

Missouri presidential preference primary (2016)

Donald J. Trump received more votes, a total of 1,316, than any candidate from either party in Osage County during the 2016 presidential primary.

See also

References

  1. "Explore Census Data". data.census.gov. Retrieved January 13, 2022.
  2. "Find a County". National Association of Counties. Retrieved June 7, 2011.
  3. Eaton, David Wolfe (1917). How Missouri Counties, Towns and Streams Were Named. The State Historical Society of Missouri. pp.  337.
  4. "2010 Census Gazetteer Files". United States Census Bureau. August 22, 2012. Archived from the original on October 21, 2013. Retrieved November 17, 2014.
  5. "U.S. Decennial Census". United States Census Bureau. Retrieved November 17, 2014.
  6. "Historical Census Browser". University of Virginia Library. Retrieved November 17, 2014.
  7. "Population of Counties by Decennial Census: 1900 to 1990". United States Census Bureau. Retrieved November 17, 2014.
  8. "Census 2000 PHC-T-4. Ranking Tables for Counties: 1990 and 2000" (PDF). United States Census Bureau. Archived (PDF) from the original on March 27, 2010. Retrieved November 17, 2014.
  9. "State & County QuickFacts". United States Census Bureau. Archived from the original on June 7, 2011. Retrieved September 12, 2013.
  10. "U.S. Census website". United States Census Bureau . Retrieved January 31, 2008.
  11. "P2 HISPANIC OR LATINO, AND NOT HISPANIC OR LATINO BY RACE – 2020: DEC Redistricting Data (PL 94-171) – Osage County, Missouri".
  12. Breeding, Marshall. "Osage County Library". Libraries.org. Retrieved May 8, 2017.
  13. Leip, David. "Dave Leip's Atlas of U.S. Presidential Elections". uselectionatlas.org. Retrieved March 26, 2018.

Further reading

38°28′N91°52′W / 38.46°N 91.86°W / 38.46; -91.86