Saline County, Missouri

Last updated

Saline County
Marshall-mo-ch.jpg
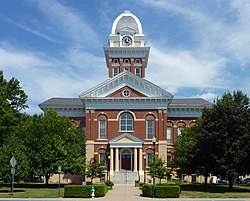
The Saline County Courthouse in Marshall
Map of Missouri highlighting Saline County.svg
Location within the U.S. state of Missouri
Missouri in United States.svg
Missouri's location within the U.S.
Coordinates: 39°08′N93°12′W / 39.14°N 93.2°W / 39.14; -93.2
CountryFlag of the United States.svg United States
StateFlag of Missouri.svg Missouri
FoundedNovember 25, 1820
Named after The salt springs in the region
Seat Marshall
Largest cityMarshall
Area
  Total
767 sq mi (1,990 km2)
  Land756 sq mi (1,960 km2)
  Water11 sq mi (30 km2)  1.5%
Population
 (2020)
  Total
23,333
  Density30/sq mi (12/km2)
Time zone UTC−6 (Central)
  Summer (DST) UTC−5 (CDT)
Congressional district 4th
Website www.salinecountymo.org

Saline County is a county located along the Missouri River in the U.S. state of Missouri. As of the 2020 census, the population was 23,333. [1] Its county seat is Marshall. [2] The county was established November 25, 1820, and named for the region's salt springs.

Contents

Settled primarily by migrants from the Upper South during the nineteenth century, this county was in the region bordering the Missouri River known as "Little Dixie". In the antebellum years, it had many plantations operated with the forced labor of enslaved workers. One-third of the county population was African American at the start of the American Civil War, but their proportion of the residents has declined dramatically to little more than five percent.

Saline County comprises the Marshall, Missouri Micropolitan Statistical Area.

History

Saline County was occupied for thousands of years by succeeding cultures of Missouri Native Americans. Saline County was organized by European-American settlers on November 25, 1820, and was named from the salinity of the springs found in the region. [3] After periods of conflict as settlers competed for resources and encroached on their territory, the local Native Americans, including the Osage nation, were forced by the U.S. government to move to reservations in Indian Territory, first in Kansas and then in Oklahoma.

Saline County was among several along the Missouri River that were settled primarily by migrants from the Upper South states of Kentucky, Tennessee and Virginia. The settlers quickly started cultivating crops similar to those in Middle Tennessee and Kentucky: hemp and tobacco; they had brought enslaved people with them to central Missouri, or purchased them from slave traders. These counties settled by southerners became known as "Little Dixie." By the time of the Civil War, one-third of the county population was African American; most of them were enslaved laborers on major plantations, particularly for labor-intensive tobacco cultivation. In 1847 the state legislature had prohibited any African Americans from being educated.

After the war, freedmen and poor white residents were hungry for education. The state's new constitution established public education for all citizens for the first time. [4] It was segregated, in keeping with local custom. Each township with 20 or more African-American students were supposed to establish a school for them, but rural areas lagged in the number of schools and jurisdictions underfunded those for blacks. By the early 20th century, Saline County had eighteen schools for black students. [5] The remaining black schools from the Jim Crow era have been studied by the State Historic Preservation Office and many are being nominated to the National Register of Historic Places.

Geography

According to the U.S. Census Bureau, the county has a total area of 767 square miles (1,990 km2), of which 756 square miles (1,960 km2) is land and 11 square miles (28 km2) (1.5%) is water. [6] Its northern border is the Missouri River where it is increased by the confluence of the Grand River.

Adjacent counties

Major highways

National protected area

Demographics

The largely rural county reached its peak of population in 1930, and has slowly declined since then since mechanization of farming has meant that fewer workers are needed; from about 1910 to the 1970s, African Americans often moved to larger urban areas for work and better social conditions.

Historical population
CensusPop.Note
1830 2,873
1840 5,25883.0%
1850 8,84368.2%
1860 14,69966.2%
1870 21,67247.4%
1880 29,91138.0%
1890 33,76212.9%
1900 33,703−0.2%
1910 29,448−12.6%
1920 28,817−2.1%
1930 30,5986.2%
1940 29,416−3.9%
1950 26,694−9.3%
1960 25,148−5.8%
1970 24,633−2.0%
1980 24,9191.2%
1990 23,523−5.6%
2000 23,7561.0%
2010 23,370−1.6%
2020 23,333−0.2%
U.S. Decennial Census [7]
1790-1960 [8] 1900-1990 [9]
1990-2000 [10] 2010 [11]

At the 2000 census, [12] there were 23,756 people, 9,015 households and 6,013 families residing in the county. The population density was 31 people per square mile (12 people/km2). There were 10,019 housing units at an average density of 13 units per square mile (5.0/km2). The racial makeup of the county was 90.03% White, 5.39% Black or African American, 0.31% Native American, 0.35% Asian, 0.21% Pacific Islander, 2.09% from other races, and 1.62% from two or more races. Approximately 4.42% of the population were Hispanic or Latino of any race. 28.7% were of German, 18.2% American, 9.8% English and 9.3% Irish ancestry.

There were 9,015 households, of which 30.60% had children under the age of 18 living with them, 51.90% were married couples living together, 10.30% had a female householder with no husband present, and 33.30% were non-families. 28.20% of all households were made up of individuals, and 14.60% had someone living alone who was 65 years of age or older. The average household size was 2.45 and the average family size was 2.97.

In Age distribution was 24.30% under the age of 18, 12.00% from 18 to 24, 25.20% from 25 to 44, 22.30% from 45 to 64, and 16.30% who were 65 years of age or older. The median age was 37 years. For every 100 females there were 96.10 males. For every 100 females age 18 and over, there were 93.70 males.

The median household income was $32,743, and the median family income was $39,234. Males had a median income of $27,180 versus $19,431 for females. The per capita income for the county was $16,132. About 10.50% of families and 13.20% of the population were below the poverty line, including 18.90% of those under age 18 and 8.60% of those age 65 or over.

2020 Census

Saline County Racial Composition [13]
RaceNum.Perc.
White (NH)17,47374.9%
Black or African American (NH)1,1495%
Native American (NH)680.3%
Asian (NH)1750.75%
Pacific Islander (NH)3971.7%
Other/Mixed (NH)1,2415.32%
Hispanic or Latino 2,83012.13%

Education

Public schools

K-12 school districts include: [14]

Elementary-only school districts include: [14]

Private schools

Post-secondary

Metropolitan Community College has the Santa Fe school district area in its out of district service area, but not its in-district taxation area. [15]

Public libraries

Communities

Cities

Villages

Unincorporated communities

Government and Politics

Local

The Democratic Party predominantly controls politics at the local level in Saline County. Democrats hold all but four of the elected positions in the county.

Saline County, Missouri
Elected countywide officials
Assessor Jessica Adcock Goodman Republican
Circuit Clerk Rebecca Uhlich Democratic
County Clerk Debbie Russell Democratic
Collector Cindi A. Sims Republican
Commissioner
(presiding)
Becky Plattner Democratic
Commissioner
(district 1)
Stephanie Gooden Republican
Commissioner
(district 2)
Monte Fenner Democratic
Coroner William “Willie” Harlow Democratic
Prosecuting Attorney Tim Thompson Republican
Public Administrator Paula J. Barr Democratic
Recorder Jamie Nichols Democratic
Sheriff Cindy Mullins Democratic
Surveyor Open Open
Treasurer Jared Brewer Republican

State

Gubernatorial

Past Gubernatorial Elections Results
Year Republican Democratic Third Parties
2024 69.67%6,43328.06% 2,5912.27% 210
2020 67.86%6,44329.83% 2,8322.31% 219
2016 53.01%4,90143.30% 4,0043.69% 341
2012 38.46% 3,48958.15%5,2753.38% 307
2008 32.80% 3,19556.87%5,54010.34% 1,007
2004 47.46% 4,69151.30%5,0711.24% 123
2000 42.23% 3,94556.14%5,2451.63% 152
1996 26.11% 2,31571.45%6,3342.44% 216

Missouri House of Representatives

Saline County is divided into two legislative districts in the Missouri House of Representatives, both represented by Republicans.

  • District 48 — Dave Muntzel (R-Boonville). Consists of the communities of Arrow Rock, Gilliam, Miami, Nelson, and Slater.
Missouri House of Representatives — District 48 — Saline County (2016)
PartyCandidateVotes%±%
Republican Dave Muntzel1,58876.02%−23.98
Independent Debra Dilks50123.98%+23.98
Missouri House of Representatives — District 48 — Saline County (2014)
PartyCandidateVotes%±%
Republican Dave Muntzel1,021100.00%+52.21
Missouri House of Representatives — District 48 — Saline County (2012)
PartyCandidateVotes%±%
Republican Dave Muntzel1,03647.79%
Democratic Ron Monnig1,13252.21%
  • District 51 — Dean Dohrman (R-La Monte). Consists of the communities of Blackburn, Emma, Grand Pass, Malta Bend, Marshall, Mt. Leonard, and Sweet Springs.
Missouri House of Representatives — District 51 — Saline County (2016)
PartyCandidateVotes%±%
Republican Dean Dohrman4,59067.64%+12.69
Democratic John Cozort2,19632.36%−7.87
Missouri House of Representatives — District 51 — Saline County (2014)
PartyCandidateVotes%±%
Republican Dean Dohrman2,15454.95%+10.44
Democratic Gary L. Grigsby1,57740.23%−12.07
Libertarian Bill Wayne1894.82%+1.63
Missouri House of Representatives — District 51 — Saline County (2012)
PartyCandidateVotes%±%
Republican Dean Dohrman2,91344.51%
Democratic Gary L. Grigsby3,42352.30%
Libertarian Bill Wayne2093.19%

Missouri Senate

All of Saline County is a part of Missouri's 21st District in the Missouri Senate and is currently represented by Denny Hoskins (R-Warrensburg).

Missouri Senate — District 21 — Saline County (2016)
PartyCandidateVotes%±%
Republican Denny Hoskins5,56462.57%+6.35
Democratic ElGene Ver Dught2,75831.02%−7.91
Libertarian Bill Wayne5706.41%+1.56
Missouri Senate — District 21 — Saline County (2012)
PartyCandidateVotes%±%
Republican David Pearce4,91156.22%
Democratic ElGene Ver Dught3,40138.93%
Libertarian Steven Hedrick4244.85%

Federal

US Senate

U.S. Senate — Missouri — Saline County (2016)
PartyCandidateVotes%±%
Republican Roy Blunt 4,61349.92%+15.29
Democratic Jason Kander 4,06143.94%−13.13
Libertarian Jonathan Dine2953.19%−5.11
Green Johnathan McFarland1421.54%+1.54
Constitution Fred Ryman1301.41%+1.41
U.S. Senate — Missouri — Saline County (2012)
PartyCandidateVotes%±%
Republican Todd Akin 3,12134.63%
Democratic Claire McCaskill 5,14357.07%
Libertarian Jonathan Dine7488.30%

US House of Representatives

All of Saline County is included in Missouri's 5th Congressional District, which is represented by Emanuel Cleaver (D-Kansas City) in the U.S. House of Representatives.

U.S. House of Representatives — Missouri’s 5th Congressional District — Saline County (2016)
PartyCandidateVotes%±%
Democratic Emanuel Cleaver II3,82441.83%+4.69
Republican Jacob Turk4,96754.34%−4.85
Libertarian Roy Welborn3503.83%+0.16
U.S. House of Representatives — Missouri's 5th Congressional District — Saline County (2014)
PartyCandidateVotes%±%
Democratic Emanuel Cleaver II1,94237.14%−12.50
Republican Jacob Turk3,09559.19%+12.42
Libertarian Roy Welborn1923.67%+0.08
U.S. House of Representatives — Missouri's 5th Congressional District — Saline County (2012)
PartyCandidateVotes%±%
Democratic Emanuel Cleaver II4,43949.64%
Republican Jacob Turk4,18346.77%
Libertarian Randy Langkraehr3213.59%

Presidential

United States presidential election results for Saline County, Missouri [19]
Year Republican Democratic Third party(ies)
No.%No.%No.%
1888 2,68436.65%4,38659.89%2533.45%
1892 2,62233.31%4,56557.99%6858.70%
1896 3,05034.85%5,61564.16%870.99%
1900 2,81435.91%4,90162.54%1211.54%
1904 2,80542.08%3,71055.66%1512.27%
1908 2,92640.73%4,18958.31%690.96%
1912 1,44320.94%3,92957.01%1,52022.05%
1916 2,96639.21%4,50359.53%951.26%
1920 5,61343.81%7,11455.53%850.66%
1924 4,99041.15%6,56454.14%5714.71%
1928 6,78051.98%6,25147.92%130.10%
1932 3,78330.89%8,38968.51%730.60%
1936 6,10841.34%8,62258.35%460.31%
1940 7,33647.79%7,98852.03%280.18%
1944 6,02247.22%6,71552.65%160.13%
1948 4,82240.09%7,18559.73%220.18%
1952 6,92652.19%6,31847.61%270.20%
1956 5,97050.55%5,84149.45%00.00%
1960 6,08550.48%5,96949.52%00.00%
1964 3,63533.22%7,30866.78%00.00%
1968 4,69846.76%4,64646.24%7047.01%
1972 6,64165.75%3,46034.25%00.00%
1976 4,88345.03%5,89054.31%720.66%
1980 5,21849.34%4,94346.74%4153.92%
1984 6,04258.53%4,28141.47%00.00%
1988 4,62547.70%5,03951.97%320.33%
1992 2,68826.44%4,64345.67%2,83527.89%
1996 2,93133.10%4,76553.82%1,15813.08%
2000 4,57248.87%4,58549.01%1982.12%
2004 5,38954.22%4,47945.06%710.71%
2008 4,96250.39%4,71247.85%1741.77%
2012 5,10456.04%3,79041.61%2142.35%
2016 5,97764.45%2,78930.07%5085.48%
2020 6,45167.67%2,90430.46%1781.87%
2024 6,49869.65%2,72629.22%1061.14%

See also

References

  1. "Saline County, Missouri". United States Census Bureau . Retrieved June 14, 2023.
  2. "Find a County". National Association of Counties. Retrieved June 7, 2011.
  3. Eaton, David Wolfe (1918). How Missouri Counties, Towns and Streams Were Named. The State Historical Society of Missouri. p. 361.
  4. Robert Brigham, The Education of the Negro in Missouri, Ph.D. Dissertation, University of Missouri- Columbia, 1946, p. 83
  5. Rural and Small Town Schools in Missouri, Dept. of Natural Resources, State Historic Preservation Officer, 2002, p. 10, accessed March 15, 2015
  6. "2010 Census Gazetteer Files". United States Census Bureau. August 22, 2012. Archived from the original on October 21, 2013. Retrieved November 20, 2014.
  7. "U.S. Decennial Census". United States Census Bureau. Retrieved November 20, 2014.
  8. "Historical Census Browser". University of Virginia Library. Retrieved November 20, 2014.
  9. "Population of Counties by Decennial Census: 1900 to 1990". United States Census Bureau. Retrieved November 20, 2014.
  10. "Census 2000 PHC-T-4. Ranking Tables for Counties: 1990 and 2000" (PDF). United States Census Bureau. Archived (PDF) from the original on March 27, 2010. Retrieved November 20, 2014.
  11. "State & County QuickFacts". United States Census Bureau. Archived from the original on August 12, 2011. Retrieved September 14, 2013.
  12. "U.S. Census website". United States Census Bureau . Retrieved January 31, 2008.
  13. "P2 HISPANIC OR LATINO, AND NOT HISPANIC OR LATINO BY RACE – 2020: DEC Redistricting Data (PL 94-171) – Saline County, Missouri".
  14. 1 2 Geography Division (January 12, 2021). 2020 CENSUS - SCHOOL DISTRICT REFERENCE MAP: Saline County, MO (PDF) (Map). U.S. Census Bureau . Retrieved October 14, 2024. - Text list
  15. "MCC SERVICE AREAS" (PDF). Metropolitan Community College . Retrieved June 15, 2025.
  16. Breeding, Marshall. "Marshall Public Library". Libraries.org. Retrieved May 8, 2017.
  17. Breeding, Marshall. "Slater Public Library". Libraries.org. Retrieved May 8, 2017.
  18. Breeding, Marshall. "Sweet Springs Public Library". Libraries.org. Retrieved May 8, 2017.
  19. Leip, David. "Dave Leip's Atlas of U.S. Presidential Elections". uselectionatlas.org. Retrieved March 26, 2018.

Further reading

39°08′N93°12′W / 39.14°N 93.20°W / 39.14; -93.20