| ||||||||||||||||||||||||||||
All 163 seats in the Missouri House of Representatives 82 seats needed for a majority | ||||||||||||||||||||||||||||
---|---|---|---|---|---|---|---|---|---|---|---|---|---|---|---|---|---|---|---|---|---|---|---|---|---|---|---|---|
| ||||||||||||||||||||||||||||
Results: Democratic gain Republican hold Democratic hold Vote share: 50–60% 60–70% 70–80% 80–90% >90% 40–50% 50–60% 60–70% 70–80% 80–90% >90% | ||||||||||||||||||||||||||||
|
Elections in Missouri |
---|
The 2020 election for Missouri House of Representatives was held on November 3, 2020. [1] All 163 seats in the state House were up for election in 2020. The primary election was held on August 31, 2020. [2]
Source | Ranking | As of |
---|---|---|
The Cook Political Report [3] | Likely R | October 21, 2020 |
Seats where the margin of victory was under 10%:
Party | Candidate | Votes | % | |
---|---|---|---|---|
Republican | Allen Andrews (incumbent) | 14,724 | 100.0% | |
Total votes | 14,724 | 100.0% | ||
Republican hold | ||||
Party | Candidate | Votes | % | |
---|---|---|---|---|
Republican | J. Eggleston (incumbent) | 12,838 | 83.1% | |
Democratic | Mindi Smith | 2,607 | 16.9% | |
Total votes | 15,445 | 100.0% | ||
Republican hold | ||||
Party | Candidate | Votes | % | |
---|---|---|---|---|
Republican | Danny Busick (incumbent) | 12,555 | 100.0% | |
Total votes | 12,555 | 100.0% | ||
Republican hold | ||||
Party | Candidate | Votes | % | |
---|---|---|---|---|
Republican | Greg Sharpe (incumbent) | 13,613 | 100.0% | |
Total votes | 13,613 | 100.0% | ||
Republican hold | ||||
Party | Candidate | Votes | % | |
---|---|---|---|---|
Republican | Louis Riggs (incumbent) | 15,530 | 100.0% | |
Total votes | 15,530 | 100.0% | ||
Republican hold | ||||
Party | Candidate | Votes | % | |
---|---|---|---|---|
Republican | Ed Lewis | 13,064 | 76.9% | |
Democratic | Terrence Fiala | 3,926 | 23.1% | |
Total votes | 16,990 | 100.0% | ||
Republican hold | ||||
Party | Candidate | Votes | % | |
---|---|---|---|---|
Republican | Rusty Black (incumbent) | 14,134 | 100.0% | |
Total votes | 14,134 | 100.0% | ||
Republican hold | ||||
Party | Candidate | Votes | % | |
---|---|---|---|---|
Republican | Randy Railsback | 16,561 | 100.0% | |
Total votes | 16,561 | 100.0% | ||
Republican hold | ||||
Party | Candidate | Votes | % | |
---|---|---|---|---|
Republican | Dean Van Schoiack | 14,047 | 71.3% | |
Democratic | Karen Planalp | 5,666 | 28.7% | |
Total votes | 19,713 | 100.0% | ||
Republican hold | ||||
Party | Candidate | Votes | % | |
---|---|---|---|---|
Republican | Bill Falkner (incumbent) | 7,111 | 61.0% | |
Democratic | Colby Murphy | 4,541 | 39.0% | |
Total votes | 11,651 | 100.0% | ||
Republican hold | ||||
Party | Candidate | Votes | % | |
---|---|---|---|---|
Republican | Brenda Shields (incumbent) | 12,219 | 70.5% | |
Democratic | Brady Lee ODell | 5,113 | 29.5% | |
Total votes | 17,332 | 100.0% | ||
Republican hold | ||||
Party | Candidate | Votes | % | |
---|---|---|---|---|
Republican | Josh Hurlbert | 14,863 | 65.22% | |
Democratic | Wade Hugh Kiefer | 7,926 | 34.78% | |
Total votes | 22,789 | 100.0% | ||
Republican hold | ||||
Party | Candidate | Votes | % | |
---|---|---|---|---|
Republican | Sean Pouche | 14,054 | 56.6% | |
Democratic | Vic Abundis | 10,774 | 43.4% | |
Total votes | 24,828 | 100.0% | ||
Republican hold | ||||
Party | Candidate | Votes | % | |
---|---|---|---|---|
Democratic | Ashley Aune | 12,584 | 53.4% | |
Republican | Eric Holmes | 10,985 | 46.6% | |
Total votes | 23,569 | 100.0% | ||
Democratic hold | ||||
Party | Candidate | Votes | % | |
---|---|---|---|---|
Democratic | Maggie Nurrenbern | 10,581 | 58.0% | |
Republican | Steve West | 7,624 | 42.0% | |
Total votes | 18,205 | 100.0% | ||
Democratic hold | ||||
Party | Candidate | Votes | % | |
---|---|---|---|---|
Republican | Chris Brown | 15,638 | 57.5% | |
Democratic | James Shackelford | 11,567 | 42.5% | |
Total votes | 27,205 | 100.0% | ||
Republican hold | ||||
Party | Candidate | Votes | % | |
---|---|---|---|---|
Democratic | Mark Ellebracht (incumbent) | 10,497 | 55.6% | |
Republican | Brandt Vircks | 8,378 | 44.4% | |
Total votes | 18,875 | 100.0% | ||
Democratic hold | ||||
Party | Candidate | Votes | % | |
---|---|---|---|---|
Democratic | Wes Rogers (incumbent) | 13,737 | 100.0% | |
Total votes | 13,737 | 100.0% | ||
Democratic hold | ||||
Party | Candidate | Votes | % | |
---|---|---|---|---|
Democratic | Ingrid Burnett (incumbent) | 7,026 | 100.0% | |
Total votes | 7,026 | 100.0% | ||
Democratic hold | ||||
Party | Candidate | Votes | % | |
---|---|---|---|---|
Republican | Bill Kidd (incumbent) | 10,900 | 65.0% | |
Democratic | Mike Englert | 5,800 | 35.0% | |
Total votes | 16,700 | 100.0% | ||
Republican hold | ||||
Party | Candidate | Votes | % | |
---|---|---|---|---|
Democratic | Robert Sauls (incumbent) | 7,682 | 50.1% | |
Republican | Vicki Riley | 7,637 | 49.9% | |
Total votes | 15,319 | 100.0% | ||
Democratic hold | ||||
Party | Candidate | Votes | % | |
---|---|---|---|---|
Democratic | Yolanda Young (incumbent) | 11,757 | 100.0% | |
Total votes | 11,757 | 100.0% | ||
Democratic hold | ||||
Party | Candidate | Votes | % | |
---|---|---|---|---|
Democratic | Michael Johnson | 8,756 | 100.0% | |
Total votes | 8,576 | 100.0% | ||
Democratic hold | ||||
Party | Candidate | Votes | % | |
---|---|---|---|---|
Democratic | Emily Weber | 20,167 | 89.0% | |
Libertarian | Andrew Miller | 2,501 | 11.0% | |
Total votes | 22,668 | 100.0% | ||
Democratic hold | ||||
Party | Candidate | Votes | % | |
---|---|---|---|---|
Democratic | Patty Lewis | 21,273 | 100.0% | |
Total votes | 21,273 | 100.0% | ||
Democratic hold | ||||
Party | Candidate | Votes | % | |
---|---|---|---|---|
Democratic | Ashley Bland Manlove (incumbent) | 15,201 | 100.0% | |
Total votes | 15,201 | 100.0% | ||
Democratic hold | ||||
Party | Candidate | Votes | % | |
---|---|---|---|---|
Democratic | Richard Brown (incumbent) | 12,296 | 100.0% | |
Total votes | 12,296 | 100.0% | ||
Democratic hold | ||||
Party | Candidate | Votes | % | |
---|---|---|---|---|
Democratic | Jerome Barnes (incumbent) | 13,128 | 100.0% | |
Total votes | 13,128 | 100.0% | ||
Democratic hold | ||||
Party | Candidate | Votes | % | |
---|---|---|---|---|
Democratic | Rory Rowland (incumbent) | 13,422 | 99.9% | |
Write-In | Richard McKie | 15 | 0.01% | |
Total votes | 13,437 | 100.0% | ||
Democratic hold | ||||
Party | Candidate | Votes | % | |
---|---|---|---|---|
Republican | Jonathan Patterson (incumbent) | 12,850 | 57.3% | |
Democratic | Art Schaaf | 9,591 | 42.7% | |
Total votes | 22,441 | 100.0% | ||
Republican hold | ||||
Party | Candidate | Votes | % | |
---|---|---|---|---|
Republican | Dan Stacy (incumbent) | 10,888 | 54.4% | |
Democratic | Rhonda R Dolan | 9,109 | 45.6% | |
Total votes | 19,997 | 100.0% | ||
Republican hold | ||||
Party | Candidate | Votes | % | |
---|---|---|---|---|
Republican | Jeff Coleman (incumbent) | 17,129 | 100.0% | |
Total votes | 17,129 | 100.0% | ||
Republican hold | ||||
Party | Candidate | Votes | % | |
---|---|---|---|---|
Republican | Chris Sander | 16,348 | 100.0% | |
Total votes | 16,348 | 100.0% | ||
Republican hold | ||||
Party | Candidate | Votes | % | |
---|---|---|---|---|
Republican | Rick Roeber | 10,815 | 50.7% | |
Democratic | Chris Hager | 10,514 | 49.3% | |
Total votes | 21,329 | 100.0% | ||
Republican hold | ||||
Party | Candidate | Votes | % | |
---|---|---|---|---|
Democratic | Keri Ingle (incumbent) | 11,620 | 54.5% | |
Republican | Sean Smith | 9,701 | 45.5% | |
Total votes | 21,321 | 100.0% | ||
Democratic hold | ||||
Party | Candidate | Votes | % | |
---|---|---|---|---|
Democratic | Mark Sharp (incumbent) | 11,320 | 68.0% | |
Republican | Nola Wood | 5,326 | 32.0% | |
Total votes | 16,646 | 100.0% | ||
Democratic hold | ||||
Party | Candidate | Votes | % | |
---|---|---|---|---|
Democratic | Annette Turnbaugh | 11,271 | 56.1% | |
Republican | John D. Boyd Jr. | 8,517 | 42.4% | |
Green | Daniel Karam | 312 | 1.6% | |
Total votes | 20,100 | 100.0% | ||
Democratic hold | ||||
Party | Candidate | Votes | % | |
---|---|---|---|---|
Republican | Doug Richey (incumbent) | 16,385 | 100.0% | |
Total votes | 16,385 | 100.0% | ||
Republican hold | ||||
Party | Candidate | Votes | % | |
---|---|---|---|---|
Republican | Peggy McGaugh (incumbent) | 15,328 | 100.0% | |
Total votes | 15,328 | 100.0% | ||
Republican hold | ||||
Party | Candidate | Votes | % | |
---|---|---|---|---|
Republican | Chad Perkins | 14,559 | 100.0% | |
Total votes | 14,559 | 100.0% | ||
Republican hold | ||||
Party | Candidate | Votes | % | |
---|---|---|---|---|
Republican | Randy Pietzman (incumbent) | 18,148 | 100.0% | |
Total votes | 18,148 | 100.0% | ||
Republican hold | ||||
Party | Candidate | Votes | % | |
---|---|---|---|---|
Republican | Jeff Porter | 17,316 | 100.0% | |
Total votes | 17,316 | 100.0% | ||
Republican hold | ||||
Party | Candidate | Votes | % | |
---|---|---|---|---|
Republican | Kent Haden (incumbent) | 13,641 | 100.0% | |
Total votes | 13,641 | 100.0% | ||
Republican hold | ||||
Party | Candidate | Votes | % | |
---|---|---|---|---|
Republican | Cheri Toalson Reisch | 10,737 | 59.4% | |
Democratic | Jacque Sample | 7,348 | 40.6% | |
Total votes | 18,085 | 100.0% | ||
Republican hold | ||||
Party | Candidate | Votes | % | |
---|---|---|---|---|
Democratic | Kip Kendrick (incumbent) | 11,627 | 100.0% | |
Total votes | 11,627 | 100.0% | ||
Democratic hold | ||||
Party | Candidate | Votes | % | |
---|---|---|---|---|
Democratic | Martha Stevens (incumbent) | 16,043 | 100.0% | |
Total votes | 16,043 | 100.0% | ||
Democratic hold | ||||
Party | Candidate | Votes | % | |
---|---|---|---|---|
Republican | Chuck Basye (incumbent) | 10,831 | 57.4% | |
Democratic | Adiran Plank | 8,053 | 42.6% | |
Total votes | 18,884 | 100.0% | ||
Republican hold | ||||
Party | Candidate | Votes | % | |
---|---|---|---|---|
Republican | Tim Taylor | 11,422 | 68.4% | |
Democratic | William (Bill) Betteridge | 5,287 | 31.6% | |
Total votes | 16,709 | 100.0% | ||
Republican hold | ||||
Party | Candidate | Votes | % | |
---|---|---|---|---|
Republican | Travis Fitzwater (incumbent) | 14,881 | 100.0% | |
Total votes | 14,881 | 100.0% | ||
Republican hold | ||||
Party | Candidate | Votes | % | |
---|---|---|---|---|
Republican | Sara Walash (incumbent) | 15,395 | 62.4% | |
Democratic | Kari L. Chesney | 9,290 | 37.6% | |
Total votes | 24,685 | 100.0% | ||
Republican hold | ||||
Party | Candidate | Votes | % | |
---|---|---|---|---|
Republican | Kurtis Gregory | 10,803 | 75.3% | |
Libertarian | William Truman (Bill) Wayne | 3,551 | 24.7% | |
Total votes | 14,354 | 100.0% | ||
Republican hold | ||||
Party | Candidate | Votes | % | |
---|---|---|---|---|
Republican | Brad Pollitt (incumbent) | 12,626 | 100.0% | |
Total votes | 12,626 | 100.0% | ||
Republican hold | ||||
Party | Candidate | Votes | % | |
---|---|---|---|---|
Republican | Terry Thompson | 12,288 | 67.6% | |
Democratic | Connie Simmons | 4,170 | 22.9% | |
Independent | Aaron C. Mais | 1,414 | 7.8% | |
Libertarian | Cameron Pack | 316 | 1.7% | |
Total votes | 18,188 | 100.0% | ||
Republican hold | ||||
Party | Candidate | Votes | % | |
---|---|---|---|---|
Republican | Dan Houx (incumbent) | 12,428 | 74.8% | |
Democratic | James Williams | 4,184 | 25.2% | |
Total votes | 16,612 | 100.0% | ||
Republican hold | ||||
Party | Candidate | Votes | % | |
---|---|---|---|---|
Republican | Mike Haffner (incumbent) | 18,583 | 100.0% | |
Total votes | 18,583 | 100.0% | ||
Republican hold | ||||
Party | Candidate | Votes | % | |
---|---|---|---|---|
Republican | Michael Davis | 11,228 | 62.5% | |
Democratic | Neal Barnes | 6,741 | 37.5% | |
Total votes | 17,969 | 100.0% | ||
Republican hold | ||||
Party | Candidate | Votes | % | |
---|---|---|---|---|
Republican | Rodger Reedy (incumbent) | 15,600 | 100.0% | |
Total votes | 15,600 | 100.0% | ||
Republican hold | ||||
Party | Candidate | Votes | % | |
---|---|---|---|---|
Republican | Willard Haley | 13,689 | 100.0% | |
Total votes | 13,689 | 100.0% | ||
Republican hold | ||||
Party | Candidate | Votes | % | |
---|---|---|---|---|
Republican | Rudy Veit (incumbent) | 16,649 | 100.0% | |
Total votes | 16,649 | 100.0% | ||
Republican hold | ||||
Party | Candidate | Votes | % | |
---|---|---|---|---|
Republican | Dave Griffith (incumbent) | 11,404 | 63.8% | |
Democratic | Joshua Dunne | 6,483 | 36.2% | |
Total votes | 17,887 | 100.0% | ||
Republican hold | ||||
Party | Candidate | Votes | % | |
---|---|---|---|---|
Republican | Aaron Griesheimer (incumbent) | 17,310 | 100.0% | |
Total votes | 17,310 | 100.0% | ||
Republican hold | ||||
Party | Candidate | Votes | % | |
---|---|---|---|---|
Republican | Bruce Sassmann | 14,429 | 79.6% | |
Democratic | Nancy J. Ragan | 3,703 | 20.4% | |
Total votes | 18,132 | 100.0% | ||
Republican hold | ||||
Party | Candidate | Votes | % | |
---|---|---|---|---|
Republican | Richard West (incumbent) | 23,062 | 100.0% | |
Total votes | 23,062 | 100.0% | ||
Republican hold | ||||
Party | Candidate | Votes | % | |
---|---|---|---|---|
Republican | Tony Lovasco (incumbent) | 15,954 | 68.9% | |
Democratic | Aaliyah Bailey | 7,209 | 31.1% | |
Total votes | 23,163 | 100.0% | ||
Republican hold | ||||
Party | Candidate | Votes | % | |
---|---|---|---|---|
Republican | Tom Hannegan (incumbent) | 10,779 | 54.1% | |
Democratic | Bill Otto | 9,159 | 45.9% | |
Total votes | 19,938 | 100.0% | ||
Republican hold | ||||
Party | Candidate | Votes | % | |
---|---|---|---|---|
Democratic | Marlene Terry | 11,655 | 100.0% | |
Total votes | 11,655 | 100.0% | ||
Democratic hold | ||||
Party | Candidate | Votes | % | |
---|---|---|---|---|
Democratic | Neil Smith | 18,173 | 100.0% | |
Total votes | 18,173 | 100.0% | ||
Democratic hold | ||||
Party | Candidate | Votes | % | |
---|---|---|---|---|
Democratic | Jay Mosley (incumbent) | 14,400 | 100.0% | |
Total votes | 14,400 | 100.0% | ||
Democratic hold | ||||
Party | Candidate | Votes | % | |
---|---|---|---|---|
Democratic | Gretchen Bangert (incumbent) | 12,284 | 71.3% | |
Republican | Scott E. Cazadd | 4,954 | 28.7% | |
Total votes | 17,238 | 100.0% | ||
Democratic hold | ||||
Party | Candidate | Votes | % | |
---|---|---|---|---|
Democratic | Paula Brown (incumbent) | 10,275 | 54.0% | |
Republican | Jerry Adzima | 8,755 | 46.0% | |
Total votes | 19,030 | 100.0% | ||
Democratic hold | ||||
Party | Candidate | Votes | % | |
---|---|---|---|---|
Democratic | LaDonna Appelbaum (incumbent) | 14,404 | 100.0% | |
Total votes | 14,404 | 100.0% | ||
Democratic hold | ||||
Party | Candidate | Votes | % | |
---|---|---|---|---|
Democratic | Doug Clemens (incumbent) | 9,865 | 61.4% | |
Republican | Darren L. Grant | 6,188 | 38.6% | |
Total votes | 16,053 | 100.0% | ||
Democratic hold | ||||
Party | Candidate | Votes | % | |
---|---|---|---|---|
Democratic | Raychel Proudie (incumbent) | 10,933 | 100.0% | |
Total votes | 10,933 | 100.0% | ||
Democratic hold | ||||
Party | Candidate | Votes | % | |
---|---|---|---|---|
Democratic | Michael Person (incumbent) | 11,153 | 100.0% | |
Total votes | 11,153 | 100.0% | ||
Democratic hold | ||||
Party | Candidate | Votes | % | |
---|---|---|---|---|
Democratic | Alan Gray | 13,247 | 100.0% | |
Total votes | 13,247 | 100.0% | ||
Democratic hold | ||||
Party | Candidate | Votes | % | |
---|---|---|---|---|
Democratic | Marlon Anderson | 11,236 | 100.0% | |
Total votes | 11,236 | 100.0% | ||
Democratic hold | ||||
Party | Candidate | Votes | % | |
---|---|---|---|---|
Democratic | Kimberly-Ann Collins | 12,537 | 100.0% | |
Total votes | 12,537 | 100.0% | ||
Democratic hold | ||||
Party | Candidate | Votes | % | |
---|---|---|---|---|
Democratic | Rasheen Aldridge Jr. (incumbent) | 11,148 | 85.5% | |
Republican | Timothy Gartin | 1,890 | 14.5% | |
Total votes | 13,038 | 100.0% | ||
Democratic hold | ||||
Party | Candidate | Votes | % | |
---|---|---|---|---|
Democratic | LaKeySha Frazier-Bosley (incumbent) | 14,321 | 100.0% | |
Total votes | 14,321 | 100.0% | ||
Democratic hold | ||||
Party | Candidate | Votes | % | |
---|---|---|---|---|
Democratic | Peter Merideth (incumbent) | 15,637 | 100.0% | |
Total votes | 15,637 | 100.0% | ||
Democratic hold | ||||
Party | Candidate | Votes | % | |
---|---|---|---|---|
Democratic | Steve Butz (incumbent) | 11,461 | 100.0% | |
Total votes | 11,461 | 100.0% | ||
Democratic hold | ||||
Party | Candidate | Votes | % | |
---|---|---|---|---|
Democratic | Donna Baringer (incumbent) | 14,702 | 73.6% | |
Republican | Robert J. Crump | 5,283 | 26.4% | |
Total votes | 19,985 | 100.0% | ||
Democratic hold | ||||
Party | Candidate | Votes | % | |
---|---|---|---|---|
Democratic | Jo Doll | 15,865 | 79.6% | |
Libertarian | Andrew Bolin | 4,066 | 20.4% | |
Total votes | 19,931 | 100.0% | ||
Democratic hold | ||||
Party | Candidate | Votes | % | |
---|---|---|---|---|
Democratic | Wiley Price IV (incumbent) | 13,191 | 100.0% | |
Total votes | 13,191 | 100.0% | ||
Democratic hold | ||||
Party | Candidate | Votes | % | |
---|---|---|---|---|
Democratic | Kevin Windham Jr. (incumbent) | 12,651 | 100.0% | |
Total votes | 12,651 | 100.0% | ||
Democratic hold | ||||
Party | Candidate | Votes | % | |
---|---|---|---|---|
Democratic | Joe Adams | 15,835 | 100.0% | |
Total votes | 15,835 | 100.0% | ||
Democratic hold | ||||
Party | Candidate | Votes | % | |
---|---|---|---|---|
Democratic | Ian Mackey (incumbent) | 16,778 | 100.0% | |
Total votes | 16,778 | 100.0% | ||
Democratic hold | ||||
Party | Candidate | Votes | % | |
---|---|---|---|---|
Democratic | Tracy McCreery (incumbent) | 13,924 | 62.8% | |
Republican | Karan Pujji | 7,855 | 35.4% | |
Libertarian | Stephen R. Johnson | 397 | 1.8% | |
Total votes | 22,176 | 100.0% | ||
Democratic hold | ||||
Party | Candidate | Votes | % | |
---|---|---|---|---|
Republican | Dean Plocher (incumbent) | 15,200 | 59.6% | |
Democratic | Luke Barber | 10,283 | 40.4% | |
Total votes | 25,483 | 100.0% | ||
Republican hold | ||||
Party | Candidate | Votes | % | |
---|---|---|---|---|
Democratic | Barbara Phifer (incumbent) | 13,858 | 56.7% | |
Republican | Anne Landers | 10,575 | 43.3% | |
Total votes | 24,433 | 100.0% | ||
Democratic hold | ||||
Party | Candidate | Votes | % | |
---|---|---|---|---|
Democratic | Sarah Unsicker (incumbent) | 18,156 | 100.0% | |
Total votes | 18,156 | 100.0% | ||
Democratic hold | ||||
Party | Candidate | Votes | % | |
---|---|---|---|---|
Democratic | Michael Burton | 11,030 | 55.5% | |
Republican | Bill Heisse | 8,854 | 44.5% | |
Total votes | 19,884 | 100.0% | ||
Democratic hold | ||||
Party | Candidate | Votes | % | |
---|---|---|---|---|
Democratic | Bridget Walsh Moore | 7,625 | 53.6% | |
Republican | Gabriel Jones | 6,590 | 46.4% | |
Total votes | 14,215 | 100.0% | ||
Democratic hold | ||||
Party | Candidate | Votes | % | |
---|---|---|---|---|
Republican | Jim Murphy (incumbent) | 9,595 | 52.9% | |
Democratic | Jean Pretto | 8,566 | 47.1% | |
Total votes | 18,161 | 100.0% | ||
Republican hold | ||||
Party | Candidate | Votes | % | |
---|---|---|---|---|
Republican | Michael O'Donnell (incumbent) | 12,691 | 59.3% | |
Democratic | Ann L Zimpfer | 8,726 | 40.7% | |
Total votes | 21,417 | 100.0% | ||
Republican hold | ||||
Party | Candidate | Votes | % | |
---|---|---|---|---|
Republican | David Gregory (incumbent) | 14,180 | 59.9% | |
Democratic | Erica Hoffman | 9,475 | 40.1% | |
Total votes | 23,655 | 100.0% | ||
Republican hold | ||||
Party | Candidate | Votes | % | |
---|---|---|---|---|
Republican | Mary Elizabeth Coleman | 14,539 | 100.0% | |
Total votes | 14,539 | 100.0% | ||
Republican hold | ||||
Party | Candidate | Votes | % | |
---|---|---|---|---|
Republican | Shamed Dogan (incumbent) | 13,535 | 59.8% | |
Democratic | Angie Schaefer | 9,088 | 40.2% | |
Total votes | 22,623 | 100.0% | ||
Republican hold | ||||
Party | Candidate | Votes | % | |
---|---|---|---|---|
Democratic | Trish Gunby (incumbent) | 10,637 | 51.0% | |
Republican | Lee Ann Pitman | 10,231 | 49.0% | |
Total votes | 20,868 | 100.0% | ||
Democratic hold | ||||
Party | Candidate | Votes | % | |
---|---|---|---|---|
Republican | Derek Grier (incumbent) | 12,991 | 55.4% | |
Democratic | Helena Webb | 10,448 | 44.6% | |
Total votes | 23,439 | 100.0% | ||
Republican hold | ||||
Party | Candidate | Votes | % | |
---|---|---|---|---|
Republican | Bruce DeGroot (incumbent) | 17,762 | 100.0% | |
Total votes | 17,762 | 100.0% | ||
Republican hold | ||||
Party | Candidate | Votes | % | |
---|---|---|---|---|
Republican | Ron Hicks (incumbent) | 14,080 | 62.4% | |
Democratic | Tracy Grundy | 8,492 | 37.6% | |
Total votes | 22,572 | 100.0% | ||
Republican hold | ||||
Party | Candidate | Votes | % | |
---|---|---|---|---|
Republican | John Wiemann (incumbent) | 14,342 | 63.2% | |
Democratic | Lisa Rees | 8,349 | 36.8% | |
Total votes | 22,691 | 100.0% | ||
Republican hold | ||||
Party | Candidate | Votes | % | |
---|---|---|---|---|
Republican | Adam Schnelting (incumbent) | 11,982 | 58.4% | |
Democratic | Jessica DeVoto | 8,542 | 41.6% | |
Total votes | 20,524 | 100.0% | ||
Republican hold | ||||
Party | Candidate | Votes | % | |
---|---|---|---|---|
Republican | Phil Christofanelli (incumbent) | 12,704 | 58.1% | |
Democratic | Christine Hyman | 9,172 | 41.9% | |
Total votes | 21,876 | 100.0% | ||
Republican hold | ||||
Party | Candidate | Votes | % | |
---|---|---|---|---|
Republican | Adam Schwadron | 9,620 | 51.4% | |
Democratic | Cindy Berne | 9,079 | 48.6% | |
Total votes | 21,876 | 100.0% | ||
Republican hold | ||||
Party | Candidate | Votes | % | |
---|---|---|---|---|
Republican | Nick Schroer (incumbent) | 12,344 | 59.7% | |
Democratic | Victoria Witt Datt | 7,554 | 36.5% | |
Libertarian | Mike Copeland | 773 | 3.7% | |
Total votes | 20,671 | 100.0% | ||
Republican hold | ||||
Party | Candidate | Votes | % | |
---|---|---|---|---|
Republican | Justin Hill (incumbent) | 15,209 | 64.7% | |
Democratic | Susan Shumway | 8,296 | 35.3% | |
Total votes | 23,505 | 100.0% | ||
Republican hold | ||||
Party | Candidate | Votes | % | |
---|---|---|---|---|
Republican | John Simmons (incumbent) | 16,570 | 100.0% | |
Total votes | 16,570 | 100.0% | ||
Republican hold | ||||
Party | Candidate | Votes | % | |
---|---|---|---|---|
Republican | Dottie Bailey (incumbent) | 14,227 | 65.3% | |
Democratic | John Kiehne | 7,553 | 34.7% | |
Total votes | 21,780 | 100.0% | ||
Republican hold | ||||
Party | Candidate | Votes | % | |
---|---|---|---|---|
Republican | Shane Roden (incumbent) | 13,308 | 70.9% | |
Democratic | Daniel (Vern) Cherry | 5,470 | 29.1% | |
Total votes | 18,778 | 100.0% | ||
Republican hold | ||||
Party | Candidate | Votes | % | |
---|---|---|---|---|
Republican | Rob Vescovo (incumbent) | 16,545 | 100.0% | |
Total votes | 16,545 | 100.0% | ||
Republican hold | ||||
Party | Candidate | Votes | % | |
---|---|---|---|---|
Republican | Dan Shaul (incumbent) | 11,150 | 63.1% | |
Democratic | Terry Burgess | 6,519 | 36.9% | |
Total votes | 17,669 | 100.0% | ||
Republican hold | ||||
Party | Candidate | Votes | % | |
---|---|---|---|---|
Republican | Becky Ruth (incumbent) | 15,798 | 100.0% | |
Total votes | 15,798 | 100.0% | ||
Republican hold | ||||
Party | Candidate | Votes | % | |
---|---|---|---|---|
Republican | Cyndi Buchheit-Courtway | 11,856 | 72.5% | |
Democratic | Cynthia D Nugent | 4,494 | 27.5% | |
Total votes | 16,350 | 100.0% | ||
Republican hold | ||||
Party | Candidate | Votes | % | |
---|---|---|---|---|
Republican | Dale Wright (incumbent) | 15,739 | 100.0% | |
Total votes | 15,739 | 100.0% | ||
Republican hold | ||||
Party | Candidate | Votes | % | |
---|---|---|---|---|
Republican | Mike Henderson (incumbent) | 10,485 | 73.3% | |
Democratic | Tony Dorsett | 3,817 | 26.7% | |
Total votes | 14,302 | 100.0% | ||
Republican hold | ||||
Party | Candidate | Votes | % | |
---|---|---|---|---|
Republican | Mike McGirl (incumbent) | 14,016 | 100.0% | |
Total votes | 14,016 | 100.0% | ||
Republican hold | ||||
Party | Candidate | Votes | % | |
---|---|---|---|---|
Republican | Nate Tate (incumbent) | 14,214 | 100.0% | |
Total votes | 14,214 | 100.0% | ||
Republican hold | ||||
Party | Candidate | Votes | % | |
---|---|---|---|---|
Republican | Jason Chipman (incumbent) | 12,846 | 77.1% | |
Democratic | Theresa Schmitt | 3,821 | 22.9% | |
Total votes | 16,667 | 100.0% | ||
Republican hold | ||||
Party | Candidate | Votes | % | |
---|---|---|---|---|
Republican | Don Mayhew (incumbent) | 11,919 | 100.0% | |
Total votes | 11,919 | 100.0% | ||
Republican hold | ||||
Party | Candidate | Votes | % | |
---|---|---|---|---|
Republican | Bill Hardwick | 6,133 | 69.3% | |
Democratic | Yvonne Reeves-Chong | 2,717 | 30.7% | |
Total votes | 8,850 | 100.0% | ||
Republican hold | ||||
Party | Candidate | Votes | % | |
---|---|---|---|---|
Republican | Suzie Pollock (incumbent) | 15,831 | 87.9% | |
Constitution | Pat Bellew | 2,150 | 11.9% | |
Write-In | Nickalina (Nicki) Ray | 23 | 0.1% | |
Total votes | 18,004 | 100.0% | ||
Republican hold | ||||
Party | Candidate | Votes | % | |
---|---|---|---|---|
Republican | Lisa Thomas | 17,736 | 100.0% | |
Total votes | 17,736 | 100.0% | ||
Republican hold | ||||
Party | Candidate | Votes | % | |
---|---|---|---|---|
Republican | Jim Kalberloh | 16,403 | 100.0% | |
Total votes | 16,403 | 100.0% | ||
Republican hold | ||||
Party | Candidate | Votes | % | |
---|---|---|---|---|
Republican | Patricia Pike (incumbent) | 13,296 | 80.5% | |
Democratic | Jim Hogan | 3,211 | 19.5% | |
Total votes | 16,507 | 100.0% | ||
Republican hold | ||||
Party | Candidate | Votes | % | |
---|---|---|---|---|
Republican | Ann Kelley (incumbent) | 16,881 | 100.0% | |
Total votes | 16,881 | 100.0% | ||
Republican hold | ||||
Party | Candidate | Votes | % | |
---|---|---|---|---|
Republican | Mike Stephens (incumbent) | 14,748 | 81.7% | |
Democratic | Marvin Manring | 3,312 | 18.3% | |
Total votes | 18,060 | 100.0% | ||
Republican hold | ||||
Party | Candidate | Votes | % | |
---|---|---|---|---|
Republican | Jeff Knight (incumbent) | 14,739 | 85.5% | |
Democratic | Dewanna (Dee) Marquez | 2,501 | 14.5% | |
Total votes | 17,240 | 100.0% | ||
Republican hold | ||||
Party | Candidate | Votes | % | |
---|---|---|---|---|
Republican | Bishop Davidson | 15,609 | 77.0% | |
Democratic | Dave Gragg | 4,665 | 23.0% | |
Total votes | 20,274 | 100.0% | ||
Republican hold | ||||
Party | Candidate | Votes | % | |
---|---|---|---|---|
Republican | Bill Owen | 10,827 | 65.7% | |
Democratic | Allison Schoolcraft | 5,642 | 34.3% | |
Total votes | 16,469 | 100.0% | ||
Republican hold | ||||
Party | Candidate | Votes | % | |
---|---|---|---|---|
Democratic | Crystal Quade (incumbent) | 6,289 | 59.3% | |
Republican | Sarah Semple | 4,320 | 40.7% | |
Total votes | 10,609 | 100.0% | ||
Democratic hold | ||||
Party | Candidate | Votes | % | |
---|---|---|---|---|
Republican | Curtis Trent (incumbent) | 13,037 | 65.0% | |
Democratic | Cindy Slimp | 7,005 | 35.0% | |
Total votes | 20,042 | 100.0% | ||
Republican hold | ||||
Party | Candidate | Votes | % | |
---|---|---|---|---|
Republican | Alex Riley | 10,469 | 55.8% | |
Democratic | Derrick Nowlin | 8,291 | 44.2% | |
Total votes | 18,760 | 100.0% | ||
Republican hold | ||||
Party | Candidate | Votes | % | |
---|---|---|---|---|
Democratic | Betsy Fogle | 8,555 | 48.3% | |
Republican | Steve Helms (incumbent) | 8,476 | 47.8% | |
Green | Vicke Kepling | 696 | 3.9% | |
Total votes | 17,727 | 100.0% | ||
Democratic gain from Republican | ||||
Party | Candidate | Votes | % | |
---|---|---|---|---|
Republican | Craig Fishel (incumbent) | 13,739 | 58.6% | |
Democratic | Jeff Munzinger | 9,709 | 41.4% | |
Total votes | 23,448 | 100.0% | ||
Republican hold | ||||
Party | Candidate | Votes | % | |
---|---|---|---|---|
Republican | John Black (incumbent) | 17,381 | 78.0% | |
Democratic | Raymond Lampert | 4,898 | 22.0% | |
Total votes | 22,279 | 100.0% | ||
Republican hold | ||||
Party | Candidate | Votes | % | |
---|---|---|---|---|
Republican | Brad Hudson (incumbent) | 18,652 | 100.0% | |
Total votes | 18,652 | 100.0% | ||
Republican hold | ||||
Party | Candidate | Votes | % | |
---|---|---|---|---|
Republican | Jered Taylor (incumbent) | 16,042 | 72.8% | |
Democratic | Darlene Graham | 5,988 | 27.2% | |
Total votes | 22,030 | 100.0% | ||
Republican hold | ||||
Party | Candidate | Votes | % | |
---|---|---|---|---|
Republican | Tricia Derges | 18,577 | 100.0% | |
Total votes | 18,577 | 100.0% | ||
Republican hold | ||||
Party | Candidate | Votes | % | |
---|---|---|---|---|
Republican | Hannah Kelly (incumbent) | 15,221 | 100.0% | |
Total votes | 15,221 | 100.0% | ||
Republican hold | ||||
Party | Candidate | Votes | % | |
---|---|---|---|---|
Republican | Bennie Cook | 13,282 | 100.0% | |
Total votes | 13,282 | 100.0% | ||
Republican hold | ||||
Party | Candidate | Votes | % | |
---|---|---|---|---|
Republican | Ron Copeland | 13,661 | 100.0% | |
Total votes | 13,661 | 100.0% | ||
Republican hold | ||||
Party | Candidate | Votes | % | |
---|---|---|---|---|
Republican | Chris Dinkins (incumbent) | 13,428 | 100.0% | |
Total votes | 13,428 | 100.0% | ||
Republican hold | ||||
Party | Candidate | Votes | % | |
---|---|---|---|---|
Republican | Rick Francis (incumbent) | 14,751 | 84.4% | |
Democratic | Mike Lindley | 2,736 | 15.6% | |
Total votes | 17,487 | 100.0% | ||
Republican hold | ||||
Party | Candidate | Votes | % | |
---|---|---|---|---|
Republican | Barry Hovis (incumbent) | 21,012 | 100.0% | |
Total votes | 21,012 | 100.0% | ||
Republican hold | ||||
Party | Candidate | Votes | % | |
---|---|---|---|---|
Republican | Wayne Wallingford | 10,167 | 63.1% | |
Democratic | Andy Leighton | 5,935 | 36.9% | |
Total votes | 16,102 | 100.0% | ||
Republican hold | ||||
Party | Candidate | Votes | % | |
---|---|---|---|---|
Republican | Jamie Burger | 13,740 | 100.0% | |
Total votes | 13,740 | 100.0% | ||
Republican hold | ||||
Party | Candidate | Votes | % | |
---|---|---|---|---|
Republican | Don Rone Jr. (incumbent) | 10,675 | 100.0% | |
Total votes | 10,675 | 100.0% | ||
Republican hold | ||||
Party | Candidate | Votes | % | |
---|---|---|---|---|
Republican | Andrew McDaniel (incumbent) | 9,762 | 100.0% | |
Total votes | 9,762 | 100.0% | ||
Republican hold | ||||
Party | Candidate | Votes | % | |
---|---|---|---|---|
Republican | Herman Morse (incumbent) | 14,746 | 100.0% | |
Total votes | 14,746 | 100.0% | ||
Republican hold | ||||
Party | Candidate | Votes | % | |
---|---|---|---|---|
Republican | Hardy Billington (incumbent) | 11,951 | 100.0% | |
Total votes | 11,951 | 100.0% | ||
Republican hold | ||||
Party | Candidate | Votes | % | |
---|---|---|---|---|
Republican | Darrell Atchison | 14,943 | 100.0% | |
Total votes | 14,943 | 100.0% | ||
Republican hold | ||||
Party | Candidate | Votes | % | |
---|---|---|---|---|
Republican | David Evans (incumbent) | 15,201 | 100.0% | |
Total votes | 15,201 | 100.0% | ||
Republican hold | ||||
Party | Candidate | Votes | % | |
---|---|---|---|---|
Republican | Travis Smith | 15,299 | 84.8% | |
Democratic | Mike Lind | 2,740 | 15.2% | |
Total votes | 18,039 | 100.0% | ||
Republican hold | ||||
Party | Candidate | Votes | % | |
---|---|---|---|---|
Republican | Brian Seitz | 14,128 | 77.5% | |
Democratic | Dale Speelman | 4,101 | 22.5% | |
Total votes | 18,229 | 100.0% | ||
Republican hold | ||||
Party | Candidate | Votes | % | |
---|---|---|---|---|
Republican | Mitch Boggs | 14,890 | 100.0% | |
Total votes | 14,890 | 100.0% | ||
Republican hold | ||||
Party | Candidate | Votes | % | |
---|---|---|---|---|
Republican | Scott Cupps (incumbent) | 12,962 | 81.4% | |
Democratic | Brenda McKinney | 2,971 | 18.6% | |
Total votes | 15,933 | 100.0% | ||
Republican hold | ||||
Party | Candidate | Votes | % | |
---|---|---|---|---|
Republican | Dirk Deaton (incumbent) | 13,854 | 100.0% | |
Total votes | 13,854 | 100.0% | ||
Republican hold | ||||
Party | Candidate | Votes | % | |
---|---|---|---|---|
Republican | Ben Baker (incumbent) | 14,030 | 79.0% | |
Democratic | Angela Thomas | 3,729 | 21.0% | |
Total votes | 17,759 | 100.0% | ||
Republican hold | ||||
Party | Candidate | Votes | % | |
---|---|---|---|---|
Republican | Lane Roberts (incumbent) | 10,387 | 68.0% | |
Democratic | Joshua Shackles | 4,876 | 32.0% | |
Total votes | 15,263 | 100.0% | ||
Republican hold | ||||
Party | Candidate | Votes | % | |
---|---|---|---|---|
Republican | Bob Bromley (incumbent) | 14,606 | 100.0% | |
Total votes | 14,606 | 100.0% | ||
Republican hold | ||||
Party | Candidate | Votes | % | |
---|---|---|---|---|
Republican | Cody Smith (incumbent) | 12,688 | 79.8% | |
Democratic | Aaron Hailey | 3,218 | 20.2% | |
Total votes | 15,906 | 100.0% | ||
Republican hold | ||||
Worth County is a county located in the northwestern portion of the U.S. state of Missouri. As of the 2020 census, the population was 1,973. It is the smallest county in the state in population and, excluding the independent city of St. Louis, the smallest in total area. Its county seat is Grant City. The county was organized February 8, 1861, and named for General William J. Worth, who served in the Mexican–American War. Worth County is also the youngest county in the state.
The 1848–49 United States House of Representatives elections were held on various dates in various states between August 1848 and November 1849. Each state set its own date for its elections to the House of Representatives before the first session of the 31st United States Congress convened on December 3, 1849. The new state of Wisconsin elected its first representatives, and California also held its first congressional elections before officially achieving statehood in 1850, increasing the size of the House to 233 seats.
The 1846–47 United States House of Representatives elections were held on various dates in various states between August 2, 1846, and November 2, 1847. Each state set its own date for its elections to the House of Representatives. 228 elected members representing 29 states took their seats when the first session of the 30th United States Congress convened December 6, 1847. The new states of Iowa and Texas elected their first representatives during this election cycle. These elections were held during President James K. Polk's term.
The 1842–43 United States House of Representatives elections were held on various dates in various states between August 1, 1842, and November 8, 1843. Each state set its own date for its elections to the House of Representatives before the first session of the 28th United States Congress convened on December 4, 1843. The exception was Maryland, who held theirs so late that they ran into February 1844. These elections occurred during President John Tyler's term. The congressional reapportionment based on the 1840 United States census unusually decreased the number of House seats, from 242 down to 223.
The 1834–35 United States House of Representatives elections were held on various dates in various states between July 7, 1834, and November 5, 1835. Each state set its own date for its elections to the House of Representatives before the first session of the 24th United States Congress convened on December 7, 1835. They were held during President Andrew Jackson's second term. Elections were held for 240 seats that represented 24 states, as well as the at-large-district seat for the pending new state of Michigan.
The 2016 United States House of Representatives elections in Missouri were held on November 8, 2016, to elect the eight U.S. representatives from the state of Missouri, one from each of the state's eight congressional districts. The elections coincided with the 2016 U.S. presidential election, as well as other elections to the House of Representatives, elections to the United States Senate and various state and local elections. The primaries were held on August 2.
The 2020 United States elections were held on Tuesday, November 3, 2020. The Democratic Party's nominee, former vice president Joe Biden, defeated incumbent Republican president Donald Trump in the presidential election. Despite losing seats in the House of Representatives, Democrats retained control of the House and gained control of the Senate. As a result, the Democrats obtained a government trifecta, the first time since the elections in 2008 that the party gained unified control of Congress and the presidency. With Trump losing his bid for re-election, he became the first defeated incumbent president to have overseen his party lose the presidency and control of both the House and the Senate since Herbert Hoover in 1932. This was the first time since 1980 that either chamber of Congress flipped partisan control in a presidential year, and the first time Democrats did so since 1948.
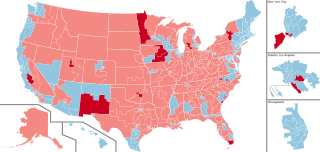
The 2020 United States House of Representatives elections were held on November 3, 2020, to elect representatives from all 435 congressional districts across each of the 50 U.S. states to the 117th United States Congress, as well as six non-voting delegates from the District of Columbia and the inhabited U.S. territories. Special House elections were also held on various dates throughout 2020.
The 2020 United States House of Representatives elections in Missouri was held on November 3, 2020, to elect the eight U.S. representatives from the state of Missouri, one from each of the state's eight congressional districts. The elections coincided with the 2020 United States presidential election, as well as other elections to the House of Representatives, elections to the United States Senate and various state and local elections.
The 2022 United States Senate election in Missouri was held on November 8, 2022, concurrently with elections for all other Class 3 U.S. senators and elections for the U.S. House of Representatives, to select a member of the United States Senate to represent the state of Missouri. Incumbent senator Roy Blunt, a Republican, did not seek a third term in office. Republican Missouri Attorney General Eric Schmitt won the open seat, defeating Democrat Trudy Busch Valentine.
Patricia Washburn Gunby is an American politician from the state of Missouri. A Democrat, she represented the 99th district in the Missouri House of Representatives from 2020 to 2023.
These six off-year races featured special elections to the 113th United States Congress to fill vacancies due to resignations in the United States House of Representatives. Two were due to Congressmen taking seats in the United States Senate, one resigned to take jobs in the private sector, one resigned to take a job in the public sector, and one resigned due to an impending federal indictment regarding misuse of campaign funds.
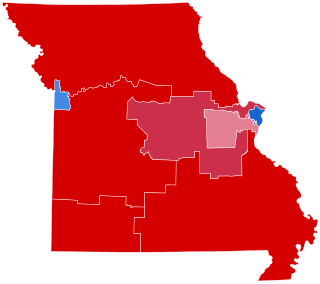
The 2022 United States House of Representatives elections in Missouri were held on November 8, 2022, to elect the eight U.S. representatives from the state of Missouri, one from each of the state's congressional districts. The elections coincided with other elections to the House of Representatives, elections to the United States Senate, and various state and local elections.
The 2020 United States state legislative elections were held on November 3, 2020, for 86 state legislative chambers in 44 states. Across the fifty states, approximately 65 percent of all upper house seats and 85 percent of all lower house seats were up for election. Nine legislative chambers in the five permanently-inhabited U.S. territories and the federal district of Washington, D.C. also held elections. The elections took place concurrently with several other federal, state, and local elections, including the presidential election, U.S. Senate elections, U.S. House elections, and gubernatorial elections.
Missouri state elections in 2020 were held on Tuesday, November 3, 2020. Aside from its presidential primaries held on March 10, its primary elections were held on August 4, 2020.
The 2019 United States state legislative elections were held on November 5, 2019. Seven legislative chambers in four states held regularly-scheduled elections. These off-year elections coincided with other state and local elections, including gubernatorial elections in three states.
The 2021 United States state legislative elections were held on November 2, 2021. Three legislative chambers in two states, New Jersey and Virginia, held regularly scheduled elections. These off-year elections coincided with other state and local elections, including gubernatorial elections in both states.
Missouri state elections were held on November 8, 2022, and the primary election were held on August 2, 2022.
The 2022 United States state legislative elections were held on November 8, 2022, for 88 state legislative chambers in 46 states. Across the fifty states, approximately 56 percent of all upper house seats and 92 percent of all lower house seats were up for election. Additionally, six territorial chambers were up in four territories and the District of Columbia. These midterm elections coincided with other state and local elections, including gubernatorial elections in multiple states.
The 2022 Idaho House of Representatives elections took place on November 8, 2022. Primary elections were held on May 17, 2022. Idaho voters elected state representatives in all 70 seats of the House, electing two state representatives in each of the 35 Idaho state legislative districts. State representatives serve two-year terms in the Idaho House of Representatives.