2020 United States House of Representatives elections in Florida Last updated October 18, 2025
2020 United States House of Representatives elections in Florida Majority party Minority party Party Republican Democratic Last election 14 13 Seats won 16 11 Seat change Popular vote 5,469,164 4,942,287 Percentage 52.26% 47.23% Swing
District results County results Republican
50–60%
60–70%
70–80%
80–90%
90>%
Democratic
50–60%
60–70%
70–80%
The 2020 United States House of Representatives elections in Florida were held on November 3, 2020, to elect the 27 U.S. representatives from Florida , one from each of the state's 27 congressional districts . The elections coincided with the 2020 U.S. presidential election , as well as other elections to the House of Representatives, elections to the U.S. Senate , and various state and local elections .
In what was considered an upset, the Republican Party retook the two seats that it lost to the Democrats in 2018 , expanding its 14–13 majority to 16–11. [ 1] [ 2]
Statewide Popular vote Republican
52.26% Democratic
47.23% Other
0.51%
House seats Republican
59.26% Democratic
40.74%
District 1 2020 Florida's 1st congressional district election Results by county Results by precinct Gaetz: 40–50% 50–60% 60–70% 70–80% 80–90% >90%Ehr: 50–60% 60–70% 70–80% 80–90% >90%
The 1st district encompasses the western Panhandle , and includes all of Escambia , Okaloosa , Santa Rosa , and Walton counties, as well as part of Holmes County . The district includes the cities of Pensacola , Fort Walton Beach , and Navarre . Republican Matt Gaetz , who had represented the district since 2017, was re-elected with 67% of the vote in 2018. [ 3]
Independent and third-party candidates General election Results County results Source [ 16]
Matt Gaetz Phil Ehr Albert Oram Margin Total County Votes % Votes % Votes % Votes % Votes Escambia 93,078 55.10% 73,582 43.56% 2,268 1.34% 19,496 11.54% 168,928 Holmes 4,992 88.07% 587 10.36% 89 1.57% 4,405 77.72% 5,668 Okaloosa 78,035 67.93% 34,966 30.44% 1,877 1.63% 43,069 37.49% 114,878 Santa Rosa 75,075 70.87% 29,483 27.83% 1,380 1.30% 45,592 43.04% 105,938 Walton 32,172 74.56% 10,554 24.46% 424 0.98% 21,618 50.10% 43,150
District 2 2020 Florida's 2nd congressional district election Results by county Results by precinct Dunn: 60–70% 70–80% 80–90% >90%O'Connor: 60–70% 70–80% No data
The 2nd district is located in northern Florida taking in portions of the Panhandle and the Big Bend , including all or parts of 19 counties. The district includes the cities of Panama City , Marianna , and Lake City . Republican Neal Dunn , who had represented the district since 2017, was re-elected with 67% of the vote in 2018. [ 3]
Democratic primary Candidates Withdrawn Willie Anderson, priest [ 17] Connor Oswald, teacher [ 18] Kristy Thripp, activist [ 19] Independent and third-party candidates General election Results County results Source [ 15]
Neal Dunn Kim O'Connor Margin Total County Votes % Votes % Votes % Votes Bay 76,997 98.26% 1,366 1.74% 75,631 96.51% 78,363 Calhoun 5,662 99.74% 15 0.26% 5,647 99.47% 5,677 Columbia 24,293 98.91% 268 1.09% 24,025 97.82% 24,561 Dixie 6,993 99.42% 41 0.58% 6,952 98.83% 7,034 Franklin 5,220 97.46% 136 2.54% 5,084 94.92% 5,356 Gilchrist 8,484 99.11% 76 0.89% 8,408 98.22% 8,560 Gulf 6,806 98.92% 74 1.08% 6,732 97.85% 6,880 Holmes 2,968 99.43% 17 0.57% 2,951 98.86% 2,985 Jackson 18,262 99.23% 141 0.77% 18,121 98.47% 18,403 Jefferson 586 98.16% 11 1.84% 575 96.31% 597 Lafayette 3,307 99.40% 20 0.60% 3,287 98.80% 3,327 Leon 47,294 93.35% 3,369 6.65% 43,925 86.70% 50,663 Levy 18,959 99.04% 183 0.96% 18,776 98.09% 19,142 Liberty 2,973 99.63% 11 0.37% 2,962 99.27% 2,984 Marion 24,888 98.50% 379 1.50% 24,509 97.00% 25,267 Suwannee 17,971 99.14% 156 0.86% 17,815 98.28% 18,127 Taylor 8,541 99.22% 67 0.78% 8,474 98.44% 8,608 Wakulla 14,514 97.76% 332 2.24% 14,182 95.53% 14,846 Washington 10,619 100.00% 0 0.00% 10,619 100.00% 10,619
District 3 2020 Florida's 3rd congressional district election Results by county Results by precinct Cammack: 50–60% 60–70% 70–80% 80–90% >90%Christensen: 50–60% 60–70% 70–80% 80–90% >90%
The 3rd district is located in North Central Florida , and includes Alachua , Clay , Putnam , Bradford , and Union counties, as well as most of Marion County . The district includes the cities of Gainesville , Palatka , and Ocala . Republican Ted Yoho , who had represented the district since 2013, was re-elected with 57% of the vote in 2018. [ 3] On December 10, 2019, Yoho announced he would not run for re-election, honoring his pledge that he would only serve four terms. [ 22]
Republican primary Endorsements Kat Cammack
Federal officials
State officials
Organizations
Todd Chase
State officials
Aaron Bean , state senator and former state representative (2000–2008) [ 43] Keith Perry , state senator and former state representative (2010–2016) [ 43] Judson Sapp
Federal officials
State officials
Individuals
Polling Hypothetical polling
with Ted Yoho
Poll source Date(s) Sample [ a] Margin Gavin Judson Amy Ted Undecided Meer Research [ 57] November 20, 2019 533 (RV) ± 4.24% 8% 2% 3% 71% 16%
Democratic primary Candidates Nominee Adam Christensen, businessman [ 58] Eliminated in primary Philip Dodds, sales manager and candidate for this district in 2012 [ 58] Tom Wells, physicist and candidate for this district in 2018 [ 58] General election Results County results Source [ 62]
Kat Cammack Adam Christensen Margin Total County Votes % Votes % Votes % Votes Alachua 52,914 37.86% 86,857 62.14% -33,943 -24.28% 139,771 Bradford 9,965 75.11% 3,302 24.89% 6,663 50.22% 13,267 Clay 84,221 68.89% 38,040 31.11% 46,181 37.77% 122,261 Marion 46,097 62.94% 27,141 37.06% 18,956 25.88% 73,238 Putnam 24,916 69.69% 10,835 30.31% 14,081 39.39% 35,751 Union 4,962 81.17% 1,151 18.83% 3,811 62.34% 6,113
District 4 2020 Florida's 4th congressional district election Precinct resultsRutherford: 50–60% 60–70% 70–80% 80–90% >90%Deegan: 50–60% 60–70% >90%Tie: 50% No data
The 4th district is located in the First Coast region, and includes all of Nassau County , as well as parts of Duval and St. Johns counties. The district includes the cities of Jacksonville , St. Augustine , and Fernandina Beach . Republican John Rutherford , who had represented the district since 2017, was re-elected with 65% of the vote in 2018. [ 3]
Independent and third-party candidates General election Results County results Source [ 15]
John Rutherford Donna Deegan Gary Koniz Margin Total County Votes % Votes % Votes % Votes % Votes Duval 169,852 57.51% 125,498 42.49% 17 0.01% 44,354 15.08% 295,367 Nassau 42,045 72.16% 16,225 22.84% 0 0.00% 25,820 44.31% 58,270 St. Johns 96,600 63.85% 54,700 36.15% 3 0.00% 41,900 27.69% 151,303
District 5 2020 Florida's 5th congressional district election Precinct resultsLawson: 50–60% 60–70% 70–80% 80–90% >90%Adler: 50–60% 60–70% 70–80% 80–90% >90% No data
The 5th district stretches along the northern border of Florida, and includes all of Baker , Gadsden , Hamilton and Madison counties, as well as parts of Columbia , Duval , Jefferson , and Leon counties. The district includes the city of Quincy , as well as parts of Tallahassee and Jacksonville . The district is majority-minority . Democrat Al Lawson , who had represented the district since 2017, was re-elected with 66% of the vote in 2018. [ 3]
Democratic primary Candidates Eliminated in primary Albert Chester, pharmacist [ 75] LaShonda "LJ" Holloway, former congressional aide and candidate for this district in 2016 [ 76] Republican primary Candidates Nominee Gary Adler, community activist [ 79] Eliminated in primary Roger Wagoner, businessman [ 76] General election Results County results Source [ 81]
Al Lawson Gary Adler Margin Total County Votes % Votes % Votes % Votes Baker 2,476 17.94% 11,329 82.06% -8,853 -64.13% 13,805 Columbia 2,033 53.63% 1,758 46.37% 275 7.25% 3,791 Duval 127,311 66.83% 63,193 33.17% 64,118 33.66% 190,504 Gadsden 16,783 70.94% 6,875 29.06% 9,908 41.88% 23,658 Hamilton 2,133 37.34% 3,579 62.66% -1,446 -25.32% 5,712 Jefferson 3,800 49.73% 3,841 50.27% -41 -0.54% 7,641 Leon 60,937 73.76% 21,674 26.24% 39,263 47.53% 82,611 Florida 3,990 43.13% 5,261 56.87% -1,271 -13.74% 9,251
District 6 2020 Florida's 6th congressional district election Precinct resultsWaltz: 50–60% 60–70% 70–80% 80–90%Curtis: 50–60% 60–70% 70–80% 80–90% >90% No data
The 6th district encompasses the Halifax area , including all of Flagler and Volusia counties, as well as parts of St. Johns and Lake counties. The district includes the cities of Daytona Beach , Palm Coast , and DeLand . Republican Michael Waltz , who had represented the district since 2019, was elected with 56% of the vote in 2018. [ 3]
Democratic primary Candidates Eliminated in primary Richard Thripp, professor [ 82] Independent and third-party candidates Independents Declared Gerry Nolan (write-in), businessman [ 70] General election Results County results Source [ 15]
Michael Waltz Clint Curtis Gerry Nolan Alan Grayson Margin Total County Votes % Votes % Votes % Votes % Votes % Votes Flagler 43,346 62.26% 26,257 37.72% 4 0.01% 10 0.01% 17,089 24.55 69,617 Lake 32,302 66.32% 16,386 33.64% 16 0.03% 4 0.01% 15,916 32.68% 48,708 St. Johns 14,851 65.80% 7,717 34.19% 2 0.01% 1 0.00% 7,134 31.61% 22,571 Volusia 174,894 58.89% 121,945 41.06% 90 0.03% 31 0.01% 52,949 17.83% 296,960
District 7 2020 Florida's 7th congressional district election Precinct resultsMurphy: 40–50% 50–60% 60–70% 70–80% 80–90%Valentín: 40–50% 50–60% 60–70% 70–80% No data
The 7th district is located in Central Florida , and includes all of Seminole County and part of Orange County . The district includes the cities of Orlando , Sanford , and Winter Park . Democrat Stephanie Murphy , who had represented the district since 2017, was re-elected with 57% of the vote in 2018. [ 3]
This district was included on the list of Democratic-held seats the National Republican Congressional Committee targeted in 2020. [ 85]
Republican primary Candidates Nominee Leo Valentín, radiologist [ 88] Eliminated in primary Richard Goble, businessman [ 89] Yukong Zhao, real estate investor [ 89] Withdrawn Jan Edwards, businesswoman [ 90] Independents and third-party candidates Declared William Garlington, businessman and former actor [ 70] General election Polling Hypothetical polling
with Richard Goble, Joel Greenberg (R), Stephanie Murphy and Leo Valentin
Poll source Date(s) Sample [ a] Margin Richard Joel Stephanie Leo Undecided Gravis Marketing /Orlando Politics [ 93] Jan 2–3, 2020 813 (RV) ± 3.4% 4% [ g] 20% 43% 4% 29%
with Joel Greenberg and Stephanie Murphy
Results County results Source [ 94]
Stephanie Murphy Leo Valentín William Garlington Margin Total County Votes % Votes % Votes % Votes % Votes Orange 92,639 61.28% 56,280 37.23% 2,242 1.48% 36,359 24.05% 151,161 Seminole 132,307 51.83% 119,470 46.80% 3,511 1.38% 12,837 5.03% 255,288
District 8 2020 Florida's 8th congressional district election Precinct resultsPosey: 50–60% 60–70% 70–80% 80–90% >90%Kennedy: 50–60% 60–70% 70–80% 80–90% >90% No data
The 8th district encompasses the Space Coast , and includes all of Indian River and Brevard counties, as well as part of Orange County . The district includes the cities of Melbourne , Palm Bay , and Titusville . Republican Bill Posey , who had represented the district since 2009, was re-elected with 60% of the vote in 2018. [ 3]
Democratic primary Candidates Nominee Jim Kennedy, electrical engineer [ 95] Withdrawn Tiffany Patti, activist [ 96] Disqualified Hicham Ammi, customer service manager [ 96] Jason Williams, engineer [ 96] Independent and third-party candidates Independents Withdrawn Russell Cyphers, former federal investigator for the departments of Treasury and Labor [ 96] General election Results County results Source [ 98]
Bill Posey Jim Kennedy Margin Total County Votes % Votes % Votes % Votes Brevard 215,686 60.68% 139,769 39.32% 75,917 21.36% 355,455 Indian River 61,055 63.84% 34,585 36.16% 26,470 27.68% 95,640 Orange 5,352 61.57% 3,341 38.43% 2,011 23.13% 8,693
District 9 2020 Florida's 9th congressional district election Precinct resultsSoto: 50–60% 60–70% 70–80% 80–90% >90%Olson: 50–60% 60–70% 70–80% 80–90% >90%Tie: 50% No data
The 9th district is located in Central Florida , and encompasses all of Osceola County , as well as parts of Orange and Polk counties. The district includes the cities of Kissimmee and St. Cloud , as well as eastern Orlando . Democrat Darren Soto , who had represented the district since 2017, was re-elected with 58% of the vote in 2018. [ 3]
Democratic primary Candidates Withdrawn Hendrith Vanlon Smith Jr., financial advisor [ 100] [ 101] Republican primary Candidates Eliminated in primary Jose Castillo, hospitality manager [ 103] Sergio E. Ortiz, mortgage banker [ 104] Christopher Wright, attorney [ 103] Independent and third-party candidates Independents Withdrawn John Rallison, teacher and pastor [ 105] General election Debate 2020 Florida's 9th congressional district debate No. Date Host Moderator Link Democratic Republican Key: P Participant A Absent N Not invited I Invited W Darren Soto Bill Olson 1 Oct. 6, 2020 WESH Greg Fox [ 106] P P
Results County results Source [ 15]
Darren Soto Bill Olson Clay Hill Margin Total County Votes % Votes % Votes % Votes % Votes Orange 62,032 61.78% 38,365 38.21% 6 0.01% 23,667 23.57% 100,403 Osceola 103,147 61.06% 65,756 38.93% 15 0.01% 37,391 22.14% 168,918 Polk 75,545 47.12% 84,768 52.88% 4 0.01% -9,223 -5.75 160,317
District 10 2020 Florida's 10th congressional district election Precinct resultsDemings: 50–60% 60–70% 70–80% 80–90% >90%Francois: 50–60% 60–70% No data
The 10th district is located in Central Florida , and includes part of Orange County . The district includes western Orlando and its surrounding suburbs, including Apopka , Ocoee , and Winter Garden . Democrat Val Demings , who had represented the district since 2017, was re-elected unopposed in 2018. [ 3]
Republican primary Candidates Eliminated in primary Willie Montague, pastor [ 109] Independent and third-party candidates Independents Candidates Sufiyah Yasmine (write-in), artist [ 70] Withdrawn Kristofer Lawson, writer [ 70] General election Results County results Source [ 15]
Val Demings Vennia Francois Sufiyah Yasmine Margin Total County Votes % Votes % Votes % Votes % Votes Orange 239,434 63.61% 136,889 36.37% 74 0.02% 102,545 27.24% 376,397
District 11 2020 Florida's 11th congressional district election Precinct resultsWebster: 50–60% 60–70% 70–80% 80–90%Cottrell: 50–60% 60–70% 70–80% No data
The 11th district is located in North Central Florida , and includes all of Sumter , Citrus , and Hernando counties, as well as parts of Marion and Lake counties. The district includes the cities of Spring Hill , Inverness , and Leesburg , as well as the large retirement community of The Villages . Republican Daniel Webster , who had represented the district since 2011, was re-elected with 65% of the vote in 2018. [ 3]
Democratic primary Candidates Nominee Dana Cottrell, teacher and nominee for Florida's 11th congressional district in 2018 [ 111] General election Results County results Source [ 15]
Daniel Webster Dana Cottrell Margin Total County Votes % Votes % Votes % Votes Citrus 64,293 70.57% 26,816 29.43% 37,477 41.13% 91,109 Hernando 68,885 64.73% 37,530 35.27% 31,355 29.46% 106,415 Lake 61,012 64.93% 32,956 35.07% 28,056 29.86% 93,968 Marion 58,948 63.42% 33,999 36.58% 24,949 26.84% 92,947 Sumter 63,841 70.44% 26,793 29.56% 37,048 40.88% 90,634
District 12 2020 Florida's 12th congressional district election Precinct resultsBilirakis: 50–60% 60–70% 70–80% 80–90%Walker: 50–60% No data
The 12th district encompasses the northern Tampa Bay area , including all of Pasco County , as well as parts of Hillsborough and Pinellas counties. The district includes the cities of Palm Harbor , New Port Richey , and Zephyrhills . Republican Gus Bilirakis , who had represented the district since 2007, was re-elected with 58% of the vote in 2018. [ 3]
Independent and third-party candidates General election Results County results Source [ 119]
Gus Bilirakis Kimberly Walker Margin Total County Votes % Votes % Votes % Votes Hillsborough 5,558 63.47% 3,199 36.53% 2,159 25.11% 8,757 Pasco 188,887 63.48% 108,659 36.52% 80,228 26.96% 297,546 Pinellas 90,496 61.63% 56,336 38.37% 34,160 23.26% 146,832
District 13 2020 Florida's 13th congressional district election Precinct resultsCrist: 40–50% 50–60% 60–70% 70–80% 80–90% >90%Luna: 50–60% 60–70% 70–80% 80–90% >90%Tie: 50% No data
The 13th district is located in the western Tampa Bay area and encompasses the northern Florida Suncoast , and includes part of Pinellas County . The district includes the cities of St. Petersburg , Clearwater , and Largo . Democrat Charlie Crist , who had represented the district since 2017, was re-elected with 57.6% of the vote in 2018. [ 3]
This district was included on the list of Democratic-held seats the National Republican Congressional Committee targeted in 2020. [ 85]
Republican primary Endorsements Anna Paulina Luna
Federal officials
Local officials
Organizations
Amanda Makki
Federal officials
Michael Burgess , U.S. representative (TX-26) [ 136] Neal Dunn , U.S. representative (FL-02) [ 136] Joni Ernst , U.S. senator from Iowa [ 137] Kevin McCarthy , U.S. representative (CA-23), House Minority Leader, and former House Majority Leader (2014–2019) and House Majority Whip (2011–2014) [ 136] John Rutherford , U.S. representative (FL-04) [ 136] Steve Scalise , U.S. representative (LA-01), House Minority Whip, and former House Majority Whip (2014–2019) [ 136] Michael Waltz , U.S. representative (FL-06) [ 136] State officials
Organizations
Individuals
Polling Poll source Date(s) Sample [ a] Margin George Sheila Anna Paulina Amanda Other Undecided St. Pete Polls [ 148] August 15, 2020 626 (LV) ± 3.9% 26% 6% 29% 20% 1% [ i] – St. Pete Polls [ 149] July 9, 2020 558 (LV) ± 4.1% 21% 4% 13% 29% 1% [ j] 32%
Independent and third-party candidates General election Polling Poll source Date(s) Sample [ a] Margin Charlie Anna Paulina Undecided St. Pete Polls [ 152] October 28, 2020 1,280 (LV) ± 2.7% 55% 39% 7% St. Pete Polls [ 152] August 29–30, 2020 2,160 (LV) ± 2.1% 55% 39% 7%
Results County results Source [ 15]
District 14 2020 Florida's 14th congressional district election Precinct resultsCastor: 50–60% 60–70% 70–80% 80–90% >90%Quinn: 50–60% 60–70%Tie: 50% No data
The 14th district is located in the northern Tampa Bay area , and includes part of Hillsborough County . The district includes the cities of Tampa , Carrollwood , and Northdale . Democrat Kathy Castor , who had represented the district since 2007, was re-elected unopposed in 2018. [ 3]
Republican primary Candidates Nominee Christine Quinn, businesswoman and nominee for Florida's 14th congressional district in 2016 [ 155] Independent and third-party candidates General election Results County results Source [ 15]
Kathy Castor Christine Quinn Margin Total County Votes % Votes % Votes % Votes Hillsborough 224,240 60.26% 147,896 39.74% 76,344 20.52% 372,136
District 15 2020 Florida's 15th congressional district election Precinct resultsFranklin: 50–60% 60–70% 70–80% 80–90%Cohn: 50–60% 60–70% 70–80% 80–90% No data
The 15th district is located in the northeastern Tampa Bay area and extends along the I-4 corridor into Central Florida , and includes parts of Hillsborough , Polk , and Lake counties. The district includes the cities of Lakeland , Brandon , and Bartow . Republican Ross Spano , who had represented the district since 2019, was elected with 53% of the vote in 2018. Spano lost renomination in the Republican primary. [ 3]
This district was included on the list of Republican-held seats the Democratic Congressional Campaign Committee targeted in 2020. [ 158]
Republican primary Candidates Declined Neil Combee , former state representative and candidate for Florida's 15th congressional district in 2018 [ 161] Sean Harper, contractor and candidate for Florida's 15th congressional district in 2018 [ 161] Danny Kushmer, non-profit executive and candidate for Florida's 15th congressional district in 2018 [ 161] (running for Florida House of Representatives , District 59) Ed Shoemaker, conservative activist and candidate for Florida's 15th congressional district in 2018 [ 161] (running for Polk County School Board ) Endorsements Scott Franklin
Federal officials
Local officials
Ross Spano
U.S. senators
U.S. representatives
Gus Bilirakis , U.S. representative from FL-12 (2013–present) and FL-09 (2007–2013) [ 165] Vern Buchanan , U.S. representative from FL-16 (2013–present) and FL-13 (2007–2013) [ 165] Liz Cheney , U.S. representative from WY-00 (2017–present); Chair of the House Republican Conference (2019–present); candidate for U.S. Senate from Wyoming in 2014 [ 166] Mario Díaz-Balart , U.S. representative from FL-25 (2003–2011 and 2013–present) and FL-21 (2011–2013) [ 166] Tom Emmer , U.S. representative from MN-06 (2015–present); Chair of the National Republican Congressional Committee (2019–present) [ 166] Kevin McCarthy , U.S. representative from CA-23 (2013–present) and CA-22 (2007–2013); House Minority Leader (2019–present); Leader of the House Republican Conference (2019–present) [ 166] Steve Scalise , U.S. representative from LA-01 (2008–present); House Minority Whip (2019–present) [ 166] Greg Steube , U.S. representative from FL-17 (2019–present) [ 161] Michael Waltz , U.S. representative from FL-06 (2019–present) [ 166] Daniel Webster , U.S. representative from FL-11 (2017–present), FL-10 (2013–2017), and FL-08 (2011–2013); candidate for U.S. Senate from Florida in 2004 [ 165] State legislators
Local officials
Organizations
Polling Poll source Date(s) Sample [ a] Margin Scott Ross Other St. Pete Polls [ 168] August 12, 2020 594 (LV) ± 4% 41% 42% 18% [ k]
Democratic primary Candidates Declined Kristen Carlson, attorney and nominee for Florida's 15th congressional district in 2018 [ 176] (endorsed Adam Hattersley ) [ 177] Endorsements Alan Cohn
U.S. presidents
U.S. senators
U.S. representatives
Charlie Crist , U.S. representative from FL-13 , Governor of Florida (2007–2011), Attorney General of Florida (2003–2007) (former Republican) [ 181] Ted Deutch , U.S. representative from FL-22 , U.S. representative from FL-21 (2013–2017), U.S. representative from FL-19 (2010–2013) [ 181] Lois Frankel , U.S. representative from FL-22 , U.S. representative from FL-21 (2017–present) [ 181] Gwen Graham , U.S. representative from FL-02 (2015–2017); candidate for Governor of Florida in 2018 [ 180] Patrick J. Kennedy , U.S. representative from RI-1 , son of Ted Kennedy [ 179] Darren Soto , U.S. representative from FL-09 (2017–present) [ 181] State executives
Municipal officials
Individuals
Labor unions
Organizations
Adam Hattersley
U.S. representatives
State officials
State legislators
Janet Cruz , Florida state senator from District 18 (2018–present) [ 177] Ben Diamond , Florida state representative from District 68 (2016–present) [ 177] Fentrice Driskell , Florida state representative from District 63 (2018–present) [ 177] Javier Fernandez , Florida state representative from District 114 (2018–present) [ 188] Dianne Hart , Florida state representative from District 61 (2018–present) [ 177] Evan Jenne , Florida state representative from District 99 (2014–present); Florida state representative from District 100 (2006–2012) [ 177] Kionne McGhee , Florida state representative from District 117 (2012–present); Minority Leader of the Florida House of Representatives (2018–present) [ 177] Wengay Newton , Florida state representative from District 70 (2016–present) [ 188] Sean Shaw , Florida state representative from District 61 (2016–2018); Democratic nominee for Attorney General of Florida in 2018 [ 177] Carlos Guillermo Smith , Florida state representative from District 49 (2016–present) [ 177] Susan Valdes , Florida state representative from District 62 (2018–present) [ 188] Jennifer Webb , Florida state representative from District 69 (2018–present) [ 177] Municipal officials
Individuals
Labor unions
Organizations
General election Results County results Source [ 197]
Scott Franklin Alan Cohn Margin Total County Votes % Votes % Votes % Votes Hillsborough 99,886 52.67% 89,768 47.33% 10,118 5.33% 189,654 Lake 34,194 53.55% 29,661 46.45% 4,533 7.10% 63,855 Polk 82,294 59.98% 54,918 40.02% 27,376 19.95% 137,212
District 16 2020 Florida's 16th congressional district election Precinct resultsBuchanan: 50–60% 60–70% 70–80% 80–90%Good: 50–60% 60–70% 70–80% >90% No data
The 16th district encompasses the southern Tampa Bay area and southern Florida Suncoast , and includes all of Manatee County , as well as parts of Hillsborough and Sarasota counties. The district includes the cities of Sarasota , Bradenton , and Sun City Center . Republican Vern Buchanan , who had represented the district since 2007, was reelected with 54% of the vote in 2018. [ 3]
This district was included on the list of Republican-held seats the Democratic Congressional Campaign Committee targeted in 2020. [ 158]
Democratic primary Endorsements Margaret Good
U.S. presidents
Organizations
General election Polling Hypothetical polling
with Generic Republican and Generic Democrat
Results County results Source [ 213]
Vern Buchanan Margaret Good Margin Total County Votes % Votes % Votes % Votes Hillsborough 66,515 51.95% 61,511 48.05% 5,004 3.91% 128,026 Manatee 128,072 59.63% 86,698 40.37% 41,374 19.26% 214,770 Sarasota 74,414 52.45% 67,474 47.55% 6,940 4.89% 141,888
District 17 2020 Florida's 17th congressional district election Precinct resultsSteube: 40–50% 50–60% 60–70% 70–80% 80–90%Ellison: 50–60% 60–70% 70–80% >90% No data
The 17th district encompasses part of Southwest Florida and most of the Florida Heartland , and includes all or part of 10 counties. The district includes the cities of North Port , Port Charlotte , and Sebring . Republican Greg Steube , who had represented the district since 2019, was elected with 62% of the vote in 2018. [ 3]
Democratic primary Candidates Nominee Allen Ellison, nominee for Florida's 17th congressional district in 2018 [ 214] Independent and third-party candidates Independents Declared Theodore Murray, former high school football coach [ 70] [ 215] General election Results County results Source [ 217]
Greg Steube Allen Ellison Theodore Murray Margin Total County Votes % Votes % Votes % Votes % Votes Charlotte 73,809 64.76% 38,633 33.90% 1,531 1.34% 35,176 30.86% 113,973 DeSoto 8,171 66.12% 4,050 32.77% 136 1.10% 4,121 33.35% 12,357 Glades 3,685 72.58% 1,319 25.98% 73 1.44% 2,366 46.60% 5,077 Hardee 5,771 69.30% 2,422 29.09% 134 1.61% 3,349 40.22% 8,327 Highlands 34,540 67.81% 15,807 31.03% 586 1.15% 18,733 36.78% 50,933 Lee 27,620 64.19% 14,733 34.24% 678 1.58% 12,887 29.95% 43,031 Okeechobee 11,082 71.55% 4,129 26.66% 278 1.79% 6,953 44.89% 15,489 Polk 24,504 62.95% 13,751 35.33% 672 1.73% 10,753 27.62% 38,927 Sarasota 77,332 62.22% 45,643 36.73% 1,308 1.05% 31,689 25.50% 124,283
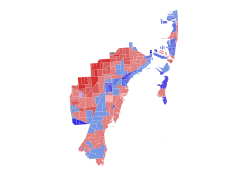
District 18 2020 Florida's 18th congressional district election Precinct resultsMast: 40–50% 50–60% 60–70% 70–80% 80–90% >90%Keith: 40–50% 50–60% 60–70% 70–80% 80–90% >90%Tie: 50% No data
The 18th district encompasses the Treasure Coast region, and includes all of St. Lucie and Martin counties, as well as part of Palm Beach County . The district includes the cities of Port St. Lucie , Fort Pierce , and Jupiter . Republican Brian Mast , who had represented the district since 2017, was re-elected with 54% of the vote in 2018. [ 3]
This district was included on the list of Republican-held seats the Democratic Congressional Campaign Committee targeted in 2020. [ 158]
Republican primary Candidates Eliminated in primary Nick Vessio, retired police sergeant [ 219] Democratic primary Candidates Nominee Pam Keith, attorney and candidate for Florida's 18th congressional district in 2018 and U.S. Senate in 2016 [ 220] Endorsements Pam Keith
U.S. senators
Individuals
Organizations
Oz Vazquez
Patrick Murphy , former U.S. representative from this district (2013–2017) and Democratic nominee for U.S. Senate in 2016 [ 226] State officials
Organizations
Independent and third-party candidates Independents Declared K. W. Miller, international energy and infrastructure executive [ 229] General election Results County results Source [ 233]
Brian Mast Pam Keith K. W. Miller Margin Total County Votes % Votes % Votes % Votes % Votes Martin 64,874 66.15% 31,205 31.82% 1,991 2.03% 33,669 34.33% 98,070 Palm Beach 99,734 55.18% 77,238 42.73% 3,769 2.09% 22,496 12.45% 180,741 St. Lucie 88,678 51.89% 78,231 45.77% 4,000 2.34% 10,447 6.11% 170,909
District 19 2020 Florida's 19th congressional district election Precinct resultsDonalds: 50–60% 60–70% 70–80%Banyai: 50–60% 60–70% 70–80%
The 19th district includes most of Southwest Florida , and includes parts of Lee and Collier counties. The district includes the cities of Cape Coral , Fort Myers , Estero , Bonita Springs and Naples . Republican Francis Rooney , who had represented the district since 2017, was reelected with 62% of the vote in 2018. [ 3] On October 19, 2019, Rooney announced he would not seek re-election. [ 234]
Republican primary Republican primary by precinct Donalds—>40%
Donalds—35–40%
Donalds—30–35%
Donalds—25–30%
Donalds—20–25%
Eagle—>40%
Eagle—35—40%
Eagle—30—35%
Eagle—25—30%
Eagle—20—25%
Askar—35—40%
Askar—25—30%
Askar—20—25%
Figlesthaler—25—30%
Figlesthaler—20—25%
Henderson—35—40%
Henderson—25—30%
Henderson—20—25%
Tie
Candidates Declined Gary Aubuchon , former state representative (endorsed Eagle ) [ 247] Lizbeth Benacquisto , state senator [ 248] Matt Caldwell , former state representative (endorsed Eagle ) [ 249] Chauncey Goss, son of former U.S. representative Porter Goss and candidate for Florida's 19th congressional district in 2016 [ 250] Brian Hamman, Lee County commissioner [ 249] Matt Hudson , former state representative [ 250] Steve Martin, attorney [ 251] Jim Oberweis , Illinois state senator and nominee for U.S. Senate in Illinois in 2014 [ 252] (running for IL-14 ) Kathleen Passidomo , state senator [ 249] Cecil Pendergrass, Lee County commissioner [ 240] Spencer Roach , state representative (endorsed Eagle ) [ 253] Bob Rommel , state representative [ 254] Francis Rooney , incumbent U.S. representative [ 234] Mike Scott, former Lee County sheriff [ 240] Drew Steele, local Fox News Radio host [ 249] Endorsements Byron Donalds
Federal officials
Organizations
Dane Eagle
Federal officials
State officials
Heather Fitzenhagen (withdrew )
Democratic primary Candidates Eliminated in primary David Holden, financial advisor and nominee for Florida's 19th congressional district in 2018 [ 266] Independent and third-party candidates Independents Declared Patrick Post (write-in), president of Sustainable Planet USA [ 267] Withdrawn Antonio Dumornay, housing activist [ 268] General election Results County results Source [ 15]
Byron Donalds Cindy Banyai Patrick Post Margin Total County Votes % Votes % Votes % Votes % Votes Collier 69,227 65.41% 36,612 34.59% 1 0.00% 32,615 30.82% 105,840 Lee 203,213 59.99% 135,534 40.01% 2 0.00% 67,679 19.98% 338,749
District 20 2020 Florida's 20th congressional district election County resultsHastings: 70–80% 80–90%
Precinct resultsHastings: 50–60% 60–70% 70–80% 80–90% >90%Musselwhite: 50–60% 60–70% 70–80% 80–90% >90%Tie: 50% No data
The 20th district is located in South Florida , and includes parts of Broward and Palm Beach counties. The district includes the cities of Fort Lauderdale , Pompano Beach , and Belle Glade . Democrat Alcee Hastings , who had represented the district since 1993, was re-elected unopposed in 2018. [ 3]
Republican primary Candidates Declared Vic DeGrammont, realtor [ 276] Greg Musselwhite, welding inspector [ 277] General election Results County results Source [ 279]
Alcee Hastings Greg Musselwhite Margin Total County Votes % Votes % Votes % Votes Broward 186,909 81.72% 41,803 18.28% 145,106 63.44% 228,712 Palm Beach 66,752 71.24% 26,945 28.76% 39,807 42.48% 93,697
District 21 2020 Florida's 21st congressional district election Precinct resultsFrankel: 40–50% 50–60% 60–70% 70–80% 80–90% >90%Loomer: 40–50% 50–60% 60–70% 70–80% 80–90% >90%Tie: 50% No data
The 21st district is located in South Florida , and includes part of Palm Beach County . The district includes the cities of West Palm Beach , Boynton Beach , and Wellington . Democrat Lois Frankel , who had represented the district since 2013, was re-elected unopposed in 2018. [ 3]
Democratic primary Candidates Withdrawn Adam Aarons, film producer and actor [ 281] Republican primary Endorsements Laura Loomer
U.S. presidents
U.S. representatives
Local officials
Individuals
Roseanne Barr , actress [ 294] Juanita Broaddrick , political activist, Bill Clinton accuser, and former nursing home administrator [ 293] Marjorie Taylor Greene , businesswoman, conspiracy theorist and Republican nominee for Georgia's 14th congressional district in the 2020 elections [ 291] Alex Jones , far-right radio show host, political extremist and conspiracy theorist [ 291] Michelle Malkin , conservative columnist [ 293] Gavin McInnes , far-right political commentator and founder of the Proud Boys [ 295] Wayne Allyn Root , conservative author, radio host, conspiracy theorist , and Libertarian nominee for Vice President of the United States in 2008 [ 296] Bo Snerdley , call screener, producer, and engineer for The Rush Limbaugh Show [ 293] Roger Stone , political consultant [ 297] Milo Yiannopoulos , far-right political commentator [ 295] Independent and third-party candidates General election Polling Poll source Date(s) Sample [ a] Margin Lois Laura Charleston Undecided St. Pete Polls /Florida Politics [ 301] October 2, 2020 1,015 (LV) ± 3.1% 61% 33% 2% 5%
Results County results Source [ 15]
Lois Frankel Laura Loomer Charleston Malkemus Sylvia Caravetta Piotr Blass Margin Total County Votes % Votes % Votes % Votes % Votes % Votes % Votes Palm Beach 237,925 59.02% 157,612 39.10% 7,544 1.87% 8 0.00% 4 0.00% 80,313 19.92% 403,093
District 22 2020 Florida's 22nd congressional district election Precinct resultsDeutch: 50–60% 60–70% 70–80% 80–90% >90%Pruden: 50–60% 60–70% 70–80%Tie: 50% No data
The 22nd district is located in South Florida , and includes parts of Broward and Palm Beach counties. The district includes the cities of Boca Raton , Deerfield Beach , and Coral Springs . Democrat Ted Deutch , who had represented the district since 2010, was re-elected with 62% of the vote in 2018. [ 3]
Republican primary Candidates Nominee James Pruden, attorney [ 302] Eliminated in primary Fran Flynn, businesswoman [ 303] Jessi Melton, president of Paragon Wireless Group [ 302] Darlene Swaffar, insurance agent [ 304] General election Results County results Source [ 307]
Ted Deutch James Pruden Margin Total County Votes % Votes % Votes % Votes Broward 192,923 59.96% 128,851 40.04% 64,072 19.91% 321,774 Palm Beach 42,841 53.19% 37,702 46.81% 5,139 6.38% 80,543
District 23 2020 Florida's 23rd congressional district election Precinct resultsSchultz: 50–60% 60–70% 70–80% 80–90%Spalding: 40–50% 50–60% 60–70% 70–80% No data
The 23rd district is located in South Florida , and includes parts of Broward and Miami-Dade counties. The district includes the cities of Pembroke Pines , Davie , and Aventura . Democrat Debbie Wasserman Schultz , who had represented the district since 2005, was re-elected with 58% of the vote in 2018. [ 3]
Democratic primary Candidates Eliminated in primary Jen Perelman, attorney [ 309] Republican primary Candidates Eliminated in primary Michael Kroske, businessman [ 317] Independent and third-party candidates Independent Republicans Declared D. B. Fugate (write-in), entrepreneur and U.S. Air Force veteran [ 70] Jeff Olson (write-in), real estate agent [ 70] General election Results County results Source [ 15]
Debbie Wasserman Schultz Carla Spalding Jeff Olson D. B. Fugate Margin Total County Votes % Votes % Votes % Votes % Votes % Votes Broward 203,940 58.96% 141,886 41.02% 42 0.01% 33 0.01% 62,054 17.94% 345,901 Miami-Dade 17,299 50.44% 16,988 49.53% 4 0.01% 4 0.01% 311 0.91% 34,295
District 24 2020 Florida's 24th congressional district election Precinct resultsWilson: 40–50% 50–60% 60–70% 70–80% 80–90% >90%Spicer: 40–50% 50–60% >90%Tie: 40–50% 50% No data
The 24th district is located in South Florida , and includes parts of Broward and Miami-Dade counties. The district includes the cities of Miami , Miami Gardens , and Hollywood . Democrat Frederica Wilson , who had represented the district since 2011, was re-elected unopposed in 2018. [ 3]
Republican primary Candidates Nominee Lavern Spicer, nonprofit executive [ 323] Independent and third-party candidates Independent Republicans Declared Howard Knepper (write-in), businessman and candidate for U.S. Senate in 2010, 2016, and 2018 [ 70] [ 325] Independents Declared Christine Alexandria Olivo, activist [ 326] Hector Rivera (write-in), real estate broker [ 70] General election Results County results Source [ 15]
Frederica Wilson Lavern Spicer Christine Olivo Howard Knepper Hector Rivera Margin Total County Votes % Votes % Votes % Votes % Votes % Votes % Votes Broward 24,817 67.93% 10,079 27.59% 1,632 4.47% 3 0.01% 0 0.00% 14,738 40.34% 36,531 Miami-Dade 194,008 76.65% 49,005 19.36% 10,071 3.98% 14 0.01% 9 0.00% 145,003 57.29% 253,107
District 26 2020 Florida's 26th congressional district election Precinct resultsGiménez: 50–60% 60–70% 70–80% >90%Mucarsel-Powell: 50–60% 60–70% 70–80% 80–90%Tie: 50% No data
The 26th district is located in South Florida and the Florida Keys , and includes all of Monroe County and part of Miami-Dade County . The district includes the cities of Homestead , Kendale Lakes , and Key West . Democrat Debbie Mucarsel-Powell , who had represented the district since 2019, flipped the district and was elected with 50% of the vote in 2018. [ 3]
This district was included on the list of Democratic-held seats the National Republican Congressional Committee targeted in 2020. [ 85]
Republican primary Candidates Withdrew José Peixoto, engineer and candidate for Florida's 26th congressional district in 2012 and 2016 [ 334] Irina Vilariño, restaurateur [ 335] [ 336] Polling Poll source Date(s) Sample [ a] Margin Omar Carlos Other Undecided Unspecified national Republican organization [ 340] October 13–15, 2019 ≈136 (LV) [ r] – 6% 51% 2% [ s] 39%
Endorsements Debbie Mucarsel-Powell (D)
U.S. presidents
Organizations
General election Results County results Source [ 351]
District 27 2020 Florida's 27th congressional district election Precinct resultsSalazar: 40–50% 50–60% 60–70% 70–80% 80–90% >90%Shalala: 40–50% 50–60% 60–70% 70–80% 80–90% >90% No data
The 27th district is located in South Florida , and includes part of Miami-Dade County . The district includes the cities of Coral Gables , Kendall , and Miami Beach , as well as the neighborhood of Little Havana in Miami . Democrat Donna Shalala , who had represented the district since 2019, flipped the district and was elected with 52% of the vote in 2018. [ 3] This district was included on the list of Democratic-held seats the National Republican Congressional Committee targeted in 2020. [ 85] Despite being the heavy favorite, Shalala was unseated by Salazar. [ 352]
Democratic primary Endorsements Donna Shalala
U.S. presidents
Organizations
Republican primary Endorsements Maria Elvira Salazar
U.S. presidents
U.S. representatives
Organizations
Independent and third-party candidates Independent Republicans Declared Frank Polo (write-in), businessman General election Results County results Source [ 15]
Notes 1 2 3 4 5 6 7 8 9 10 11 12 13 14 15 16 17 18 19 Key: ↑ Bill Engelbrecht with 2%, David Theus with 1%, and Joseph Millado with 1% ↑ "someone else" with 5% ↑ No other candidate exceeds 1% ↑ Kent Guinn with 4%; Joseph Milado with 2%; Matthew Raines with no voters ↑ "Someone else" with 3%; would not vote with 2% ↑ Standard VI response ↑ Response after pollster provided respondents with talking points about Greenberg ↑ Sharon Newby with 1% ↑ Newby with 1% ↑ "Undecided/won't say" with 18% ↑ "Refused" with 1% 1 2 Aquino with 3%; Severson with 2%; Kowal and McLaughlin with 1% ↑ Aquino, McLaughlin and Severson with 1%; Kowal with 0% ↑ Aquino and McLaughlin with 2%; Kowal and Severson with 0% ↑ Not yet released ↑ "Nearest competitor to Laura Loomer" with 4% ↑ 34% of a sample of 400 likely voters ↑ Irina Vilariño with 2% Partisan clients
↑ Poll sponsored by Cammack's cmampaign ↑ Poll sponsored by Sapp's campaign ↑ Poll sponsored by the Florida Democratic Party , which endorsed Cohn prior to the sampling period. 1 2 Poll conducted by the DCCC . ↑ Poll sponsored by Cohn's campaign. 1 2 3 4 5 Poll conducted for Buchanan's campaign. ↑ Poll conducted for Good's campaign. ↑ Poll sponsored by Keith's campaign ↑ Poll conducted by Eagle's campaign ↑ Poll conducted by Loomer's campaign ↑ Poll conducted for the Congressional Leadership Fund . ↑ Poll sponsored by Shalala's campaign ↑ Poll sponsored by Salazar's campaign References ↑ Bekiempis, Victoria; Singh, Maanvi (November 4, 2020). "US House races: Democrats retain control while facing upsets in key states" . The Guardian . Retrieved November 28, 2020 . ↑ Daugherty, Alex (November 3, 2020). "Maria Elvira Salazar defeats Donna Shalala in Florida's 27th Congressional District" . Miami Herald. Retrieved November 28, 2020 . 1 2 3 4 5 6 7 8 9 10 11 12 13 14 15 16 17 18 19 20 21 22 23 24 25 26 27 Wasserman, David; Flinn, Ally (November 7, 2018). "2018 House Popular Vote Tracker" . Cook Political Report. Archived from the original on April 3, 2019. Retrieved February 15, 2019 . 1 2 Blanks, Annie; Little, Jim (June 12, 2020). "Election 2020: Here are the candidates in Escambia, Santa Rosa you'll see on the ballot" . Pensacola News Journal . Retrieved August 10, 2020 . 1 2 3 4 5 6 7 8 9 10 11 12 13 14 15 16 17 18 19 20 21 22 23 24 25 26 27 28 29 "August 18, 2020 Primary Election Official Results" . Florida Department of State – Division of Elections . Retrieved September 10, 2020 . ↑ Little, Jim. "Democrat Phil Ehr files to take another run at Matt Gaetz in 2020" . Pensacola News Journal. Retrieved September 14, 2019 . 1 2 3 4 5 6 7 8 9 10 11 12 13 14 15 16 17 18 19 20 21 22 23 24 25 26 27 "2020 Senate Race Ratings for April 19, 2019" . The Cook Political Report . Retrieved September 20, 2019 . ↑ "2020 House Ratings" . FiveThirtyEight . August 12, 2020. Archived from the original on October 25, 2020. Retrieved October 15, 2020 . 1 2 3 4 5 6 7 8 9 10 11 12 13 14 15 16 17 18 19 20 21 22 23 24 25 26 "2020 Senate Ratings" . Senate Ratings . The Rothenberg Political Report. Retrieved October 3, 2019 . 1 2 3 4 5 6 7 8 9 10 11 12 13 14 15 16 17 18 19 20 21 22 23 24 25 26 27 "2020 Senate race ratings" . Sabato's Crystal Ball . Archived from the original on August 22, 2019. Retrieved August 28, 2019 . 1 2 3 4 5 6 7 8 9 10 11 12 13 14 15 16 17 18 19 20 21 22 23 24 25 26 27 "2020 Election Forecast" . Politico . November 19, 2019. 1 2 3 4 5 6 7 8 9 10 11 12 13 14 15 16 17 18 19 20 21 22 23 24 25 26 27 "Daily Kos Elections releases initial Senate race ratings for 2020" . Daily Kos Elections . Retrieved February 28, 2020 . 1 2 3 4 5 6 7 8 9 10 11 12 13 14 15 16 17 18 19 20 21 22 23 24 25 26 27 "Battle for White House" . RCP . April 19, 2019. 1 2 3 4 5 6 7 8 9 10 11 12 13 14 15 16 17 18 19 20 21 22 23 24 25 26 27 "2020 Negative Partisanship and the 2020 Congressional Elections" . Niskanen Center . April 28, 2020. Archived from the original on June 21, 2020. Retrieved May 1, 2020 . 1 2 3 4 5 6 7 8 9 10 11 12 13 14 15 16 17 18 19 20 21 22 23 24 25 26 27 28 29 30 31 32 33 34 35 36 37 38 39 "November 3, 2020 General Election" . Florida Department of State . Retrieved November 17, 2020 . ↑ "2020 Florida U.S. House - District 1 Election Results" . Jacksonville.com . November 2020. Retrieved February 4, 2025 . ↑ "Anderson For Congress 2020" . Anderson For Congress 2020 . Retrieved August 1, 2020 . ↑ "Oswald for Florida District 2" . sites.google.com . Retrieved August 1, 2020 . ↑ Schorsch, Peter (April 26, 2020). "Known knowns: What we learned during qualifying for Florida's congressional seats" . Retrieved August 1, 2020 . ↑ "Rep. Neal Dunn 'virtually guaranteed' re-election" . MyPanhandle.com | WMBB-TV . April 25, 2020. Retrieved October 2, 2020 . ↑ "2020 House Ratings" . FiveThirtyEight . August 12, 2020. Archived from the original on October 25, 2020. Retrieved October 15, 2020 . 1 2 Akin, Stephanie (December 10, 2019). "Florida Republican Ted Yoho announces he won't seek a fifth term" . Roll Call . Retrieved December 12, 2019 . ↑ Gancarski, A.G. (December 13, 2019). "Former Ted Yoho staffer Kat Cammack launches run for his Congressional seat" . Florida Politics . Retrieved December 18, 2019 . ↑ "Ryan Chamberlin" . Ballotpedia . Retrieved June 20, 2020 . ↑ Swirko, Cindy (January 17, 2020). "Braddy to run for congress, former colleague Chase may, too" . The Gainesville Sun . Retrieved January 21, 2020 . 1 2 Martinez, Aurora (August 9, 2020). "Who are Florida's 3rd Congressional District Republican candidates?" . The Independent Florida Alligator . Retrieved August 10, 2020 . ↑ Derby, Kevin (June 19, 2019). "GOP Congressional Hopeful Amy Pope Wells: I Voluntarily Gave Up My Nursing License" . Retrieved August 13, 2019 . ↑ Wilson, Drew (January 6, 2020). "Gavin Rollins enters race for CD 3" . Florida Politics . Retrieved January 6, 2020 . ↑ Derby, Kevin (October 21, 2019). "Republican Judson Sapp Launches Bid for Congress in North Florida |" . ↑ Wilson, Drew (January 10, 2020). "James St. George joins crowded Republican primary for CD 3" . Florida Politics . Retrieved January 14, 2020 . ↑ Derby, Kevin (April 22, 2019). "Amy Pope Wells Launches Congressional Bid in North Florida" . Florida Daily. Retrieved April 23, 2019 . ↑ Swirko, Cindy (January 17, 2020). "Braddy to run for congress, former colleague Chase may, too" . The Gainesville Sun . Retrieved January 21, 2020 . ↑ "Republican candidate Ed Braddy drops out of race for Congressman Ted Yoho's seat" . WCJB . January 30, 2020. Retrieved February 5, 2020 . ↑ "Home Election Article Ocala Mayor Kent Guinn to run for open District 3 seat" . 20 WCJB – ABC . December 11, 2019. Retrieved December 18, 2019 . ↑ Medina, Carlos E. "Ocala's Kent Guinn withdraws from congressional race" . Gainesville Sun . Retrieved August 1, 2020 . 1 2 Fineout, Gary; Dixon, Matt; Brown, Matthew (December 11, 2019). "How impeachment may play in the state Capitol — Navy suspends military training for Saudis — Yoho leaving Congress — Getting ready to dump voters from the rolls" . Politico . Retrieved December 12, 2019 . ↑ Derby, Kevin (April 8, 2020). "Rand Paul Endorses Kat Cammack to Replace Ted Yoho in Congress | " . ↑ Kat, Team (June 17, 2020). "Honorable Denise Grimsley Endorses Cammack's Run for FL-03" . Kat for Congress . Retrieved August 1, 2020 . ↑ Kat, Team (July 6, 2020). "Prominent law enforcement organization throws its support behind Kat Cammack in FL-03" . Kat for Congress . Retrieved August 1, 2020 . ↑ Administrator, System (July 15, 2020). "RLC Endorses Kat Cammack in Florida's 3rd Congressional District" . Retrieved August 1, 2020 . ↑ Kirkl, Jordan (May 6, 2020). "Kat Cammack picks up Tea Party Express endorsement" . The Capitolist . Retrieved August 1, 2020 . ↑ "Citizens Fund Endorses Kat Cammack for Congress" . July 15, 2020. Archived from the original on July 24, 2020. Retrieved August 1, 2020 . 1 2 Wilson, Drew (April 16, 2020). "Todd Chase raises $163K, snags endorsements in crowded CD 3 race" . Retrieved August 1, 2020 . ↑ Schorsch, Peter (June 12, 2020). "Gavin Rollins lands Anthony Sabatini endorsement at the worst possible time" . Retrieved August 1, 2020 . 1 2 Gancarski, A.G. (December 13, 2019). "Former Ted Yoho staffer Kat Cammack launches run for his Congressional seat" . Florida Politics. ↑ Wilson, Drew (December 18, 2019). "Cliff Stearns endorses Judson Sapp for CD 3" . Florida Politics. ↑ "Chuck Brannan endorses Judson Sapp for CD 3" . June 4, 2020. Archived from the original on June 22, 2020. Retrieved August 1, 2020 . 1 2 "Endorsements" . Archived from the original on August 15, 2020. Retrieved August 1, 2020 . ↑ Wilson, Drew (June 9, 2020). "Jason Fischer endorses Judson Sapp for CD 3" . Retrieved August 1, 2020 . ↑ Engels, Jacob (April 15, 2020). "Dana Loesch Backs Campaign of Trump Victory Committee Member" . Archived from the original on February 3, 2023. Retrieved August 1, 2020 . ↑ "Roger Stone endorses Judson Sapp for Congress" . April 22, 2020. Retrieved August 1, 2020 . ↑ WCJB Staff (June 18, 2020). "Neal Dunn endorses James Saint George as third district member of congress" . wcjb.com . Retrieved August 1, 2020 . ↑ Meer Research ↑ WPA Intelligence ↑ Americana Analytics/Judson Sapp ↑ Clearview Research ↑ Meer Research 1 2 3 Martinez, Aurora (August 10, 2020). "Who are Florida's 3rd Congressional District Democratic candidates?" . The Independent Florida Alligator . Retrieved August 10, 2020 . ↑ Marianne Williamson [@marwilliamson] (June 12, 2020). "New progressive candidate Adam Christensen FL-03 on our endorsement list! From healthcare for all to economic & racial justice, let's push to make this happen NOW.https://secure.actblue.com/donate/marianneendorses" (Tweet ). Retrieved January 22, 2021 – via Twitter . ↑ "Adam Christensen For Congress" . www.facebook.com . Retrieved August 1, 2020 . ↑ "2020 House Ratings" . FiveThirtyEight . August 12, 2020. Archived from the original on October 27, 2020. Retrieved October 15, 2020 . ↑ "2020 Florida U.S. House - District 3 Election Results" . Jacksonville.com . November 2020. Retrieved February 5, 2025 . ↑ https://docquery.fec.gov/cgibin/forms/H6FL04105/1313401/%5B%5D ↑ "4th Congressional District candidate Erick Aguilar guest of Tea Party" . Historic City News . August 9, 2020. Retrieved August 10, 2020 . ↑ Bortzfield, Bill (November 13, 2019). "Donna Deegan Challenges US Rep. Rutherford" . WJCT . Retrieved November 15, 2019 . ↑ "Monica DePaul's Possible Future Political Ambitions" . facebook.com . ↑ "Monica DePaul" . Ballotpedia . Retrieved August 1, 2020 . ↑ "Donna Deegan, candidate for Congressional District 4 gains North Florida Central Labor Council AFL-CIO endorsement" . Fernandina Observer . June 30, 2020. Retrieved July 5, 2020 . 1 2 3 4 5 6 7 8 9 10 11 "Sierra Club #ClimateVoter Guide: Endorsements" . Sierra Club . March 19, 2021. 1 2 3 4 5 6 7 8 9 10 11 12 13 14 15 "Candidates and Races – Candidate Tracking system – Florida Division of Elections – Department of State" . dos.elections.myflorida.com . Retrieved October 2, 2020 . ↑ YouTube ↑ "2020 House Ratings" . FiveThirtyEight . August 12, 2020. Archived from the original on October 20, 2020. Retrieved October 15, 2020 . ↑ University of North Florida Archived October 13, 2020, at the Wayback Machine ↑ St. Pete Polls/Florida Politics ↑ Gancarski, A.G. (February 15, 2019). "Al Lawson draws primary challenge" . Florida Politics. Retrieved April 11, 2019 . 1 2 Bauerlein, David (August 10, 2020). "Congressman Al Lawson faces opposition from Jacksonville residents Chester and Holloway" . Florida Times-Union . Retrieved August 10, 2020 . ↑ "2020 Endorsements" . Humane Society Legislative Fund . 1 2 3 4 5 6 7 8 "2020 Endorsements" . plannedparenthoodaction.org . Planned Parenthood Action Fund. Archived from the original on November 15, 2019. Retrieved January 27, 2020 . ↑ Schorsch, Peter (August 6, 2020). "CD 5 candidate Gary Adler has Election Day court date" . Florida Politics . Retrieved August 10, 2020 . ↑ "2020 House Ratings" . FiveThirtyEight . August 12, 2020. Archived from the original on October 19, 2020. Retrieved October 15, 2020 . ↑ "2020 Florida U.S. House - District 5 Election Results" . Jacksonville.com . November 17, 2020. Retrieved February 7, 2025 . 1 2 Harper, Mark (July 11, 2020). "Democrats' choice for Congress: Clint Curtis or Richard Thripp" . The Daytona Beach News-Journal . Retrieved August 10, 2020 . ↑ Zaffiro-Kean, Eileen. "Alan Grayson to run in 6th District as a write-in, puzzling other candidates" . Daytona Beach News-Journal Online . Retrieved August 1, 2020 . ↑ "2020 House Ratings" . FiveThirtyEight . August 12, 2020. Archived from the original on October 20, 2020. Retrieved October 15, 2020 . 1 2 3 4 "NRCC Announces 55 Offensive Targets for the 2020 Cycle" . NRCC . February 8, 2019. Retrieved October 16, 2020 . ↑ Peters, Xander (March 20, 2019). "Central Florida Rep. Stephanie Murphy is officially running for a third term" . Orlando Weekly . Archived from the original on March 26, 2019. Retrieved March 26, 2019 . 1 2 3 4 5 6 Powers, Scott (January 22, 2020). "Stephanie Murphy picks up endorsements for reelection bid" . Florida Politics. Retrieved June 24, 2023 . ↑ Powers, Scott (November 6, 2019). "Leo Valentin joins Republican field seeking to take on Stephanie Murphy" . Florida Politics. Retrieved November 6, 2019 . 1 2 Jacobson, Louis (July 24, 2020). "Ranking Florida's congressional delegation for vulnerability this election year" . Tampa Bay Times . Retrieved August 10, 2020 . ↑ Powers, Scott (July 3, 2019). "Republican Jan Edwards exits CD 7 contest" . Florida Politics. Retrieved July 3, 2019 . ↑ YouTube ↑ "2020 House Ratings" . FiveThirtyEight . August 12, 2020. Archived from the original on October 25, 2020. Retrieved October 15, 2020 . 1 2 Gravis Marketing/Orlando Politics ↑ "2020 Florida U.S. House - District 7 Election Results" . Jacksonville.com . November 17, 2020. Retrieved February 7, 2025 . 1 2 Powers, Scott (August 7, 2020). "Scott Caine gives Bill Posey a run for his money in CD 8" . Florida Politics . Retrieved August 10, 2020 . 1 2 3 4 Berman, Dave. "Retired Air Force colonel to challenge Posey in GOP congressional primary" . Florida Today . Retrieved October 2, 2020 . ↑ "2020 House Ratings" . FiveThirtyEight . August 12, 2020. Archived from the original on October 25, 2020. Retrieved October 15, 2020 . ↑ "2020 Florida U.S. House - District 8 Election Results" . Jacksonville.com . November 17, 2020. Retrieved February 8, 2025 . ↑ "Darren Soto" . Darren Soto . ↑ Powers, Scott (June 20, 2019). "Democrat Hendrith Smith files to challenge Darren Soto in CD 9" . Florida Politics. Retrieved June 20, 2019 . ↑ Powers, Scott (October 14, 2019). "Democrat Hendrith Smith drops primary challenge to Darren Soto" . Retrieved January 10, 2020 . ↑ Powers, Scott (April 12, 2019). "Republican Bill Olson files to run in CD 9" . Florida Politics. Retrieved May 5, 2019 . 1 2 "Meet the candidates for key primary races in Central Florida on Aug. 18" . Orlando Sentinel . Retrieved August 10, 2020 . ↑ Powers, Scott (May 10, 2019). "Republican Sergio Garcia enters CD 9 contest" . Florida Politics. Retrieved May 10, 2019 . ↑ "Rallison for Congress" . Rallison for Congress . Retrieved October 2, 2020 . [ permanent dead link ] ↑ WESH ↑ "2020 House Ratings" . FiveThirtyEight . August 12, 2020. Archived from the original on October 18, 2020. Retrieved October 15, 2020 . ↑ "Val Demings for Congress" . 1 2 Lemongello, Steven (July 31, 2020). "Two Republicans battle to take on U.S. Rep. Val Demings in November" . Orlando Sentinel . Retrieved August 10, 2020 . ↑ "2020 House Ratings" . FiveThirtyEight . August 12, 2020. Archived from the original on October 17, 2020. Retrieved October 15, 2020 . ↑ Ogles, Jacob (November 26, 2018). "Dana Cottrell already poised for another long shot congressional run" . Florida Politics . Retrieved August 10, 2020 . ↑ Wright, Mike (November 27, 2017). "Hernando man hopes to unseat Webster" . Chronicle Online . Retrieved October 6, 2020 . ↑ Wilson, Drew (February 18, 2020). "Daniel Webster holding Tallahassee fundraiser Wednesday" . Florida Politics . Retrieved October 6, 2020 . ↑ "2020 House Ratings" . FiveThirtyEight . August 12, 2020. Archived from the original on October 17, 2020. Retrieved October 15, 2020 . ↑ Galofaro, Claire; Stafford, Kat (August 6, 2020). "Black women run for office in historic numbers" . The Christian Science Monitor . Retrieved August 10, 2020 . ↑ "LPAC announces 9 June endorsements for the 2020 cycle" . Team LPAC . June 25, 2020. Retrieved July 21, 2020 . ↑ "Michael S. Knezevich | Vote MSK | 12th Congressional District Florida" . MSK for Congress . Retrieved October 8, 2020 . ↑ "2020 House Ratings" . FiveThirtyEight . August 12, 2020. Archived from the original on October 17, 2020. Retrieved October 15, 2020 . ↑ "2020 Florida U.S. House - District 12 Election Results" . Jacksonville.com . November 17, 2020. Retrieved February 8, 2025 . 1 2 3 Frank. "Candidates and Races – Candidate Tracking system – Florida Division of Elections – Department of State" . dos.elections.myflorida.com . ↑ Connon, Courtnee (July 28, 2020). "LCV Action Fund Endorses Charlie Crist for Re-Election" . League of Conservation Voters . ↑ "NARAL Announces New Slate of Endorsements for 2020" . NARAL Pro-Choice America . April 11, 2019. Archived from the original on August 12, 2020. Retrieved January 27, 2020 . ↑ Irwin Taylor, Janelle (September 16, 2019). "Fifth Republican joins fight to topple Charlie Crist" . Florida Politics. Retrieved September 16, 2019 . 1 2 Irwin Taylor, Janelle (May 14, 2019). "Charlie Crist draws second Republican challenger" . Florida Politics. Retrieved May 14, 2019 . ↑ Irwin Taylor, Janelle (February 2, 2019). "Sheila Griffin considers challenging Charlie Crist in 2020" . Florida Politics . Retrieved August 7, 2019 . ↑ Irwin Taylor, Janelle (August 6, 2019). " . Florida Politics . Retrieved August 7, 2019 . ↑ Irwin Taylor, Janelle (April 20, 2020). "Matt Becker drops congressional bid as COVID-19 forces attention to his business" . Florida Politics. Retrieved April 21, 2020 . ↑ Irwin Taylor, Janelle (July 17, 2019). "Fourth GOP challenger enters race to unseat Charlie Crist" . Florida Politics. Retrieved July 17, 2019 . ↑ Taylor, Janelle Irwin (November 6, 2019). "Political outsider becomes sixth GOP candidate hoping to topple Charlie Crist" . Retrieved November 13, 2019 . ↑ Solomon, Josh (August 7, 2020). "Sharon Newby drops out of congressional race and endorses Anna Paulina Luna" . Tampa Bay Times . Retrieved August 11, 2020 . ↑ "Matt Gaetz endorses Anna Paulina Luna, a Republican running for Congress in St. Pete" . Tampa Bay Times. November 6, 2019. ↑ "STEFANIK'S E-PAC ENDORSES SIX NEW "RISING STAR" GOP WOMEN CANDIDATES" . September 10, 2020. Archived from the original on September 13, 2020. Retrieved September 11, 2020 . ↑ Solomon, Josh (August 19, 2020). "President Trump endorses Anna Paulina Luna's bid to unseat Charlie Crist" . tampabay.com . Retrieved September 12, 2020 . ↑ Former St. Petersburg Mayor Bill Foster Endorses Anna Paulina Luna ↑ Wilson, Drew (May 28, 2020). "Students for Trump endorses Anna Paulina Luna for CD 13" . Florida Politics . 1 2 3 4 5 6 Endorsements for Amanda Makki ↑ Makki, Team (June 18, 2020). "First Female Combat Veteran to Serve in U.S Senate Endorses Amanda Makki" . Amanda Makki for Co . Archived from the original on July 1, 2020. Retrieved August 1, 2020 . ↑ Makki, Team (February 29, 2020). "Conservative Pinellas Republican State Representative Endorses Amanda Makki" . Amanda Makki for Co . Archived from the original on July 6, 2020. Retrieved August 1, 2020 . ↑ Hayes, Kelly (July 24, 2020). "Fraternal Order of Police backs Republican Amanda Makki in CD 13" . Retrieved August 1, 2020 . ↑ "FreedomWorks for America Endorses Amanda Makki in Florida's 13th Congressional District" . August 27, 2019. 1 2 "2020 Candidates" . Maggie's List . Retrieved February 27, 2020 . ↑ "Post" . Amanda Makki for Co . Retrieved August 1, 2020 . [ permanent dead link ] ↑ "Post" . Amanda Makki for Co . Retrieved August 1, 2020 . [ permanent dead link ] ↑ "National Republican Congressional Committee endorses Amanda Makki" . August 16, 2019. Archived from the original on April 12, 2020. Retrieved April 12, 2020 . ↑ "Republican Main Street Partnership PAC Announces Endorsement of Amanda Makki (FL-13) for Congress" . Republican Mainstreet Partnership PAC . January 20, 2020. Archived from the original on August 11, 2020. Retrieved August 1, 2020 . ↑ "Post" . Amanda Makki for Co . Retrieved August 1, 2020 . [ permanent dead link ] ↑ Makki, Team (March 1, 2020). "SEAL Team Six Member Who Shot Osama bin Laden Endorses Amanda Makki" . Amanda Makki for Co . Archived from the original on July 6, 2020. Retrieved August 1, 2020 . ↑ St. Pete Polls ↑ St. Pete Polls ↑ "Home" . Jacobcurnowcongress . Archived from the original on October 11, 2020. Retrieved October 8, 2020 . ↑ "2020 House Ratings" . FiveThirtyEight . August 12, 2020. Archived from the original on October 19, 2020. Retrieved October 15, 2020 . 1 2 St. Pete Polls ↑ St. Pete Polls/FloridaPolitics ↑ "Alix C. Toulme Jr. for Congress" (PDF) . Federal Election Commission . February 4, 2018. Retrieved October 8, 2020 . 1 2 "U.S. House races: Times editorial board recommendations" . Tampa Bay Times . July 24, 2020. Retrieved August 11, 2020 . ↑ "MEET ROB" . wunderlich2020 . Archived from the original on October 20, 2020. Retrieved October 8, 2020 . ↑ "2020 House Ratings" . FiveThirtyEight . August 12, 2020. Archived from the original on October 20, 2020. Retrieved October 15, 2020 . 1 2 3 Kozloski, Kory (August 15, 2019). "MEMO: DCCC Expands Offensive Battlefield to 39 Districts" . DCCC . Retrieved October 16, 2020 . ↑ March, William (March 17, 2020). "Lakeland Commissioner files to challenge Rep. Ross Spano in GOP primary Lakeland Commissioner files to challenge Rep. Ross Spano in GOP primary" . Tampa Bay Times . Retrieved April 10, 2020 . ↑ "FEC Form 2 for Report FEC-1314915" . docquery.fec.gov . 1 2 3 4 5 White, Gary (November 27, 2019). "Will Ross Spano face a GOP primary challenge?" . Tampa Bay Times . Retrieved November 29, 2019 . ↑ "Matt Gaetz backs Ross Spano opponent Scott Franklin" . Tampa Bay Times . ↑ Hayes, Kelly (July 22, 2020). "Grady Judd disses Ross Spano with Scott Franklin endorsement" . Florida Politics . Retrieved August 3, 2020 . ↑ March, William (June 12, 2020). "Prominent local Republicans call for resignation of Hillsborough GOP chairman" . Tampa Bay Times . Retrieved June 24, 2020 . 1 2 3 March, William (March 25, 2020). "Lakeland Commissioner faces challenges but poses a threat in bid to unseat Spano" . Tampa Bay Times . Retrieved April 12, 2020 . 1 2 3 4 5 6 7 8 9 10 11 "ENDORSEMENTS" . Ross Spano . Archived from the original on July 20, 2020. Retrieved July 19, 2020 . 1 2 "Florida Grades & Endorsements" . nrapvf.org . NRA-PVF. Archived from the original on November 3, 2020. Retrieved February 15, 2023 . ↑ St. Pete Polls ↑ Anderson, Zac (September 9, 2019). "Former Sarasota television anchor Alan Cohn running for Congress" . Sarasota Herald-Tribune . Retrieved September 9, 2019 . ↑ Contorno, Steve (July 29, 2019). "Democrat and Navy vet Adam Hattersley challenging Republican Ross Spano for east Hillsborough House seat" . Tampa Bay Times . Retrieved July 29, 2019 . ↑ White, Gary (August 7, 2020). "3 Dems in race to flip US House-15 seat" . The Ledger . Retrieved August 11, 2020 . ↑ "Kel Britvec" . Ballotpedia . Retrieved August 1, 2020 . ↑ Taylor, Janelle Irwin (July 31, 2019). "Completing the swap, Andrew Learned files for Adam Hattersley's seat" . Florida Politics . Retrieved August 1, 2019 . ↑ Miller, Loretta L. (March 23, 2019). "FEC FORM 2" (PDF) . Federal Election Commission . Retrieved November 29, 2019 . ↑ "Loretta Lax Miller" . Ballotpedia . Retrieved August 1, 2020 . ↑ March, William (November 28, 2018). "Democrats eye 15th Congressional District for 2020" . Tampa Bay Times . Retrieved February 15, 2019 . 1 2 3 4 5 6 7 8 9 10 11 12 13 14 15 16 17 18 19 20 21 22 "Endorsements" . Adam Hattersley for Congress, District 15 . Archived from the original on April 13, 2020. Retrieved April 12, 2020 . ↑ "Former President Barack Obama Endorses Alan Cohn, Democratic Candidate for Florida's 15th Congressional District" . Orlando Political Observer (Orlando Politics) . September 25, 2020. Archived from the original on October 19, 2020. Retrieved September 28, 2020 . 1 2 3 4 "Alan Cohn for Congress" . Alan Cohn for Congress . Archived from the original on August 3, 2020. Retrieved August 7, 2020 . 1 2 Contorno, Steve (December 11, 2019). "Some big time Florida Democrats are taking opposing sides in a critical congressional race" . Tampa Bay Times . Retrieved April 12, 2020 . 1 2 3 4 5 6 7 8 Taylor, Janelle Irwin (September 8, 2020). "Alan Cohn nabs 14 endorsements in race for CD 15" . ↑ Taylor, Janelle Irwin (February 25, 2020). "Philip Levine endorses Alan Cohn for Congress" . Florida Politics . Retrieved April 10, 2020 . 1 2 "News Anchor Running For Congress To Make A Change" . The Young Turks . September 25, 2019. Retrieved August 6, 2020 . 1 2 3 Taylor, Janelle Irwin (February 10, 2020). "Another union endorses Alan Cohn for Congress" . Florida Politics . Retrieved April 11, 2020 . ↑ "Alan's Endorsements Include" . Alan Cohn for Congress . Archived from the original on August 16, 2020. Retrieved August 6, 2020 . ↑ "Jewish Dems Endorse Alan Cohn" . Archived from the original on October 22, 2020. Retrieved September 28, 2020 . ↑ March, William (July 18, 2020). "Cohn leads in fundraising and Kathy Castor backs Hattersley in tight CD 15 race" . Tampa Bay Times . Retrieved July 19, 2020 . 1 2 3 Taylor, Janelle Irwin (September 19, 2019). "Adam Hattersley announces trove of endorsements" . Florida Politics . Retrieved April 12, 2020 . ↑ Taylor, Janelle Irwin (December 11, 2019). "Congressional Blue Dog Coalition endorses Adam Hattersley" . Florida Politics . Retrieved April 12, 2020 . ↑ Fineout, Gary; Dixon, Matt (July 28, 2020). "GOP congressman has allies despite investigation — Senate Dems line up behind Jones — Florida adds back work requirements for food stamps — Scary seeds in the mail?" . Politico . Retrieved August 6, 2020 . ↑ March, William (May 4, 2020). "Former detective who sued Sheriff's Office files to run against Chronister" . Tampa Bay Times . Retrieved June 24, 2020 . ↑ "2020 House Ratings" . FiveThirtyEight . August 12, 2020. Archived from the original on October 25, 2020. Retrieved October 15, 2020 . ↑ Change Research (D) ↑ St. Pete Polls ↑ GQR Research (D) ↑ "2020 Florida U.S. House - District 15 Election Results" . Jacksonville.com . November 17, 2020. Retrieved February 8, 2025 . ↑ Ogles, Jacob (July 22, 2019). "It's official: Margaret Good is running for Congress" . Florida Politics . 1 2 3 "Second Wave of 2020 Endorsements" . Medium . September 25, 2020. ↑ Schriock, Stephanie (November 20, 2019). "EMILY'S LIST ENDORSES MARGARET GOOD IN FLORIDA'S 16TH CONGRESSIONAL DISTRICT" . 1 2 "Florida Focus" . High School Democrats of America . Archived from the original on September 13, 2020. Retrieved September 3, 2020 . ↑ Rich, Aliyah (November 14, 2019). "LCV Action Fund Endorses Margaret Good for Congress" . League of Conservation Voters . ↑ "NARAL Pro-Choice America Endorses Margaret Good for Congress" . NARAL Pro-Choice America . January 8, 2020. ↑ "2020 House Ratings" . FiveThirtyEight . August 12, 2020. Archived from the original on October 17, 2020. Retrieved October 15, 2020 . ↑ Data Targeting (R) ↑ Data Targeting (R) ↑ Change Research (D) ↑ Data Targeting (R) 1 2 Global Strategy Group (D) 1 2 Data Targeting (R) ↑ Global Strategy Group (D) ↑ Data Targeting (R) ↑ "2020 Florida U.S. House - District 16 Election Results" . Jacksonville.com . November 17, 2020. Retrieved February 8, 2025 . ↑ Ogles, Jacob (January 20, 2020). "Allen Ellison to be roasted by Cindy Banyai at black-tie fundraiser in Sebring" . Florida Politics . Retrieved August 11, 2020 . ↑ Chambliss, John (September 25, 2003). "Coach Arrested on Molestation Charge" . The Ledger . Retrieved October 9, 2020 . [ permanent dead link ] ↑ "2020 House Ratings" . FiveThirtyEight . August 12, 2020. Archived from the original on October 18, 2020. Retrieved October 15, 2020 . ↑ "2020 Florida U.S. House - District 17 Election Results" . Jacksonville.com . November 17, 2020. Retrieved February 8, 2025 . ↑ Nicol, Ryan (October 11, 2019). "Brian Mast nets $600K as he faces Democratic challenger" . Retrieved October 23, 2019 . ↑ Nicol, Ryan (July 16, 2020). "Brian Mast now holds $1.8 million in cash on hand after another strong fundraising quarter" . Florida Politics . Retrieved August 11, 2020 . ↑ Nicol, Ryan (August 7, 2020). "Pam Keith ad says Brian Mast 'betrayed' CD 18 voters" . Florida Politics . Retrieved August 11, 2020 . ↑ Powers, Scott (October 2, 2019). "Democrat Oz Vazquez files to take on Brian Mast in CD 18" . Florida Politics . Retrieved October 5, 2019 . ↑ Nicol, Ryan (June 22, 2020). "Former presidential candidate Elizabeth Warren backs Pam Keith in CD 18" . Florida Politics. Retrieved April 1, 2024 . ↑ Cori Bush [@CoriBush] (August 21, 2020). "#BREAKING: I'm proud to announce my official endorsements of @AdrBell, @PamKeithFL, @paulajean2020, @Bradshaw2020, and Sen. @EdMarkey! This is our moment!" (Tweet ). Retrieved August 21, 2020 – via Twitter . ↑ Nicol, Ryan (August 14, 2020). "EMILY's List backs Democrat Pam Keith in CD 18 primary" . Florida Politics. Retrieved April 1, 2024 . ↑ "VoteVets Endorses Pam Keith for Congress" . VoteVets.org . March 27, 2020. Retrieved August 1, 2020 . 1 2 3 4 Stapleton, Christine (June 3, 2020). "Democrat challenging U.S. Rep. Brian Mast endorsed by district's former congressman" . Treasure Coast Newspapers . Retrieved April 1, 2024 . ↑ Nicol, Ryan (July 24, 2020). "Nikki Fried endorses Oz Vazquez over Pam Keith in CD 18 Democratic primary" . Retrieved August 1, 2020 . ↑ Nicol, Ryan (June 24, 2020). "Florida AFL-CIO endorses Oz Vazquez in CD 18 Democratic primary" . Retrieved August 1, 2020 . ↑ "KW Miller Congressional Committee (FL-18) Issues Legal Notice to TC Palm Newspaper for Printing False and Defamatory Information" . PR Newswire . August 19, 2020. Retrieved September 20, 2020 . ↑ "2020 House Ratings" . FiveThirtyEight . August 12, 2020. Archived from the original on October 19, 2020. Retrieved October 15, 2020 . ↑ Clearview Research (D) ↑ St. Pete Polls ↑ "2020 Florida U.S. House - District 18 Election Results" . Jacksonville.com . November 17, 2020. Retrieved February 8, 2025 . 1 2 Cioffi, Chris (October 19, 2019). "Florida GOP Rep. Francis Rooney not seeking reelection" . Roll Call . Retrieved October 19, 2019 . ↑ Ogles, Jacob (January 6, 2020). "Byron Donalds announces bid for Francis Rooney's congressional seat" . Florida Politics . Retrieved January 6, 2020 . ↑ Ogles, Jacob (January 3, 2020). "Darren Dionne Aquino Brings New York Street Cred to SW Florida Congressional Race |" . Retrieved April 22, 2020 . ↑ Derby, Kevin (March 23, 2020). "Casey Askar Joins Crowded GOP Primary Field Looking to Replace Francis Rooney in Southwest Florida |" . Retrieved April 22, 2020 . ↑ Elias, Dave (September 6, 2019). "Dane Eagle announces he will run for Congressman Rooney's seat" . NBC 2 . Archived from the original on November 7, 2019. Retrieved November 7, 2019 . ↑ Ogles, Jacob (August 20, 2020). "Dane Eagle quick to rally behind former foe Byron Donalds in CD 19" . Florida Politics. Retrieved August 30, 2023 . 1 2 3 Ogles, Jacob (January 6, 2020). "William Figlesthaler ad declares Washington sick, pundits spineless" . Florida Politics . Retrieved February 11, 2020 . ↑ Ogles, Jacob (November 27, 2019). "Randy Henderson enters race for Francis Rooney's congressional seat" . Florida Politics . Retrieved December 2, 2019 . ↑ "Latest poll: Casey Askar, Byron Donalds lead crowded primary in CD 19" . Florida Politics . July 7, 2020. Retrieved July 7, 2020 . ↑ Patrice, Joe (July 20, 2020). "Law Grad Files $25 Million Lawsuit Claiming Law School Expelled Her For Supporting Trump" . Above the Law . Retrieved August 11, 2020 . ↑ Ogles, Jacob (November 12, 2019). "Dan Severson ready to represent conservative region in Congress" . Florida Politics . Retrieved November 16, 2019 . ↑ Braun, Michael (December 3, 2019). "Heather Fitzenhagen joins candidates vying to fill Francis Rooney's congressional seat" . Fort Myers News-Press . Retrieved December 4, 2019 . ↑ Ogles, Jacob (June 17, 2020). "For Heather Fitzenhagen, switch from federal to state campaigns brings list of challenges" . Florida Politics . Retrieved June 17, 2020 . 1 2 3 4 5 6 Ogles, Jacob. "Dane Eagle announces first round of endorsements of congressional bid" . Florida Politics . Retrieved October 25, 2019 . ↑ Ogles, Jacob (November 4, 2019). "Lizbeth Benacquisto won't run for Francis Rooney's seat in 2020" . Florida Politics . Retrieved November 11, 2019 . 1 2 3 4 Ogles, Jacob (October 19, 2019). "Francis Rooney won't seek re-election" . Florida Politics . Retrieved October 20, 2019 . 1 2 Zanona, Melanie; Dixon, Matt; Vasquez, Christian (October 19, 2019). "GOP congressman who was open to impeachment calls it quits" . Politico . Retrieved October 19, 2019 . ↑ "Candidates consider running to replace Congressman Rooney" . nbc-2.com . October 21, 2019. Archived from the original on October 22, 2019. Retrieved October 22, 2019 . ↑ Kapos, Shia; Hurst, Adrienne (October 24, 2019). "LIGHTFOOT'S BUDGET BONANZA — FLORIDA GOP courts OBERWEIS — PENCE's pit stop" . POLITICO . Retrieved October 24, 2019 . ↑ Ogles, Jacob (October 25, 2019). "Spencer Roach a 'hard no' on running for Congress in 2020" . Florida Politics . Retrieved October 25, 2019 . ↑ Ogles, Jacob (December 10, 2019). "Bob Rommel won't run for Congress" . Florida Politics . Retrieved December 10, 2019 . ↑ "Endorsement: Darren Aquino for Congress (FL-19)" . nyyrc.com . New York Young Republican Club . July 19, 2020. Retrieved June 1, 2022 . ↑ Ogles, Jacob (July 21, 2020). "NRA puts support, firepower behind Byron Donalds in CD 19 GOP primary" . Retrieved August 1, 2020 . ↑ "Endorsements" . Archived from the original on August 16, 2020. Retrieved August 1, 2020 . ↑ Ogles, Jacob (November 25, 2019). "Lizbeth Benacquisto endorses Dane Eagle for Congress" . Retrieved August 1, 2020 . ↑ "BREAKING: National Tea Party Leader Officially Endorses Dan Severson for Congress" . Retrieved August 1, 2020 . ↑ Congress, Severson for. "Former Governor Tim Pawlenty Endorses Dan 'Doc' Severson, Retired Navy Top Gun Fighter Pilot, Candidate for SW Florida Congressional District 19" . prnewswire.com (Press release). Retrieved August 1, 2020 . ↑ St. Pete Polls ↑ St. Pete Polls ↑ Data Targeting/Dane Eagle ↑ St. Pete Polls ↑ "Rep. Francis Rooney confirms: No third term for Southwest Florida congressman" . The News-Press . Retrieved October 20, 2019 . ↑ "David Holden joins packed list of candidates vying for seat in congress" . nbc-2.com . January 10, 2020. Archived from the original on January 11, 2020. Retrieved May 25, 2020 . ↑ "Sustainable Planet USA Organization – Home" . sustainableplanetconstruction.com . Retrieved October 11, 2020 . ↑ Ogles, Jacob (December 10, 2019). "Antonio Dumornay will run without party affiliation for Francis Rooney's seat" . Florida Politics . Retrieved October 11, 2020 . ↑ YouTube ↑ "2020 House Ratings" . FiveThirtyEight . August 12, 2020. Archived from the original on October 25, 2020. Retrieved October 15, 2020 . ↑ Man, Anthony (July 2, 2019). "Congressman Alcee Hastings, battling pancreatic cancer, says he'll run for re-election and see Donald Trump's defeat in 2020" . Sun-Sentinel . Retrieved July 2, 2019 . ↑ Washington, Wayne (August 6, 2020). "Lawyer makes second run at long-time incumbent Hastings" . The Palm Beach Post . Archived from the original on August 10, 2020. Retrieved August 12, 2020 . ↑ "Roshan Mody" . Ballotpedia . Retrieved August 1, 2020 . ↑ Clark, Kristen M. (August 3, 2014). "Deutch faces Democratic primary challenge in U.S. House District 21" . The Palm Beach Post . Archived from the original on October 13, 2020. Retrieved October 11, 2020 . ↑ "Morel for Congress 2020" . Morel for Congress . Archived from the original on January 4, 2020. Retrieved November 23, 2019 . ↑ DeGrammont, Vic (June 22, 2020). "Questionnaire: Vic DeGrammont, candidate in the 2020 Republican primary for U.S. House, District 23" . South Florida Sun Sentinel . Retrieved August 12, 2020 . ↑ Derby, Kevin (July 6, 2019). "Alcee Hastings Gears Up to Run Again in 2020" . Retrieved October 23, 2019 . ↑ "2020 House Ratings" . FiveThirtyEight . August 12, 2020. Archived from the original on October 19, 2020. Retrieved October 15, 2020 . ↑ "2020 Florida U.S. House - District 20 Election Results" . Jacksonville.com . November 17, 2020. Retrieved February 9, 2025 . ↑ Bukley, Ron (June 5, 2020). "Guido Weiss Challenging Lois Frankel For U.S. House Seat" . The Town Crier . Retrieved August 12, 2020 . ↑ "Adam Aarons" . Ballotpedia . Retrieved August 1, 2020 . ↑ Sommer, Will (August 2, 2019). "Anti-Muslim Activist Laura Loomer to Run for Congress" . Daily Beast . Retrieved August 2, 2019 . ↑ Derby, Kevin (May 7, 2019). "Lois Frankel Draws Republican Challengers for 2020" . Florida Daily. Retrieved May 7, 2019 . ↑ Nicol, Ryan (August 10, 2020). "Matt Gaetz, Roger Stone endorse Laura Loomer for Congress" . Florida Politics . Retrieved August 12, 2020 . ↑ "AARON SCANLAN PLEDGES SUPPORT FOR TERM LIMITS ON CONGRESS" . July 30, 2019. Retrieved October 23, 2019 . ↑ Stapleton, Christine. "Six GOP candidates compete in U.S. House District 21" . The Palm Beach Post . Retrieved October 11, 2020 . ↑ "MIKE VILARDI PLEDGES SUPPORT FOR TERM LIMITS ON CONGRESS" . July 17, 2019. Retrieved October 23, 2019 . ↑ Manjarres, Javier (June 10, 2019). "Combat veteran Michael Bluemling, Jr challenges Lois Frankel" . Retrieved October 23, 2019 . ↑ Waugh, Danielle (April 22, 2020). "Florida candidates say pandemic puts campaigns in jeopardy" . CBS 12 . Retrieved August 12, 2020 . ↑ Nicol, Ryan (May 6, 2019). "Victor Garcia da Rosa to challenge Lois Frankel in CD 21" . Florida Politics. Retrieved May 7, 2019 . 1 2 3 Cillizza, Chris (August 19, 2020). "A self-described 'proud Islamophobe' banned from social media just won a GOP nomination" . CNN . ↑ Folley, Aris (August 10, 2020). "Matt Gaetz, Roger Stone back far-right activist Laura Loomer in congressional bid" . TheHill . 1 2 3 4 5 "Endorsements" . Retrieved December 25, 2022 . ↑ "Roseanne Barr endorses right-wing activist Laura Loomer for Congress" . Washington Examiner . March 13, 2020. 1 2 "Meet Trump's long-shot candidate running for his Florida district" . Tampa Bay Times . ↑ "Wayne Allyn Root Endorses Laura Loomer For US Congress" – via www.youtube.com. ↑ "Roger Stone's sentencing will influence Laura Loomer's congressional race" . The Floridian . February 12, 2020. ↑ The Washington Sentinel ↑ Nicol, Ryan (October 5, 2020). "Poll: Lois Frankel nearly doubling Laura Loomer's support in new CD 21 survey" . Florida Politics . Retrieved October 11, 2020 . ↑ "2020 House Ratings" . FiveThirtyEight . August 12, 2020. Archived from the original on October 19, 2020. Retrieved October 15, 2020 . ↑ St. Pete Polls/Florida Politics 1 2 Rhodes, Wendy (July 23, 2020). "GOP rivals talk guns, abortion, school reopenings and taking on Ted Deutch" . The Palm Beach Post . Retrieved August 12, 2020 . ↑ Manjarres, Javier (June 29, 2020). "Fran Flynn stands with Trump, defends US flag against Progressives" . The Floridian . Retrieved August 12, 2020 . ↑ Swaffar, Darlene (June 24, 2020). "Questionnaire: Darlene Swaffar, candidate in the 2020 Republican primary for U.S. House, District 22" . South Florida Sun Sentinel . Retrieved August 12, 2020 . ↑ "Endorsement: Jim Pruden is the strongest of four Republicans running in Florida's congressional District 22" . www.sun-sentinel.com . Sun-Sentinel . June 26, 2020. Retrieved May 20, 2022 . ↑ "2020 House Ratings" . FiveThirtyEight . August 12, 2020. Archived from the original on October 25, 2020. Retrieved October 15, 2020 . ↑ "2020 Florida U.S. House - District 22 Election Results" . Jacksonville.com . November 17, 2020. Retrieved February 9, 2025 . ↑ "FEC Form 2 for Report FEC-1322004" . docquery.fec.gov . ↑ Fordin, Spencer (August 10, 2020). "Jen Perelman takes on party and principle in primary bid" . Florida Politics . Retrieved August 12, 2020 . 1 2 "Endorsements – Jen Perelman For Congress FL 23" . Jen Perelman For Congress FL D23 . Archived from the original on August 9, 2020. Retrieved August 1, 2020 . ↑ "Endorsements" . 350 Action . Retrieved March 19, 2020 . ↑ "2020 Candidates" . APIS Org . Retrieved April 16, 2020 . ↑ "Jen Perelman" . Brand New Congress . October 25, 2019. Archived from the original on October 29, 2019. Retrieved October 29, 2019 . ↑ "Home" . Jen 2020 . Archived from the original on June 25, 2020. Retrieved April 4, 2020 . ↑ Sittenfeld, Tiernan (June 5, 2019). "LCV Action Fund Announces First Round of 2020 Environmental Majority Makers" . League of Conservation Voters . LCV Action Fund. ↑ "Sun Sentinel endorsements for August 2020 primary election" . South Florida Sun Sentinel. June 28, 2020. Retrieved July 18, 2020 . 1 2 "Endorsement: Michael Kroske is the better Republican contender for U.S. House, District 23" . South Florida Sun Sentinel . June 24, 2020. Retrieved August 12, 2020 . ↑ Man, Anthony (March 21, 2019). "Republican with ties to Marjory Stoneman Douglas launches campaign against Wasserman Schultz" . Sun-Sentinel . Retrieved May 5, 2019 . ↑ "2020 House Ratings" . FiveThirtyEight . August 12, 2020. Archived from the original on October 17, 2020. Retrieved October 15, 2020 . ↑ Nicol, Ryan (August 12, 2020). "Frederica Wilson scores donation from NFL Players Association in reelection bid" . Florida Politics . Retrieved August 13, 2020 . ↑ Lehtola, Sakinah (June 24, 2020). "Questionnaire: Sakinah Lehtola, candidate U.S. House District 24" . South Florida Sun Sentinel . Retrieved August 13, 2020 . ↑ "2020 Federal Endorsements – NOW PAC" . nowpac.org . ↑ Morejon, Liane (June 14, 2020). "Conservative groups rally in Miami Lakes to have their voices heard" . Local 10 News . Retrieved August 13, 2020 . ↑ "Be a part of the conversation not the exception says Omega" . Libertarian Party of Florida . August 10, 2018. Retrieved September 13, 2020 . ↑ Miller, Michael E. (May 16, 2012). "Howard Knepper, Miami's Presidential Candidate, Wants to Invade Cuba and Protect a Chimp Named Jerome" . Miami New Times . Retrieved October 16, 2020 . ↑ "Christine Alexandria Olivo" . ballotpedia . Retrieved September 13, 2020 . ↑ "2020 House Ratings" . FiveThirtyEight . August 12, 2020. Archived from the original on October 20, 2020. Retrieved October 15, 2020 . ↑ Gamez Torres, Nora; Smiley, David (December 6, 2019). "Cuban-American Democrat who praised Fidel Castro runs for Congress in Miami" . Miami Herald . Retrieved August 12, 2020 . ↑ Nicol, Ryan (April 24, 2020). "Mario Díaz-Balart secures reelection in CD 25 unopposed" . Florida Politics . Retrieved August 13, 2020 . ↑ "2020 House Ratings" . FiveThirtyEight . August 12, 2020. Archived from the original on October 25, 2020. Retrieved October 15, 2020 . ↑ "FEC Form 2 for Report FEC-1332602" . docquery.fec.gov . ↑ Smiley, David; Hanks, Douglas. "Miami-Dade Mayor Gimenez tells supporters he'll announce a run for Congress Wednesday" . Miami Herald . Retrieved January 10, 2020 . ↑ Smiley, David (August 19, 2019). "Fire union chief's candidacy sets up Republican primary in Miami congressional district" . Miami Herald . Retrieved August 19, 2019 . ↑ Derby, Kevin (July 26, 2019). "Even as Carlos Curbelo Passes on Rematch, NRCC Takes Aim at Debbie Mucarsel-Powell" . Florida Daily. Retrieved July 26, 2019 . ↑ Nicol, Ryan (April 3, 2019). "Republican restaurateur Irina Vilariño to challenge Debbie Mucarsel-Powell in CD 26" . Florida Politics. Retrieved April 3, 2019 . ↑ Montellaro, Zach; Arkin, James (April 24, 2020). "Kansas Republicans try to cull the field" . POLITICO . Retrieved August 1, 2020 . ↑ Dixon, Matt; Dobrin, Isabel; Fineout, Gary (July 24, 2019). "Crisis, what crisis in Venezuela? — Curbelo makes a decision (sort of) — Fresen's spending woes — More Epstein charges coming?" . Politico . Retrieved July 24, 2019 . ↑ "FMC's shipper commissioner" . FreightWaves . July 22, 2019. Retrieved August 23, 2019 . ↑ Smiley, David; Hanks, Douglas; Daugherty, Alex. "Hours after launching run for Congress, Miami-Dade mayor wins Trump's endorsement" . Miami Herald . Retrieved January 29, 2020 . 1 2 Unspecified national Republican organization ↑ "Candidates- Black Economic Alliance PAC" . Black Economic Alliance . ↑ "Debbie Mucarsel-Powell" . emilyslist.org . Archived from the original on January 27, 2020. Retrieved January 27, 2020 . ↑ Muller, Tiffany (September 30, 2019). "End Citizens United Endorses Seventeen House Democrats" . End Citizens United . 1 2 "JStreetPAC Candidates" . JStreetPAC . Archived from the original on May 2, 2018. Retrieved January 27, 2020 . ↑ Sittenfeld, Tiernan (June 5, 2019). "LCV Action Fund Announces First Round of 2020 Environmental Majority Makers" . League of Conservation Voters . LCV Action Fund. ↑ Hogue, Ilyse (March 8, 2019). "NARAL Announces First Slate of Frontline Pro-Choice Endorsements for 2020" . NARAL Pro-Choice America . Archived from the original on August 5, 2020. Retrieved January 27, 2020 . ↑ "NewDem Vanguard" . NewDem Action Fund . ↑ "2020 House Ratings" . FiveThirtyEight . August 12, 2020. Archived from the original on October 25, 2020. Retrieved October 15, 2020 . ↑ "2020 Senate Ratings" . Senate Ratings . The Rothenberg Political Report. Retrieved July 31, 2020 . ↑ Meeting Street Insights (R) ↑ "2020 Florida U.S. House - District 26 Election Results" . Jacksonville.com . November 17, 2020. Retrieved February 9, 2025 . ↑ Fineout, Gary (November 3, 2020). "Salazar upsets Shalala in rematch" . Politico . Retrieved February 7, 2025 . ↑ "FEC Form 2 for Report FEC-1327863" . docquery.fec.gov . ↑ "Michael Hepburn (Florida state representative candidate)" . Ballotpedia . Retrieved August 1, 2020 . ↑ "Donna Shalala" . emilyslist.org . Archived from the original on October 23, 2019. Retrieved October 23, 2019 . ↑ Sittenfeld, Tiernan (August 15, 2019). "LCV Action Fund Announces Second Round of 2020 Environmental Majority Makers" . League of Conservation Voters . LCV Action Fund. ↑ "Endorsed Candidates" . National Women's Political Caucus . ↑ Axelrod, Tal (August 1, 2019). "Republican Salazar seeks rematch with Shalala in key Miami House district" . The Hill . Retrieved August 1, 2019 . ↑ Nicol, Ryan (August 5, 2020). "Sheldon Adelson wades into CD 27 contest with maxed-out donation to Maria Elvira Salazar" . Florida Politics . Retrieved August 13, 2020 . ↑ Townsend, Rosa (July 23, 1998). "Raymond Molina Is Alive and Well!" . Miami New Times . Retrieved October 16, 2020 . ↑ Molina, Daniel (October 29, 2020). "Trump Endorses Maria Elvira Salazar over 'Pragmatic Socialist' Shalala" . The Floridian . Retrieved November 3, 2020 . ↑ "Miami Herald" . Miami Herald . Archived from the original on April 16, 2020. Retrieved June 19, 2020 . ↑ "Endorsement: Maria Elvira Salazar For Congress (FL-27)" . nyyrc.com . New York Young Republican Club . January 2, 2020. ↑ "Maria Elvira Salazar" . Susan B. Anthony List . Archived from the original on March 9, 2020. Retrieved February 27, 2020 . ↑ "2020 House Ratings" . FiveThirtyEight . August 12, 2020. Archived from the original on October 25, 2020. Retrieved October 15, 2020 . ↑ Bendixen & Amandi Research (D) ↑ 1892 Polling (R) External links Candidate links Official campaign websites for 1st district candidates
Official campaign websites for 2nd district candidates
Official campaign websites for 3rd district candidates
Official campaign websites for 4th district candidates
Official campaign websites for 5th district candidates
Official campaign websites for 6th district candidates
Official campaign websites for 7th district candidates
Official campaign websites for 8th district candidates
Official campaign websites for 9th district candidates
Official campaign websites for 10th district candidates
Official campaign websites for 11th district candidates
Official campaign websites for 12th district candidates
Official campaign websites for 13th district candidates
Official campaign websites for 14th district candidates
Official campaign websites for 15th district candidates
Official campaign websites for 16th district candidates
Official campaign websites for 17th district candidates
Official campaign websites for 18th district candidates
Official campaign websites for 19th district candidates
Official campaign websites for 20th district candidates
Official campaign websites for 21st district candidates
Official campaign websites for 22nd district candidates
Official campaign websites for 23rd district candidates
Official campaign websites for 24th district candidates
Official campaign websites for 25th district candidates
Official campaign websites for 26th district candidates
Official campaign websites for 27th district candidates
U.S. U.S. U.S. (election ) Governors Attorneys Secretaries State State Alaska Arizona Arkansas California Colorado Connecticut Delaware Florida Georgia Hawaii Idaho Illinois Indiana Iowa Kansas Kentucky Maine Massachusetts Michigan House Minnesota Missouri Montana Nebraska Nevada New Hampshire New Mexico New York North Carolina North Dakota Ohio Oklahoma Oregon Pennsylvania Puerto Rico Rhode Island South Carolina South Dakota Tennessee Texas Utah Vermont Washington West Virginia Wisconsin Wyoming Mayors Bakersfield, CA Baltimore, MD Baton Rouge, LA Clearwater, FL Corpus Christi, TX El Paso, TX Fort Lauderdale, FL Fresno, CA Honolulu, HI Irvine, CA Lubbock, TX Macon, GA Mesa, AZ Miami-Dade County, FL Milwaukee, WI Phoenix, AZ Portland, OR Richmond, VA Riverside, CA Sacramento, CA Salt Lake County, UT San Diego, CA San Juan, PR Santa Ana, CA Stockton, CA Tulsa, OK Virginia Beach, VA Wilmington, DE Winston-Salem, NC Local Bay County, MI Clearwater, FL Cook County, IL DeKalb County, GA Los Angeles, CA Los Angeles County, CA Milwaukee County, WI New Castle County, DE Oakland County, MI Orange County, CA Portland, OR St. Louis County, MO San Diego, CA San Diego County, CA San Francisco, CA Summit County, OH Volusia County, FL Washington, D.C. Will County, IL Statewide Related
This page is based on this
Wikipedia article Text is available under the
CC BY-SA 4.0 license; additional terms may apply.
Images, videos and audio are available under their respective licenses.