| ||||||||||||||||||||||||||||||||||
All 65 seats in the Colorado House of Representatives 33 seats needed for a majority | ||||||||||||||||||||||||||||||||||
---|---|---|---|---|---|---|---|---|---|---|---|---|---|---|---|---|---|---|---|---|---|---|---|---|---|---|---|---|---|---|---|---|---|---|
| ||||||||||||||||||||||||||||||||||
Results: Democratic hold Democratic gain Republican hold Republican gain Vote Share: 50–60% 60–70% 70–80% >90% 40–50% 50–60% 60–70% 70–80% 80–90% >90% | ||||||||||||||||||||||||||||||||||
|
Elections in Colorado |
---|
The 2020 Colorado House of Representatives elections took place on November 3, 2020, with the primary elections held on June 30, 2020. [1] Voters in all 65 districts of the state House elected their representative for a two-year term. [2] It coincided with the state Senate elections and the biennial United States elections. The Democratic Party retained control of the House of Representatives. The Democrats gained the 38th District while the Republicans gained the 47th District, resulting in no net seat change.
In the previous state House election (2018), the Democrats increased their majority to 17 seats, gaining 5 seats, while the Republicans lost 5 seats. [3] Therefore, for Democrats to have lost their absolute majority in the House in this election, Republicans and other parties would have needed to gain at least 9 more seats.
Four Democratic and five Republican incumbents are term-limited and prohibited from seeking a consecutive fifth term. [2]
Source | Ranking | As of |
---|---|---|
The Cook Political Report [8] | Safe D | October 21, 2020 |
Colorado House of Representatives election, 2020 General election – November 3, 2020 [9] [10] | |||||||||
---|---|---|---|---|---|---|---|---|---|
Party | Votes | % | % +/- | Seats | Seats +/- | ||||
Democratic | 1,642,008 | 53.90 | -0.90 | 41 | ±0 | ||||
Republican | 1,331,774 | 43.72 | +1.19 | 24 | ±0 | ||||
Libertarian | 70,239 | 2.31 | +1.60 | 0 | ±0 | ||||
Green | 1,688 | 0.06 | +0.06 | 0 | ±0 | ||||
Unity | 633 | 0.02 | -0.02 | 0 | ±0 | ||||
Valid votes | 3,046,342 | 92.43 | — | — | — | ||||
Blank and invalid votes | 249,324 | 7.57 | — | — | — | ||||
Totals | 3,295,666 | 100 | — | 80 | — | ||||
Registered voter/turnout | 3,793,790 | 86.87 |
District | Incumbent | Party | Elected | Party | ||
---|---|---|---|---|---|---|
1 | Susan Lontine | Dem | Susan Lontine | Dem | ||
2 | Alec Garnett | Dem | Alec Garnett | Dem | ||
3 | Meg Froelich | Dem | Meg Froelich | Dem | ||
4 | Serena Gonzales-Gutierrez | Dem | Serena Gonzales-Gutierrez | Dem | ||
5 | Alex Valdez | Dem | Alex Valdez | Dem | ||
6 | Steven Woodrow | Dem | Steven Woodrow | Dem | ||
7 | James Coleman | Dem | Jennifer Bacon | Dem | ||
8 | Leslie Herod | Dem | Leslie Herod | Dem | ||
9 | Emily Sirota | Dem | Emily Sirota | Dem | ||
10 | Edie Hooton | Dem | Edie Hooton | Dem | ||
11 | Jonathan Singer | Dem | Karen McCormick | Dem | ||
12 | Sonya Jaquez Lewis | Dem | Tracey Bernett | Dem | ||
13 | KC Becker | Dem | Judy Amabile | Dem | ||
14 | Shane Sandridge | Rep | Shane Sandridge | Rep | ||
15 | Dave Williams | Rep | Dave Williams | Rep | ||
16 | Larry Liston | Rep | Andres G. Pico | Rep | ||
17 | Tony Exum | Dem | Tony Exum | Dem | ||
18 | Marc Snyder | Dem | Marc Snyder | Dem | ||
19 | Tim Geitner | Rep | Tim Geitner | Rep | ||
20 | Terri Carver | Rep | Terri Carver | Rep | ||
21 | Lois Landgraf | Rep | Mary Bradfield | Rep | ||
22 | Colin Larson | Rep | Colin Larson | Rep | ||
23 | Chris Kennedy | Dem | Chris Kennedy | Dem | ||
24 | Monica Duran | Dem | Monica Duran | Dem | ||
25 | Lisa Cutter | Dem | Lisa Cutter | Dem | ||
26 | Dylan Roberts | Dem | Dylan Roberts | Dem | ||
27 | Brianna Titone | Dem | Brianna Titone | Dem | ||
28 | Kerry Tipper | Dem | Kerry Tipper | Dem | ||
29 | Tracy Kraft-Tharp | Dem | Lindsey N. Daugherty | Dem | ||
30 | Dafna Michaelson Jenet | Dem | Dafna Michaelson Jenet | Dem | ||
31 | Yadira Caraveo | Dem | Yadira Caraveo | Dem | ||
32 | Adrienne Benavidez | Dem | Adrienne Benavidez | Dem | ||
33 | Matt Gray | Dem | Matt Gray | Dem | ||
34 | Kyle Mullica | Dem | Kyle Mullica | Dem | ||
35 | Shannon Bird | Dem | Shannon Bird | Dem | ||
36 | Mike Weissman | Dem | Mike Weissman | Dem | ||
37 | Tom Sullivan | Dem | Tom Sullivan | Dem | ||
38 | Richard Champion | Rep | David Ortiz | Dem | ||
39 | Mark Baisley | Rep | Mark Baisley | Rep | ||
40 | Janet Buckner | Dem | Naquetta Ricks | Dem | ||
41 | Jovan Melton | Dem | Iman Jodeh | Dem | ||
42 | Dominique Jackson | Dem | Dominique Jackson | Dem | ||
43 | Kevin Van Winkle | Rep | Kevin Van Winkle | Rep | ||
44 | Kim Ransom | Rep | Kim Ransom | Rep | ||
45 | Patrick Neville | Rep | Patrick Neville | Rep | ||
46 | Daneya Esgar | Dem | Daneya Esgar | Dem | ||
47 | Bri Buentello | Dem | Stephanie Luck | Rep | ||
48 | Stephen Humphrey | Rep | Tonya Van Beber | Rep | ||
49 | Perry Buck | Rep | Mike Lynch | Rep | ||
50 | Mary Young | Dem | Mary Young | Dem | ||
51 | Hugh McKean | Rep | Hugh McKean | Rep | ||
52 | Cathy Kipp | Dem | Cathy Kipp | Dem | ||
53 | Jennifer Arndt | Dem | Jennifer Arndt | Dem | ||
54 | Matt Soper | Rep | Matt Soper | Rep | ||
55 | Janice Rich | Rep | Janice Rich | Rep | ||
56 | Rod Bockenfeld | Rep | Rod Bockenfeld | Rep | ||
57 | Perry Will | Rep | Perry Will | Rep | ||
58 | Marc Catlin | Rep | Marc Catlin | Rep | ||
59 | Barbara McLachlan | Dem | Barbara McLachlan | Dem | ||
60 | James Wilson | Rep | Ron Hanks | Rep | ||
61 | Julie McCluskie | Dem | Julie McCluskie | Dem | ||
62 | Donald Valdez | Dem | Donald Valdez | Dem | ||
63 | Lori Saine | Rep | Dan Woog | Rep | ||
64 | Richard Holtorf | Rep | Richard Holtorf | Rep | ||
65 | Rod Pelton | Rep | Rod Pelton | Rep |
Bold - Gain
Italicize - Hold, new member
Seats where the margin of victory was under 10%:
District 1 • 2 • 3 • 4 • 5 • 6 • 7 • 8 • 9 • 10 • 11 • 12 • 13 • 14 • 15 • 16 • 17 • 18 • 19 • 20 • 21 • 22 • 23 • 24 • 25 • 26 • 27 • 28 • 29 • 30 • 31 • 32 • 33 • 34 • 35 • 36 • 37 • 38 • 39 • 40 • 41 • 42 • 43 • 44 • 45 • 46 • 47 • 48 • 49 • 50 • 51 • 52 • 53 • 54 • 55 • 56 • 57 • 58 • 59 • 60 • 61 • 62 • 63 • 64 • 65 |
Party | Candidate | Votes | % | |
---|---|---|---|---|
Democratic | Susan Lontine (incumbent) | 11,644 | 100.0 | |
Total votes | 11,644 | 100.0 |
Party | Candidate | Votes | % | |
---|---|---|---|---|
Republican | Samantha Koch | 3,777 | 100.0 | |
Total votes | 3,777 | 100.0 |
Party | Candidate | Votes | % | |
---|---|---|---|---|
Democratic | Susan Lontine (incumbent) | 22,584 | 66.36 | |
Republican | Samantha Koch | 11,448 | 33.64 | |
Total votes | 34,032 | 100.0 | ||
Democratic hold | ||||
Party | Candidate | Votes | % | |
---|---|---|---|---|
Democratic | Alec Garnett (incumbent) | 25,709 | 100.0 | |
Total votes | 25,709 | 100.0 |
Party | Candidate | Votes | % | |
---|---|---|---|---|
Republican | Victoria Patridge | 2,566 | 100.0 | |
Total votes | 2,566 | 100.0 |
Party | Candidate | Votes | % | |
---|---|---|---|---|
Democratic | Alec Garnett (incumbent) | 45,369 | 80.58 | |
Republican | Victoria Patridge | 10,935 | 19.42 | |
Total votes | 56,304 | 100.0 | ||
Democratic hold | ||||
Party | Candidate | Votes | % | |
---|---|---|---|---|
Democratic | Meg Froelich (incumbent) | 14,512 | 100.0 | |
Total votes | 14,512 | 100.0 |
Party | Candidate | Votes | % | |
---|---|---|---|---|
Republican | William S. Klocek | 6,052 | 100.0 | |
Total votes | 6,052 | 100.0 |
Party | Candidate | Votes | % | |
---|---|---|---|---|
Democratic | Meg Froelich (incumbent) | 28,071 | 59.11 | |
Republican | Dean Titterington | 18,008 | 37.92 | |
Libertarian | David Jurist | 1,411 | 2.97 | |
Total votes | 47,490 | 100.0 | ||
Democratic hold | ||||
Party | Candidate | Votes | % | |
---|---|---|---|---|
Democratic | Serena Gonzales-Gutierrez (incumbent) | 18,856 | 100.0 | |
Total votes | 18,856 | 100.0 |
Party | Candidate | Votes | % | |
---|---|---|---|---|
Republican | Grant Price | 1,790 | 100.0 | |
Total votes | 1,790 | 100.0 |
Party | Candidate | Votes | % | |
---|---|---|---|---|
Democratic | Serena Gonzales-Gutierrez (incumbent) | 34,501 | 81.85 | |
Republican | Grant Price | 7,651 | 18.15 | |
Total votes | 42,152 | 100.0 | ||
Democratic hold | ||||
Party | Candidate | Votes | % | |
---|---|---|---|---|
Democratic | Alex Valdez (incumbent) | 18,082 | 100.0 | |
Total votes | 18,082 | 100.0 |
Party | Candidate | Votes | % | |
---|---|---|---|---|
Republican | Jonathan Woodley | 1,781 | 100.0 | |
Total votes | 1,781 | 100.0 |
Party | Candidate | Votes | % | |
---|---|---|---|---|
Democratic | Alex Valdez (incumbent) | 37,132 | 79.06 | |
Republican | Jonathan Woodley | 9,203 | 19.59 | |
Unity | Joe Richardson | 633 | 1.35 | |
Total votes | 46,968 | 100.0 | ||
Democratic hold | ||||
Party | Candidate | Votes | % | |
---|---|---|---|---|
Democratic | Steven Woodrow (incumbent) | 11,143 | 45.71 | |
Democratic | Steven Paletz | 7,560 | 31.01 | |
Democratic | Dan Himelspach | 5,673 | 23.27 | |
Total votes | 24,376 | 100.0 |
Party | Candidate | Votes | % | |
---|---|---|---|---|
Republican | Bill McAleb | 3,944 | 100.0 | |
Total votes | 3,944 | 100.0 |
Party | Candidate | Votes | % | |
---|---|---|---|---|
Democratic | Steven Woodrow (incumbent) | 36,302 | 71.86 | |
Republican | Bill McAleb | 12,711 | 25.16 | |
Libertarian | Jeffrey Crowe | 1,508 | 2.98 | |
Total votes | 50,521 | 100.0 | ||
Democratic hold | ||||
Party | Candidate | Votes | % | |
---|---|---|---|---|
Democratic | Jennifer Bacon | 18,805 | 100.0 | |
Total votes | 18,805 | 100.0 |
Party | Candidate | Votes | % | |
---|---|---|---|---|
Democratic | Jennifer Bacon | 38,938 | 100.0 | |
Total votes | 38,938 | 100.0 | ||
Democratic hold | ||||
Party | Candidate | Votes | % | |
---|---|---|---|---|
Democratic | Leslie Herod (incumbent) | 27,851 | 100.0 | |
Total votes | 27,851 | 100.0 |
Party | Candidate | Votes | % | |
---|---|---|---|---|
Democratic | Leslie Herod (incumbent) | 46,910 | 100.0 | |
Total votes | 46,910 | 100.0 | ||
Democratic hold | ||||
Party | Candidate | Votes | % | |
---|---|---|---|---|
Democratic | Emily Sirota (incumbent) | 18,284 | 100.0 | |
Total votes | 18,284 | 100.0 |
Party | Candidate | Votes | % | |
---|---|---|---|---|
Republican | Larry L. Braig | 3,958 | 100.0 | |
Total votes | 3,958 | 100.0 |
Party | Candidate | Votes | % | |
---|---|---|---|---|
Democratic | Emily Sirota (incumbent) | 32,059 | 69.89 | |
Republican | Larry L. Braig | 12,438 | 27.12 | |
Libertarian | Wes Pinchot | 1,373 | 2.99 | |
Total votes | 45,870 | 100.0 | ||
Democratic hold | ||||
Party | Candidate | Votes | % | |
---|---|---|---|---|
Democratic | Edie Hooton (incumbent) | 20,759 | 100.0 | |
Total votes | 20,759 | 100.0 |
Party | Candidate | Votes | % | |
---|---|---|---|---|
Republican | Kenneth J. Stickney | 1,782 | 100.0 | |
Total votes | 1,782 | 100.0 |
Party | Candidate | Votes | % | |
---|---|---|---|---|
Democratic | Edie Hooton (incumbent) | 39,269 | 85.36 | |
Republican | Kenneth J. Stickney | 6,733 | 14.64 | |
Total votes | 46,002 | 100.0 | ||
Democratic hold | ||||
Party | Candidate | Votes | % | |
---|---|---|---|---|
Democratic | Karen McCormick | 17,470 | 100.0 | |
Total votes | 17,470 | 100.0 |
Party | Candidate | Votes | % | |
---|---|---|---|---|
Republican | Mark Milliman | 5,951 | 100.0 | |
Total votes | 5,951 | 100.0 |
Party | Candidate | Votes | % | |
---|---|---|---|---|
Democratic | Karen McCormick | 32,803 | 66.98 | |
Republican | Mark Milliman | 16,171 | 33.02 | |
Total votes | 48,974 | 100.0 | ||
Democratic hold | ||||
Party | Candidate | Votes | % | |
---|---|---|---|---|
Democratic | Tracey Bernett | 21,873 | 100.0 | |
Total votes | 21,873 | 100.0 |
Party | Candidate | Votes | % | |
---|---|---|---|---|
Republican | Eric J. Davila | 4,909 | 100.0 | |
Total votes | 4,909 | 100.0 |
Party | Candidate | Votes | % | |
---|---|---|---|---|
Democratic | Tracey Bernett | 39,674 | 73.61 | |
Republican | Eric J. Davila | 14,227 | 26.39 | |
Total votes | 53,901 | 100.0 | ||
Democratic hold | ||||
Party | Candidate | Votes | % | |
---|---|---|---|---|
Democratic | Judy Amabile | 18,131 | 100.0 | |
Total votes | 18,131 | 100.0 |
Party | Candidate | Votes | % | |
---|---|---|---|---|
Republican | Kevin Sipple | 4,736 | 100.0 | |
Total votes | 4,736 | 100.0 |
Party | Candidate | Votes | % | |
---|---|---|---|---|
Democratic | Judy Amabile | 34,652 | 68.24 | |
Republican | Kevin Sipple | 14,418 | 28.39 | |
Libertarian | James Gilman | 1,713 | 3.37 | |
Total votes | 50,783 | 100.0 | ||
Democratic hold | ||||
Party | Candidate | Votes | % | |
---|---|---|---|---|
Democratic | John Foley | 8,855 | 100.0 | |
Total votes | 8,855 | 100.0 |
Party | Candidate | Votes | % | |
---|---|---|---|---|
Republican | Shane Sandridge (incumbent) | 14,366 | 100.0 | |
Total votes | 14,366 | 100.0 |
Party | Candidate | Votes | % | |
---|---|---|---|---|
Republican | Shane Sandridge (incumbent) | 34,013 | 60.86 | |
Democratic | John Foley | 19,688 | 35.23 | |
Libertarian | David Thompson | 2,189 | 3.92 | |
Total votes | 55,890 | 100.0 | ||
Republican hold | ||||
Party | Candidate | Votes | % | |
---|---|---|---|---|
Democratic | John Pyne IV | 7,551 | 100.0 | |
Total votes | 7,551 | 100.0 |
Party | Candidate | Votes | % | |
---|---|---|---|---|
Republican | Dave Williams (incumbent) | 11,168 | 100.0 | |
Total votes | 11,168 | 100.0 |
Party | Candidate | Votes | % | |
---|---|---|---|---|
Republican | Dave Williams (incumbent) | 28,944 | 59.14 | |
Democratic | John Pyne IV | 17,535 | 35.83 | |
Libertarian | Mike McRedmond | 2,459 | 5.02 | |
Total votes | 48,938 | 100.0 | ||
Republican hold | ||||
Party | Candidate | Votes | % | |
---|---|---|---|---|
Democratic | Stephanie Vigil | 8,189 | 100.0 | |
Total votes | 8,189 | 100.0 |
Party | Candidate | Votes | % | |
---|---|---|---|---|
Republican | Andres G. Pico | 10,521 | 100.0 | |
Total votes | 10,521 | 100.0 |
Party | Candidate | Votes | % | |
---|---|---|---|---|
Republican | Andres G. Pico | 23,842 | 54.53 | |
Democratic | Stephanie Vigil | 18,070 | 41.33 | |
Libertarian | John Hjersman | 1,813 | 4.15 | |
Total votes | 43,725 | 100.0 | ||
Republican hold | ||||
Party | Candidate | Votes | % | |
---|---|---|---|---|
Democratic | Tony Exum (incumbent) | 5,940 | 100.0 | |
Total votes | 5,940 | 100.0 |
Party | Candidate | Votes | % | |
---|---|---|---|---|
Republican | Rob Blancken | 4,289 | 100.0 | |
Total votes | 4,289 | 100.0 |
Party | Candidate | Votes | % | |
---|---|---|---|---|
Democratic | Tony Exum (incumbent) | 15,780 | 56.76 | |
Republican | Rob Blancken | 10,398 | 37.40 | |
Libertarian | Susan Quilleash-Nelson | 1,621 | 5.83 | |
Total votes | 27,799 | 100.0 | ||
Democratic hold | ||||
Party | Candidate | Votes | % | |
---|---|---|---|---|
Democratic | Marc Snyder (incumbent) | 12,270 | 100.0 | |
Total votes | 12,270 | 100.0 |
Party | Candidate | Votes | % | |
---|---|---|---|---|
Republican | George M. Rapko | 6,946 | 100.0 | |
Total votes | 6,946 | 100.0 |
Party | Candidate | Votes | % | |
---|---|---|---|---|
Democratic | Marc Snyder (incumbent) | 26,325 | 59.07 | |
Republican | George M. Rapko | 16,331 | 36.65 | |
Libertarian | Nathan Foutch | 1,907 | 4.28 | |
Total votes | 44,563 | 100.0 | ||
Democratic hold | ||||
Party | Candidate | Votes | % | |
---|---|---|---|---|
Democratic | Joe Thompson | 7,829 | 100.0 | |
Total votes | 7,829 | 100.0 |
Party | Candidate | Votes | % | |
---|---|---|---|---|
Republican | Tim Geitner (incumbent) | 19,797 | 100.0 | |
Total votes | 19,797 | 100.0 |
Party | Candidate | Votes | % | |
---|---|---|---|---|
Republican | Tim Geitner (incumbent) | 48,521 | 74.97 | |
Democratic | Joe Thompson | 16,198 | 25.03 | |
Total votes | 64,719 | 100.0 | ||
Republican hold | ||||
Party | Candidate | Votes | % | |
---|---|---|---|---|
Democratic | Meg Fossinger | 6,371 | 63.64 | |
Democratic | Susan Crutchfield | 3,640 | 36.36 | |
Total votes | 10,011 | 100.0 |
Party | Candidate | Votes | % | |
---|---|---|---|---|
Republican | Terri Carver (incumbent) | 11,777 | 100.0 | |
Total votes | 11,777 | 100.0 |
Party | Candidate | Votes | % | |
---|---|---|---|---|
Republican | Terri Carver (incumbent) | 27,376 | 58.72 | |
Democratic | Meg Fossinger | 17,799 | 38.18 | |
Libertarian | Judith Darcy | 1,446 | 3.10 | |
Total votes | 46,621 | 100.0 | ||
Republican hold | ||||
Party | Candidate | Votes | % | |
---|---|---|---|---|
Democratic | Liz Rosenbaum | 5,345 | 100.0 | |
Total votes | 5,345 | 100.0 |
Party | Candidate | Votes | % | |
---|---|---|---|---|
Republican | Mary Bradfield | 6,690 | 100.0 | |
Total votes | 6,690 | 100.0 |
Party | Candidate | Votes | % | |
---|---|---|---|---|
Republican | Mary Bradfield | 17,448 | 54.20 | |
Democratic | Liz Rosenbaum | 12,999 | 40.38 | |
Libertarian | Michael Seebeck | 1,743 | 5.41 | |
Total votes | 32,190 | 100.0 | ||
Republican hold | ||||
Party | Candidate | Votes | % | |
---|---|---|---|---|
Democratic | Mary Parker | 12,464 | 100.0 | |
Total votes | 12,464 | 100.0 |
Party | Candidate | Votes | % | |
---|---|---|---|---|
Republican | Colin Larson (incumbent) | 6,760 | 56.21 | |
Republican | Justin Everett | 5,266 | 43.79 | |
Total votes | 12,026 | 100.0 |
Party | Candidate | Votes | % | |
---|---|---|---|---|
Republican | Colin Larson (incumbent) | 26,421 | 51.27 | |
Democratic | Mary Parker | 23,467 | 45.54 | |
Libertarian | Margot Herzl | 1,641 | 3.18 | |
Total votes | 51,529 | 100.0 | ||
Republican hold | ||||
Party | Candidate | Votes | % | |
---|---|---|---|---|
Democratic | Chris Kennedy (incumbent) | 15,352 | 100.0 | |
Total votes | 15,352 | 100.0 |
Party | Candidate | Votes | % | |
---|---|---|---|---|
Republican | Fred Clifford | 6,290 | 100.0 | |
Total votes | 6,290 | 100.0 |
Party | Candidate | Votes | % | |
---|---|---|---|---|
Democratic | Chris Kennedy (incumbent) | 29,615 | 60.22 | |
Republican | Fred Clifford | 17,126 | 34.82 | |
Libertarian | Doug Anderson | 2,437 | 4.96 | |
Total votes | 49,178 | 100.0 | ||
Democratic hold | ||||
Party | Candidate | Votes | % | |
---|---|---|---|---|
Democratic | Monica Duran (incumbent) | 16,216 | 100.0 | |
Total votes | 16,216 | 100.0 |
Party | Candidate | Votes | % | |
---|---|---|---|---|
Republican | Laurel Imer | 6,197 | 100.0 | |
Total votes | 6,197 | 100.0 |
Party | Candidate | Votes | % | |
---|---|---|---|---|
Democratic | Monica Duran (incumbent) | 30,671 | 64.03 | |
Republican | Laurel Imer | 17,228 | 35.97 | |
Total votes | 47,899 | 100.0 | ||
Democratic hold | ||||
Party | Candidate | Votes | % | |
---|---|---|---|---|
Democratic | Lisa Cutter (incumbent) | 15,712 | 100.0 | |
Total votes | 15,712 | 100.0 |
Party | Candidate | Votes | % | |
---|---|---|---|---|
Republican | Donald Rosier | 9,460 | 100.0 | |
Total votes | 9,460 | 100.0 |
Party | Candidate | Votes | % | |
---|---|---|---|---|
Democratic | Lisa Cutter (incumbent) | 30,249 | 52.82 | |
Republican | Donald Rosier | 27,023 | 47.18 | |
Total votes | 57,272 | 100.0 | ||
Democratic hold | ||||
Party | Candidate | Votes | % | |
---|---|---|---|---|
Democratic | Dylan Roberts (incumbent) | 11,859 | 100.0 | |
Total votes | 11,859 | 100.0 |
Party | Candidate | Votes | % | |
---|---|---|---|---|
Democratic | Dylan Roberts (incumbent) | 32,059 | 100.0 | |
Total votes | 32,059 | 100.0 | ||
Democratic hold | ||||
Party | Candidate | Votes | % | |
---|---|---|---|---|
Democratic | Brianna Titone (incumbent) | 17,469 | 100.0 | |
Total votes | 17,469 | 100.0 |
Party | Candidate | Votes | % | |
---|---|---|---|---|
Republican | Vicki Pyne | 10,199 | 100.0 | |
Total votes | 10,199 | 100.0 |
Party | Candidate | Votes | % | |
---|---|---|---|---|
Democratic | Brianna Titone (incumbent) | 29,566 | 48.70 | |
Republican | Vicki Pyne | 27,674 | 45.59 | |
Libertarian | Cory Schaeffer | 3,468 | 5.71 | |
Total votes | 60,708 | 100.0 | ||
Democratic hold | ||||
Party | Candidate | Votes | % | |
---|---|---|---|---|
Democratic | Kerry Tipper (incumbent) | 13,844 | 100.0 | |
Total votes | 13,844 | 100.0 |
Party | Candidate | Votes | % | |
---|---|---|---|---|
Republican | Pedro Roybal | 6,025 | 100.0 | |
Total votes | 6,025 | 100.0 |
Party | Candidate | Votes | % | |
---|---|---|---|---|
Democratic | Kerry Tipper (incumbent) | 26,592 | 57.63 | |
Republican | Pedro Roybal | 17,030 | 36.91 | |
Libertarian | Amara Hildebrand | 2,519 | 5.46 | |
Total votes | 46,141 | 100.0 | ||
Democratic hold | ||||
Party | Candidate | Votes | % | |
---|---|---|---|---|
Democratic | Lindsey N. Daugherty | 13,527 | 100.0 | |
Total votes | 13,527 | 100.0 |
Party | Candidate | Votes | % | |
---|---|---|---|---|
Republican | Vanessa DeMott | 6,294 | 100.0 | |
Total votes | 6,294 | 100.0 |
Party | Candidate | Votes | % | |
---|---|---|---|---|
Democratic | Lindsey N. Daugherty | 26,226 | 56.10 | |
Republican | Vanessa DeMott | 17,931 | 38.36 | |
Libertarian | Ryan Van Gundy | 2,590 | 5.54 | |
Total votes | 46,747 | 100.0 | ||
Democratic hold | ||||
Party | Candidate | Votes | % | |
---|---|---|---|---|
Democratic | Dafna Michaelson Jenet (incumbent) | 8,892 | 100.0 | |
Total votes | 8,892 | 100.0 |
Party | Candidate | Votes | % | |
---|---|---|---|---|
Republican | Kerrie Gutierrez | 2,643 | 53.24 | |
Republican | Cynthia M. Sarmiento | 2,321 | 46.76 | |
Total votes | 4,964 | 100.0 |
Party | Candidate | Votes | % | |
---|---|---|---|---|
Democratic | Dafna Michaelson Jenet (incumbent) | 22,445 | 56.85 | |
Republican | Kerrie Gutierrez | 17,036 | 43.15 | |
Total votes | 39,481 | 100.0 | ||
Democratic hold | ||||
Party | Candidate | Votes | % | |
---|---|---|---|---|
Democratic | Yadira Caraveo (incumbent) | 9,677 | 100.0 | |
Total votes | 9,677 | 100.0 |
Party | Candidate | Votes | % | |
---|---|---|---|---|
Democratic | Yadira Caraveo (incumbent) | 27,687 | 100.0 | |
Total votes | 27,687 | 100.0 | ||
Democratic hold | ||||
Party | Candidate | Votes | % | |
---|---|---|---|---|
Democratic | Adrienne Benavidez (incumbent) | 7,782 | 100.0 | |
Total votes | 7,782 | 100.0 |
Party | Candidate | Votes | % | |
---|---|---|---|---|
Republican | Tony Caputo | 2,573 | 100.0 | |
Total votes | 2,573 | 100.0 |
Party | Candidate | Votes | % | |
---|---|---|---|---|
Democratic | Adrienne Benavidez (incumbent) | 19,597 | 63.68 | |
Republican | Tony Caputo | 9,368 | 30.44 | |
Libertarian | Jason Chapman | 1,810 | 5.88 | |
Total votes | 30,775 | 100.0 | ||
Democratic hold | ||||
Party | Candidate | Votes | % | |
---|---|---|---|---|
Democratic | Matt Gray (incumbent) | 20,373 | 100.0 | |
Total votes | 20,373 | 100.0 |
Party | Candidate | Votes | % | |
---|---|---|---|---|
Republican | Mindy Quiachon | 8,155 | 100.0 | |
Total votes | 8,155 | 100.0 |
Party | Candidate | Votes | % | |
---|---|---|---|---|
Democratic | Matt Gray (incumbent) | 37,901 | 62.06 | |
Republican | Mindy Quiachon | 23,170 | 37.94 | |
Total votes | 61,071 | 100.0 | ||
Democratic hold | ||||
Party | Candidate | Votes | % | |
---|---|---|---|---|
Democratic | Kyle Mullica (incumbent) | 8,667 | 100.0 | |
Total votes | 8,667 | 100.0 |
Party | Candidate | Votes | % | |
---|---|---|---|---|
Republican | Mark Bromley | 2,805 | 57.64 | |
Republican | Audrey Herman | 2,061 | 42.36 | |
Total votes | 4,866 | 100.0 |
Party | Candidate | Votes | % | |
---|---|---|---|---|
Democratic | Kyle Mullica (incumbent) | 19,845 | 56.22 | |
Republican | Mark Bromley | 13,694 | 38.79 | |
Libertarian | Robert Stutz | 1,760 | 4.99 | |
Total votes | 35,299 | 100.0 | ||
Democratic hold | ||||
Party | Candidate | Votes | % | |
---|---|---|---|---|
Democratic | Shannon Bird (incumbent) | 12,011 | 100.0 | |
Total votes | 12,011 | 100.0 |
Party | Candidate | Votes | % | |
---|---|---|---|---|
Republican | Roger Lehman | 5,260 | 100.0 | |
Total votes | 5,260 | 100.0 |
Party | Candidate | Votes | % | |
---|---|---|---|---|
Democratic | Shannon Bird (incumbent) | 27,019 | 62.45 | |
Republican | Roger Lehman | 16,248 | 37.55 | |
Total votes | 43,267 | 100.0 | ||
Democratic hold | ||||
Party | Candidate | Votes | % | |
---|---|---|---|---|
Democratic | Mike Weissman (incumbent) | 11,956 | 100.0 | |
Total votes | 11,956 | 100.0 |
Party | Candidate | Votes | % | |
---|---|---|---|---|
Republican | Dustin Bishop | 5,148 | 100.0 | |
Total votes | 5,148 | 100.0 |
Party | Candidate | Votes | % | |
---|---|---|---|---|
Democratic | Mike Weissman (incumbent) | 26,687 | 61.18 | |
Republican | Dustin Bishop | 16,935 | 38.82 | |
Total votes | 43,622 | 100.0 | ||
Democratic hold | ||||
Party | Candidate | Votes | % | |
---|---|---|---|---|
Democratic | Tom Sullivan (incumbent) | 14,160 | 100.0 | |
Total votes | 14,160 | 100.0 |
Party | Candidate | Votes | % | |
---|---|---|---|---|
Republican | Caroline Cornell | 7,608 | 100.0 | |
Total votes | 7,608 | 100.0 |
Party | Candidate | Votes | % | |
---|---|---|---|---|
Democratic | Tom Sullivan (incumbent) | 27,829 | 55.58 | |
Republican | Caroline Cornell | 22,242 | 44.42 | |
Total votes | 50,071 | 100.0 | ||
Democratic hold | ||||
Party | Candidate | Votes | % | |
---|---|---|---|---|
Democratic | David Ortiz | 12,153 | 65.34 | |
Democratic | Candice Ferguson | 6,448 | 34.66 | |
Total votes | 18,601 | 100.0 |
Party | Candidate | Votes | % | |
---|---|---|---|---|
Republican | Richard Champion (incumbent) | 10,064 | 100.0 | |
Total votes | 10,064 | 100.0 |
Party | Candidate | Votes | % | |
---|---|---|---|---|
Democratic | David Ortiz | 31,504 | 55.57 | |
Republican | Richard Champion (incumbent) | 25,191 | 44.43 | |
Total votes | 56,695 | 100.0 | ||
Democratic gain from Republican | ||||
Party | Candidate | Votes | % | |
---|---|---|---|---|
Democratic | Ian Chapman | 9,875 | 100.0 | |
Total votes | 9,875 | 100.0 |
Party | Candidate | Votes | % | |
---|---|---|---|---|
Republican | Mark Baisley (incumbent) | 15,038 | 100.0 | |
Total votes | 15,038 | 100.0 |
Party | Candidate | Votes | % | |
---|---|---|---|---|
Republican | Mark Baisley (incumbent) | 37,657 | 63.04 | |
Democratic | Ian Chapman | 20,257 | 33.91 | |
Libertarian | Bonnie Pyle | 1,823 | 3.05 | |
Total votes | 59,737 | 100.0 | ||
Republican hold | ||||
Party | Candidate | Votes | % | |
---|---|---|---|---|
Democratic | Naquetta Ricks | 7,203 | 51.46 | |
Democratic | John Ronquillo | 6,793 | 48.54 | |
Total votes | 13,996 | 100.0 |
Party | Candidate | Votes | % | |
---|---|---|---|---|
Republican | Richard A. Bassett | 5,928 | 100.0 | |
Total votes | 5,928 | 100.0 |
Party | Candidate | Votes | % | |
---|---|---|---|---|
Democratic | Naquetta Ricks | 25,508 | 59.16 | |
Republican | Richard A. Bassett | 15,807 | 36.66 | |
Libertarian | Robert Harrison | 1,805 | 4.19 | |
Total votes | 43,120 | 100.0 | ||
Democratic hold | ||||
Party | Candidate | Votes | % | |
---|---|---|---|---|
Democratic | Iman Jodeh | 13,233 | 100.0 | |
Total votes | 13,233 | 100.0 |
Party | Candidate | Votes | % | |
---|---|---|---|---|
Republican | Robert Andrews | 5,074 | 100.0 | |
Total votes | 5,074 | 100.0 |
Party | Candidate | Votes | % | |
---|---|---|---|---|
Democratic | Iman Jodeh | 26,167 | 65.97 | |
Republican | Robert Andrews | 13,501 | 34.03 | |
Total votes | 39,668 | 100.0 | ||
Democratic hold | ||||
Party | Candidate | Votes | % | |
---|---|---|---|---|
Democratic | Dominique Jackson (incumbent) | 8,932 | 100.0 | |
Total votes | 8,932 | 100.0 |
Party | Candidate | Votes | % | |
---|---|---|---|---|
Democratic | Dominique Jackson (incumbent) | 22,211 | 100.0 | |
Total votes | 22,211 | 100.0 | ||
Democratic hold | ||||
Party | Candidate | Votes | % | |
---|---|---|---|---|
Democratic | Jennifer Mitkowski | 11,855 | 100.0 | |
Total votes | 11,855 | 100.0 |
Party | Candidate | Votes | % | |
---|---|---|---|---|
Republican | Kevin Van Winkle (incumbent) | 9,366 | 100.0 | |
Total votes | 9,366 | 100.0 |
Party | Candidate | Votes | % | |
---|---|---|---|---|
Republican | Kevin Van Winkle (incumbent) | 26,758 | 52.86 | |
Democratic | Jennifer Mitkowski | 23,859 | 47.14 | |
Total votes | 50,617 | 100.0 | ||
Republican hold | ||||
Party | Candidate | Votes | % | |
---|---|---|---|---|
Democratic | Kyra D. Storojev | 10,805 | 100.0 | |
Total votes | 10,805 | 100.0 |
Party | Candidate | Votes | % | |
---|---|---|---|---|
Republican | Kim Ransom (incumbent) | 10,408 | 100.0 | |
Total votes | 10,408 | 100.0 |
Party | Candidate | Votes | % | |
---|---|---|---|---|
Republican | Kim Ransom (incumbent) | 32,963 | 55.35 | |
Democratic | Kyra D. Storojev | 24,795 | 41.64 | |
Libertarian | Brian Meyer | 1,795 | 3.01 | |
Total votes | 59,553 | 100.0 | ||
Republican hold | ||||
Party | Candidate | Votes | % | |
---|---|---|---|---|
Democratic | Katie Barrett | 11,471 | 100.0 | |
Total votes | 11,471 | 100.0 |
Party | Candidate | Votes | % | |
---|---|---|---|---|
Republican | Patrick Neville (incumbent) | 14,800 | 100.0 | |
Total votes | 14,800 | 100.0 |
Party | Candidate | Votes | % | |
---|---|---|---|---|
Republican | Patrick Neville (incumbent) | 40,418 | 60.19 | |
Democratic | Katie Barrett | 24,779 | 36.90 | |
Libertarian | Caryn Ann Harlos | 1,958 | 2.92 | |
Total votes | 67,155 | 100.0 | ||
Republican hold | ||||
Party | Candidate | Votes | % | |
---|---|---|---|---|
Democratic | Daneya Esgar (incumbent) | 12,340 | 100.0 | |
Total votes | 12,340 | 100.0 |
Party | Candidate | Votes | % | |
---|---|---|---|---|
Republican | Jonathan Ambler | 5,815 | 74.91 | |
Republican | Alexander Lucero-Mugatu | 1,948 | 25.09 | |
Total votes | 7,763 | 100.0 |
Party | Candidate | Votes | % | |
---|---|---|---|---|
Democratic | Daneya Esgar (incumbent) | 24,118 | 53.21 | |
Republican | Jonathan Ambler | 19,532 | 43.10 | |
Libertarian | John Pickerill | 1,673 | 3.69 | |
Total votes | 45,323 | 100.0 | ||
Democratic hold | ||||
Party | Candidate | Votes | % | |
---|---|---|---|---|
Democratic | Bri Buentello (incumbent) | 9,272 | 100.0 | |
Total votes | 9,272 | 100.0 |
Party | Candidate | Votes | % | |
---|---|---|---|---|
Republican | Stephanie Luck | 5,036 | 51.90 | |
Republican | Ron Parker | 4,668 | 48.10 | |
Total votes | 9,704 | 100.0 |
Party | Candidate | Votes | % | |
---|---|---|---|---|
Republican | Stephanie Luck | 23,310 | 54.09 | |
Democratic | Bri Buentello (incumbent) | 19,785 | 45.91 | |
Total votes | 43,095 | 100.0 | ||
Republican gain from Democratic | ||||
Party | Candidate | Votes | % | |
---|---|---|---|---|
Democratic | Holly A. Herson | 7,829 | 100.0 | |
Total votes | 7,829 | 100.0 |
Party | Candidate | Votes | % | |
---|---|---|---|---|
Republican | Tonya Van Beber | 8,939 | 55.99 | |
Republican | Grady Nouis | 7,026 | 44.01 | |
Total votes | 15,965 | 100.0 |
Party | Candidate | Votes | % | |
---|---|---|---|---|
Republican | Tonya Van Beber | 37,670 | 66.71 | |
Democratic | Holly A. Herson | 18,802 | 33.29 | |
Total votes | 56,472 | 100.0 | ||
Republican hold | ||||
Party | Candidate | Votes | % | |
---|---|---|---|---|
Democratic | Yara Hanlin Zokaie | 13,606 | 100.0 | |
Total votes | 13,606 | 100.0 |
Party | Candidate | Votes | % | |
---|---|---|---|---|
Republican | Mike Lynch | 12,606 | 67.02 | |
Republican | Vicki Marble | 6,202 | 32.98 | |
Total votes | 18,808 | 100.0 |
Party | Candidate | Votes | % | |
---|---|---|---|---|
Republican | Mike Lynch | 44,957 | 61.05 | |
Democratic | Yara Hanlin Zokaie | 28,678 | 38.95 | |
Total votes | 73,635 | 100.0 | ||
Republican hold | ||||
Party | Candidate | Votes | % | |
---|---|---|---|---|
Democratic | Mary Young (incumbent) | 5,398 | 100.0 | |
Total votes | 5,398 | 100.0 |
Party | Candidate | Votes | % | |
---|---|---|---|---|
Democratic | Mary Young (incumbent) | 16,402 | 62.14 | |
Libertarian | Sean Short | 9,992 | 37.86 | |
Total votes | 26,394 | 100.0 | ||
Democratic hold | ||||
Party | Candidate | Votes | % | |
---|---|---|---|---|
Republican | Hugh McKean (incumbent) | 12,050 | 100.0 | |
Total votes | 12,050 | 100.0 |
Party | Candidate | Votes | % | |
---|---|---|---|---|
Republican | Hugh McKean (incumbent) | 37,654 | 100.0 | |
Total votes | 37,654 | 100.0 | ||
Republican hold | ||||
Party | Candidate | Votes | % | |
---|---|---|---|---|
Democratic | Cathy Kipp (incumbent) | 17,276 | 100.0 | |
Total votes | 17,276 | 100.0 |
Party | Candidate | Votes | % | |
---|---|---|---|---|
Republican | Donna Walter | 7,083 | 100.0 | |
Total votes | 7,083 | 100.0 |
Party | Candidate | Votes | % | |
---|---|---|---|---|
Democratic | Cathy Kipp (incumbent) | 36,140 | 63.77 | |
Republican | Donna Walter | 20,528 | 36.23 | |
Total votes | 56,668 | 100.0 | ||
Democratic hold | ||||
Party | Candidate | Votes | % | |
---|---|---|---|---|
Democratic | Jennifer Arndt (incumbent) | 13,943 | 100.0 | |
Total votes | 13,943 | 100.0 |
Party | Candidate | Votes | % | |
---|---|---|---|---|
Democratic | Jennifer Arndt (incumbent) | 32,184 | 75.32 | |
Libertarian | Adam Shuknecht | 10,543 | 24.68 | |
Total votes | 42,727 | 100.0 | ||
Democratic hold | ||||
Party | Candidate | Votes | % | |
---|---|---|---|---|
Democratic | AliceMarie Slaven-Emond | 5,686 | 100.0 | |
Total votes | 5,686 | 100.0 |
Party | Candidate | Votes | % | |
---|---|---|---|---|
Republican | Matt Soper (incumbent) | 14,270 | 100.0 | |
Total votes | 14,270 | 100.0 |
Party | Candidate | Votes | % | |
---|---|---|---|---|
Republican | Matt Soper (incumbent) | 34,112 | 74.44 | |
Democratic | AliceMarie Slaven-Emond | 11,715 | 25.56 | |
Total votes | 45,827 | 100.0 | ||
Republican hold | ||||
Party | Candidate | Votes | % | |
---|---|---|---|---|
Democratic | Scott Beilfuss | 7,990 | 100.0 | |
Total votes | 7,990 | 100.0 |
Party | Candidate | Votes | % | |
---|---|---|---|---|
Republican | Janice Rich (incumbent) | 13,050 | 100.0 | |
Total votes | 13,050 | 100.0 |
Party | Candidate | Votes | % | |
---|---|---|---|---|
Republican | Janice Rich (incumbent) | 30,773 | 64.07 | |
Democratic | Scott Beilfuss | 15,570 | 32.42 | |
Green | Sierra Garcia | 1,688 | 3.51 | |
Total votes | 48,031 | 100.0 | ||
Republican hold | ||||
Party | Candidate | Votes | % | |
---|---|---|---|---|
Democratic | Giugi Carminati | 12,005 | 100.0 | |
Total votes | 12,005 | 100.0 |
Party | Candidate | Votes | % | |
---|---|---|---|---|
Republican | Rod Bockenfeld (incumbent) | 12,336 | 100.0 | |
Total votes | 12,336 | 100.0 |
Party | Candidate | Votes | % | |
---|---|---|---|---|
Republican | Rod Bockenfeld (incumbent) | 35,520 | 57.44 | |
Democratic | Giugi Carminati | 23,790 | 38.47 | |
Libertarian | Kevin Gulbranson | 2,531 | 4.09 | |
Total votes | 61,841 | 100.0 | ||
Republican hold | ||||
Party | Candidate | Votes | % | |
---|---|---|---|---|
Democratic | Colin Wilhelm | 6,201 | 100.0 | |
Total votes | 6,201 | 100.0 |
Party | Candidate | Votes | % | |
---|---|---|---|---|
Republican | Perry Will (incumbent) | 10,544 | 100.0 | |
Total votes | 10,544 | 100.0 |
Party | Candidate | Votes | % | |
---|---|---|---|---|
Republican | Perry Will (incumbent) | 25,433 | 63.38 | |
Democratic | Colin Wilhelm | 14,692 | 36.62 | |
Total votes | 40,125 | 100.0 | ||
Republican hold | ||||
Party | Candidate | Votes | % | |
---|---|---|---|---|
Democratic | Seth Cagin | 7,387 | 100.0 | |
Total votes | 7,387 | 100.0 |
Party | Candidate | Votes | % | |
---|---|---|---|---|
Republican | Marc Catlin (incumbent) | 13,051 | 100.0 | |
Total votes | 13,051 | 100.0 |
Party | Candidate | Votes | % | |
---|---|---|---|---|
Republican | Marc Catlin (incumbent) | 29,424 | 64.92 | |
Democratic | Seth Cagin | 15,897 | 35.08 | |
Total votes | 45,321 | 100.0 | ||
Republican hold | ||||
Party | Candidate | Votes | % | |
---|---|---|---|---|
Democratic | Barbara McLachlan (incumbent) | 13,516 | 100.0 | |
Total votes | 13,516 | 100.0 |
Party | Candidate | Votes | % | |
---|---|---|---|---|
Republican | Marilyn Harris | 8,956 | 100.0 | |
Total votes | 8,956 | 100.0 |
Party | Candidate | Votes | % | |
---|---|---|---|---|
Democratic | Barbara McLachlan (incumbent) | 29,524 | 55.38 | |
Republican | Marilyn Harris | 23,788 | 44.62 | |
Total votes | 53,312 | 100.0 | ||
Democratic hold | ||||
Party | Candidate | Votes | % | |
---|---|---|---|---|
Democratic | Lori Boydston | 9,119 | 100.0 | |
Total votes | 9,119 | 100.0 |
Party | Candidate | Votes | % | |
---|---|---|---|---|
Republican | Ron Hanks | 13,559 | 100.0 | |
Total votes | 13,559 | 100.0 |
Party | Candidate | Votes | % | |
---|---|---|---|---|
Republican | Ron Hanks | 30,817 | 62.41 | |
Democratic | Lori Boydston | 18,563 | 37.59 | |
Total votes | 49,380 | 100.0 | ||
Republican hold | ||||
Party | Candidate | Votes | % | |
---|---|---|---|---|
Democratic | Julie McCluskie (incumbent) | 13,196 | 100.0 | |
Total votes | 13,196 | 100.0 |
Party | Candidate | Votes | % | |
---|---|---|---|---|
Republican | Kim McGahey | 7,235 | 100.0 | |
Total votes | 7,235 | 100.0 |
Party | Candidate | Votes | % | |
---|---|---|---|---|
Democratic | Julie McCluskie (incumbent) | 31,228 | 60.43 | |
Republican | Kim McGahey | 20,448 | 39.57 | |
Total votes | 51,676 | 100.0 | ||
Democratic hold | ||||
Party | Candidate | Votes | % | |
---|---|---|---|---|
Democratic | Donald Valdez (incumbent) | 7,525 | 59.01 | |
Democratic | Matthew Martinez | 5,227 | 40.99 | |
Total votes | 12,752 | 100.0 |
Party | Candidate | Votes | % | |
---|---|---|---|---|
Republican | Logan Taggart | 5,500 | 68.28 | |
Republican | Steven Rodriguez | 2,555 | 31.72 | |
Total votes | 8,055 | 100.0 |
Party | Candidate | Votes | % | |
---|---|---|---|---|
Democratic | Donald Valdez (incumbent) | 22,945 | 57.81 | |
Republican | Logan Taggart | 16,742 | 42.19 | |
Total votes | 39,687 | 100.0 | ||
Democratic hold | ||||
Party | Candidate | Votes | % | |
---|---|---|---|---|
Democratic | Gen Schneider | 9,257 | 100.0 | |
Total votes | 9,257 | 100.0 |
Party | Candidate | Votes | % | |
---|---|---|---|---|
Republican | Dan Woog | 8,620 | 62.39 | |
Republican | Patricia Miller | 5,196 | 37.61 | |
Total votes | 13,816 | 100.0 |
Party | Candidate | Votes | % | |
---|---|---|---|---|
Republican | Dan Woog | 35,064 | 59.75 | |
Democratic | Gen Schneider | 20,906 | 35.63 | |
Libertarian | Joe Johnson | 2,711 | 4.62 | |
Total votes | 58,681 | 100.0 | ||
Republican hold | ||||
Party | Candidate | Votes | % | |
---|---|---|---|---|
Democratic | Dean Ormiston | 5,603 | 100.0 | |
Total votes | 5,603 | 100.0 |
Party | Candidate | Votes | % | |
---|---|---|---|---|
Republican | Richard Holtorf (incumbent) | 13,419 | 100.0 | |
Total votes | 13,419 | 100.0 |
Party | Candidate | Votes | % | |
---|---|---|---|---|
Republican | Richard Holtorf (incumbent) | 31,908 | 72.88 | |
Democratic | Dean Ormiston | 11,876 | 27.12 | |
Total votes | 43,784 | 100.0 | ||
Republican hold | ||||
Party | Candidate | Votes | % | |
---|---|---|---|---|
Republican | Rod Pelton (incumbent) | 13,187 | 100.0 | |
Total votes | 13,187 | 100.0 |
Party | Candidate | Votes | % | |
---|---|---|---|---|
Republican | Rod Pelton (incumbent) | 31,857 | 100.0 | |
Total votes | 31,857 | 100.0 | ||
Republican hold | ||||
Eric Alan "Rick" Crawford is an American politician who has been the U.S. representative for Arkansas's 1st congressional district since 2011. He is a member of the Republican Party. Before he was elected to Congress, Crawford was a radio announcer, businessman, and U.S. Army soldier.
The 2014 United States House of Representatives elections in Colorado were held on Tuesday, November 4, 2014, to elect the seven U.S. representatives from the state of Colorado, one from each of the state's seven congressional districts. The elections will coincide with the elections of other federal and state offices, including Governor of Colorado and U.S. Senator.
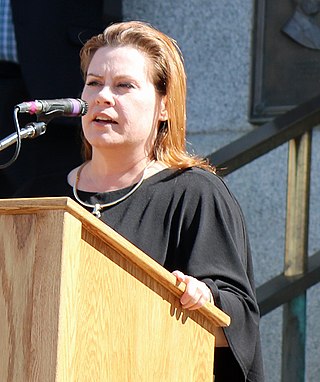
Lori A. Saine is an American politician serving as a member of the Weld County Board of Commissioners. Previously, she served as a Republican member of the Colorado House of Representatives for the 63rd district from January 9, 2013 to January 13, 2021. Saine was a candidate for Colorado's 8th congressional district, but lost the Republican primary, coming in third place.
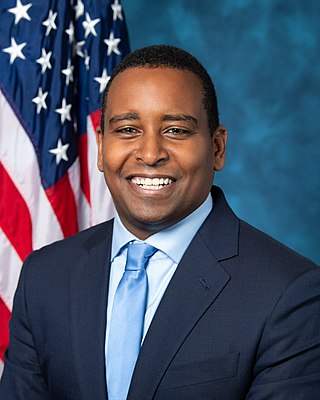
Joseph D. Neguse is an American lawyer and politician serving as the U.S. representative for Colorado's 2nd congressional district since 2019. The district is based in Boulder and includes many of Denver's northwestern suburbs, as well as Fort Collins. A member of the Democratic Party, he was a regent of the University of Colorado from 2008 to 2015. Neguse is the first Eritrean-American elected to the United States Congress and Colorado's first black member of Congress.
Abby Lea Finkenauer is an American politician who served as the U.S. representative from Iowa's 1st congressional district from 2019 to 2021. She is a member of the Democratic Party.
Georgia's state elections were held on November 8, 2016.
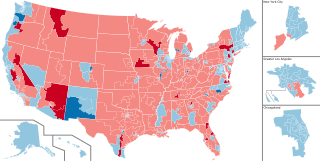
The 2022 United States House of Representatives elections were held on November 8, 2022, as part of the 2022 United States elections during incumbent president Joe Biden's term. Representatives were elected from all 435 U.S. congressional districts across each of the 50 states to serve in the 118th United States Congress, as well as 5 non-voting members of the U.S. House of Representatives from the District of Columbia and four of the five inhabited insular areas. Numerous other federal, state, and local elections, including the 2022 U.S. Senate elections and the 2022 U.S. gubernatorial elections, were also held simultaneously. This was the first election after the 2020 redistricting cycle.
The 2018 Maine House of Representatives elections took place as part of the biennial United States elections. Maine voters elected state representatives in all 151 of the state house's districts, as well as non-voting members from the Passamaquoddy Tribe and the Houlton Band of Maliseet Indians. State representatives serve two-year terms in the Maine State House.
The 2018 Colorado House of Representatives elections took place as part of the biennial United States elections. Colorado voters elected state representatives in all 65 of the state house's districts. State representatives serve two-year terms in the Colorado House of Representatives. The Colorado Reapportionment Commission provides a statewide map of the state House here, and individual district maps are available from the U.S. Census here.
The 2018 Colorado State Senate elections took place as part of the biennial United States elections. Colorado voters elected state senators in 17 of the 35 districts in the state senate. State senators serve four-year terms in the Colorado State Senate. The Colorado Reapportionment Commission provides a statewide map of the state Senate here, and individual district maps are available from the U.S. Census here.
The 2020 United States House of Representatives elections in Utah was held on November 3, 2020, to elect the four U.S. representatives from the state of Utah, one from each of the state's four congressional districts. The elections coincided with the 2020 U.S. presidential election, as well as other elections to the House of Representatives, elections to the United States Senate and various state and local elections.
Elizabeth Bachman Moore is an American attorney and former member of the Georgia House of Representatives from the 95th District, serving from 2019 to 2023. She is a member of the Democratic Party. At the time Moore represented the 95th District it included the cities of Peachtree Corners, Berkeley Lake, Duluth, Norcross, and Johns Creek. The district included citizens of both Gwinnett and Fulton counties. As of 2022, District 95 was changed to a completely different area south of Snellville and north of Stonecrest and Conyers.
On November 3, 2020 El Paso County elected the mayor of El Paso, Texas, four members of city council, two county commissioners, county sheriff, state senator, and five state representatives. El Pasoans voted for members of the House of Representatives of the United States from the 16th and 23rd districts of Texas, district attorney, United States senator, and president of the United States.
Colorado's 17th Senate district is one of 35 districts in the Colorado Senate. It has been represented by Democrat Sonya Jaquez Lewis since 2021, succeeding appointed Democrat Mike Foote, who chose not to seek re-election.
An election was held on November 3, 2020, to elect all 110 members to Michigan's House of Representatives. The election coincided with elections for other offices, including U.S. President, U.S. Senate, and U.S. House of Representatives. Michigan Republican Party retained control of the chamber. As of 2023, this was the last time Republicans controlled the Michigan House of Representatives.
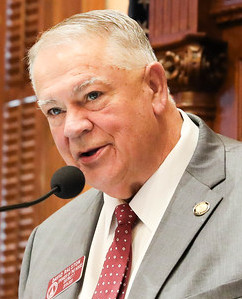
The 2020 Georgia House of Representatives elections took place on November 3, 2020 as part of the biennial United States elections. Georgia voters elected state representatives in all 180 of the state house's districts to the 156th Georgia General Assembly. State representatives serve two-year terms in the Georgia House of Representatives.
The 2020 United States state legislative elections were held on November 3, 2020, for 86 state legislative chambers in 44 states. Across the fifty states, approximately 65 percent of all upper house seats and 85 percent of all lower house seats were up for election. Nine legislative chambers in the five permanently-inhabited U.S. territories and the federal district of Washington, D.C. also held elections. The elections took place concurrently with several other federal, state, and local elections, including the presidential election, U.S. Senate elections, U.S. House elections, and gubernatorial elections.
The 2020 Colorado Senate elections took place on November 3, 2020, with the primary elections held on June 30, 2020. Voters in 18 out of 35 districts of the state Senate elected their representative for a four-year term. It coincided with the state House elections and the biennial United States elections. The Democratic Party retained control of the Senate winning 20 seats and increased their majority by one, gaining the 27th district from the Republican Party.
The 2022 United States state legislative elections were held on November 8, 2022, for 88 state legislative chambers in 46 states. Across the fifty states, approximately 56 percent of all upper house seats and 92 percent of all lower house seats were up for election. Additionally, six territorial chambers were up in four territories and the District of Columbia. These midterm elections coincided with other state and local elections, including gubernatorial elections in multiple states.
The 2014 Colorado Senate elections were held on November 4, 2014 to elect 18 of the 35 members of the Colorado Senate. The election coincided with Colorado House of Representatives elections and other state and federal elections. Primary elections were held on June 24, 2014. Republicans gained control of the chamber for the first time since 2005, gaining one seat.