| |||||||||||||||||||||||||||||||||||||
All 65 seats in the Colorado House of Representatives 33 seats needed for a majority | |||||||||||||||||||||||||||||||||||||
---|---|---|---|---|---|---|---|---|---|---|---|---|---|---|---|---|---|---|---|---|---|---|---|---|---|---|---|---|---|---|---|---|---|---|---|---|---|
| |||||||||||||||||||||||||||||||||||||
Results: Democratic hold Democratic gain Republican hold Republican gain Vote share: 40–50% 50–60% 60–70% 70–80% 80–90% >90% 50–60% 60–70% 70–80% >90% | |||||||||||||||||||||||||||||||||||||
|
Elections in Colorado |
---|
The 2022 Colorado House of Representatives elections took place on November 8, 2022, along with the elections in the State Senate. The primary elections were held on June 28, 2022. [2] Voters in all 65 districts of the state House elected their representative for a two-year term. [3] These coincided with other Colorado elections of the same year and the biennial United States elections.
Democrats gained five seats, increasing their majority to 46 out of 65 seats and giving them a supermajority in the State House for the first time in over 50 years. [4]
In the previous state House election (2020), the Democrats held on to their majority of 17 seats, with no net seat change. [5] Therefore, for Democrats to lose their absolute majority in the House in this election, Republicans and other parties needed to gain at least 9 more seats.
This was the first election with the districts drawn based on the 2020 census. [6]
Representatives who have served four consecutive terms are not eligible for re-election. For terms to be considered non-consecutive, there needs to be a gap of at least four years between them. [3]
Source | Ranking | As of |
---|---|---|
Sabato's Crystal Ball [10] | Likely D | May 19, 2022 |
† - Incumbent not seeking re-election
Seats where the margin of victory was under 10%:
District 1 • 2 • 3 • 4 • 5 • 6 • 7 • 8 • 9 • 10 • 11 • 12 • 13 • 14 • 15 • 16 • 17 • 18 • 19 • 20 • 21 • 22 • 23 • 24 • 25 • 26 • 27 • 28 • 29 • 30 • 31 • 32 • 33 • 34 • 35 • 36 • 37 • 38 • 39 • 40 • 41 • 42 • 43 • 44 • 45 • 46 • 47 • 48 • 49 • 50 • 51 • 52 • 53 • 54 • 55 • 56 • 57 • 58 • 59 • 60 • 61 • 62 • 63 • 64 • 65 [11] [12] |
Party | Candidate | Votes | % | |
---|---|---|---|---|
Democratic | Javier Mabrey | 7,305 | 100.0 | |
Total votes | 7,305 | 100.0 |
Party | Candidate | Votes | % | |
---|---|---|---|---|
Republican | Guillermo Diaz | 3,395 | 100.0 | |
Total votes | 3,395 | 100.o |
Party | Candidate | Votes | % | |
---|---|---|---|---|
Democratic | Javier Mabrey | 17,903 | 64.80 | |
Republican | Guillermo Diaz | 8,981 | 32.51 | |
Libertarian | Kyle Furey | 743 | 2.69 | |
Total votes | 27,627 | 100.0 |
Party | Candidate | Votes | % | |
---|---|---|---|---|
Democratic | Steven Woodrow (incumbent) | 14,067 | 100.0 | |
Total votes | 14,067 | 100.0 |
Party | Candidate | Votes | % | |
---|---|---|---|---|
Republican | Stephanie Wheeler | 3,953 | 100.0 | |
Total votes | 3,953 | 100.0 |
Party | Candidate | Votes | % | |
---|---|---|---|---|
Democratic | Steven Woodrow (incumbent) | 34,213 | 75.40 | |
Republican | Stephanie Wheeler | 10,476 | 23.09 | |
Libertarian | Justin Savoy | 689 | 1.52 | |
Total votes | 45,378 | 100.0 |
Party | Candidate | Votes | % | |
---|---|---|---|---|
Democratic | Meg Froelich (incumbent) | 8,028 | 100.0 | |
Total votes | 8,028 | 100.0 |
Party | Candidate | Votes | % | |
---|---|---|---|---|
Republican | María Fernández | 4,386 | 100.0 | |
Total votes | 4,386 | 100.0 |
Party | Candidate | Votes | % | |
---|---|---|---|---|
Democratic | Meg Froelich (incumbent) | 21,957 | 65.97 | |
Republican | María Fernández | 10,570 | 31.76 | |
Libertarian | Clayton Casciato | 757 | 2.27 | |
Total votes | 33,284 | 100.0 |
Party | Candidate | Votes | % | |
---|---|---|---|---|
Democratic | Serena Gonzales-Gutierrez (incumbent) | 10,207 | 100.0 | |
Total votes | 10,207 | 100.0 |
Party | Candidate | Votes | % | |
---|---|---|---|---|
Republican | Jack Daus | 1,765 | 100.0 | |
Total votes | 1,765 | 100.0 |
Party | Candidate | Votes | % | |
---|---|---|---|---|
Democratic | Serena Gonzales-Gutierrez (incumbent) | 27,116 | 82.66 | |
Republican | Jack Daus | 5,687 | 17.34 | |
Total votes | 32,803 | 100.0 |
Party | Candidate | Votes | % | |
---|---|---|---|---|
Democratic | Alex Valdez (incumbent) | 8,040 | 100.0 | |
Total votes | 8,040 | 100.0 |
Party | Candidate | Votes | % | |
---|---|---|---|---|
Republican | Johnnie Johnson | 1,289 | 100.0 | |
Total votes | 1,289 | 100.0 |
Party | Candidate | Votes | % | |
---|---|---|---|---|
Democratic | Alex Valdez (incumbent) | 24,306 | 82.82 | |
Republican | Johnnie Johnson | 4,502 | 15.34 | |
Unity | Troy Brekke | 539 | 1.84 | |
Total votes | 29,347 | 100.0 |
Party | Candidate | Votes | % | |
---|---|---|---|---|
Democratic | Elisabeth Epps | 9,201 | 53.17 | |
Democratic | Katie March | 8,105 | 46.83 | |
Total votes | 17,306 | 100.0 |
Party | Candidate | Votes | % | |
---|---|---|---|---|
Republican | Donald Howell | 2,055 | 100.0 | |
Total votes | 2,055 | 100.0 |
Party | Candidate | Votes | % | |
---|---|---|---|---|
Democratic | Elisabeth Epps | 32,951 | 85.77 | |
Republican | Donald Howell | 5,448 | 14.18 | |
No party preference | Jordan Friedman (write-in) | 20 | 0.05 | |
Total votes | 38,419 | 100.0 |
Party | Candidate | Votes | % | |
---|---|---|---|---|
Democratic | Jennifer Bacon (incumbent) | 6,377 | 100.0 | |
Total votes | 6,377 | 100.0 |
Party | Candidate | Votes | % | |
---|---|---|---|---|
Democratic | Jennifer Bacon (incumbent) | 16,795 | 100.0 | |
Total votes | 16,795 | 100.0 |
Party | Candidate | Votes | % | |
---|---|---|---|---|
Democratic | Leslie Herod (incumbent) | 14,570 | 100.0 | |
Total votes | 14,570 | 100.0 |
Party | Candidate | Votes | % | |
---|---|---|---|---|
Republican | Hileary Waters | 1,494 | 100.0 | |
Total votes | 1,494 | 100.0 |
Party | Candidate | Votes | % | |
---|---|---|---|---|
Democratic | Leslie Herod (incumbent) | 35,015 | 87.87 | |
Republican | Hileary Waters | 4,833 | 12.13 | |
Total votes | 39,848 | 100.0 |
Party | Candidate | Votes | % | |
---|---|---|---|---|
Democratic | Emily Sirota (incumbent) | 10,731 | 100.0 | |
Total votes | 10,731 | 100.0 |
Party | Candidate | Votes | % | |
---|---|---|---|---|
Republican | Tom Cowhick | 3,201 | 100.0 | |
Total votes | 3,201 | 100.0 |
Party | Candidate | Votes | % | |
---|---|---|---|---|
Democratic | Emily Sirota (incumbent) | 25,925 | 76.87 | |
Republican | Tom Cowhick | 7,802 | 23.13 | |
Total votes | 33,727 | 100.0 |
Party | Candidate | Votes | % | |
---|---|---|---|---|
Democratic | Edie Hooton (incumbent) | 12,451 | 100.0 | |
Total votes | 12,451 | 100.0 |
Party | Candidate | Votes | % | |
---|---|---|---|---|
Republican | William DeOreo | 1,361 | 100.0 | |
Total votes | 1,361 | 100.0 |
Party | Candidate | Votes | % | |
---|---|---|---|---|
Democratic | Junie Joseph | 30,894 | 88.08 | |
Republican | William DeOreo | 4,182 | 11.92 | |
Total votes | 35,076 | 100.0 |
Party | Candidate | Votes | % | |
---|---|---|---|---|
Democratic | Karen McCormick (incumbent) | 11,578 | 100.0 | |
Total votes | 11,578 | 100.0 |
Party | Candidate | Votes | % | |
---|---|---|---|---|
Republican | Tara Menza | 5,098 | 100.0 | |
Total votes | 5,098 | 100.0 |
Party | Candidate | Votes | % | |
---|---|---|---|---|
Democratic | Karen McCormick (incumbent) | 26,855 | 69.73 | |
Republican | Tara Menza | 11,657 | 30.27 | |
Total votes | 38,512 | 100.0 |
Party | Candidate | Votes | % | |
---|---|---|---|---|
Democratic | Tracey Bernett (incumbent) | 15,130 | 100.0 | |
Total votes | 15,130 | 100.0 |
Party | Candidate | Votes | % | |
---|---|---|---|---|
Republican | Anya Kirvan | 3,876 | 100.0 | |
Total votes | 3,876 | 100.0 |
Party | Candidate | Votes | % | |
---|---|---|---|---|
Democratic | Tracey Bernett (incumbent) | 35,127 | 77.23 | |
Republican | Anya Kirvan | 10,356 | 22.77 | |
Total votes | 45,483 | 100.0 |
Party | Candidate | Votes | % | |
---|---|---|---|---|
Democratic | Julie McCluskie (incumbent) | 8,741 | 100.0 | |
Total votes | 8,741 | 100.0 |
Party | Candidate | Votes | % | |
---|---|---|---|---|
Republican | David Buckley | 8,821 | 100.0 | |
Total votes | 8,821 | 100.0 |
Party | Candidate | Votes | % | |
---|---|---|---|---|
Democratic | Julie McCluskie (incumbent) | 25,428 | 56.03 | |
Republican | David Buckley | 19,956 | 43.97 | |
Total votes | 45,834 | 100.0 |
Party | Candidate | Votes | % | |
---|---|---|---|---|
Democratic | Rob Rogers | 6,322 | 100.0 | |
Total votes | 6,322 | 100.0 |
Party | Candidate | Votes | % | |
---|---|---|---|---|
Republican | Rose Pugliese | 8,898 | 53.57 | |
Republican | Joe Woyte | 7,713 | 46.43 | |
Total votes | 16,611 | 100.0 |
Party | Candidate | Votes | % | |
---|---|---|---|---|
Republican | Rose Pugliese | 27,250 | 60.67 | |
Democratic | Rob Rogers | 17,665 | 39.33 | |
Total votes | 44,915 | 100.0 |
Party | Candidate | Votes | % | |
---|---|---|---|---|
Democratic | Alvin Sexton | 4,623 | 100.0 | |
Total votes | 4,623 | 100.0 |
Party | Candidate | Votes | % | |
---|---|---|---|---|
Republican | Scott Bottoms | 8,722 | 100.0 | |
Total votes | 8,722 | 100.0 |
Party | Candidate | Votes | % | |
---|---|---|---|---|
Republican | Scott Bottoms | 17,708 | 56.76 | |
Democratic | Alvin Sexton | 12,200 | 39.10 | |
Libertarian | John Kaufman | 1,291 | 4.14 | |
Total votes | 31,199 | 100.0 |
Party | Candidate | Votes | % | |
---|---|---|---|---|
Democratic | Stephanie Vigil | 6,785 | 100.0 | |
Total votes | 6,785 | 100.0 |
Party | Candidate | Votes | % | |
---|---|---|---|---|
Republican | Dave Donelson | 8,538 | 100.0 | |
Total votes | 8,538 | 100.0 |
Party | Candidate | Votes | % | |
---|---|---|---|---|
Democratic | Stephanie Vigil | 16,243 | 49.75 | |
Republican | Dave Donelson | 15,533 | 47.58 | |
Libertarian | John Hjersman | 870 | 2.66 | |
Total votes | 32,646 | 100.0 |
Party | Candidate | Votes | % | |
---|---|---|---|---|
Democratic | Regina English (incumbent) | 2,387 | 53.98 | |
Democratic | Mischa Smith | 2,035 | 46.02 | |
Total votes | 4,422 | 100.0 |
Party | Candidate | Votes | % | |
---|---|---|---|---|
Republican | Rachel Inez Stovall | 3,499 | 100.0 | |
Total votes | 3,499 | 100.0 |
Party | Candidate | Votes | % | |
---|---|---|---|---|
Democratic | Regina English (incumbent) | 10,313 | 57.28 | |
Republican | Rachel Inez Stovall | 7,693 | 42.72 | |
Total votes | 18,006 | 100.0 |
Party | Candidate | Votes | % | |
---|---|---|---|---|
Democratic | Marc Snyder (incumbent) | 7,714 | 100.0 | |
Total votes | 7,714 | 100.0 |
Party | Candidate | Votes | % | |
---|---|---|---|---|
Republican | Shana Black | 7,329 | 67.69 | |
Republican | Summer Groubert | 3,498 | 32.31 | |
Total votes | 10,827 | 100.0 |
Party | Candidate | Votes | % | |
---|---|---|---|---|
Democratic | Marc Snyder (incumbent) | 20,057 | 52.80 | |
Republican | Shana Black | 16,826 | 44.30 | |
Libertarian | Greg Lauer | 1,101 | 2.90 | |
Total votes | 37,984 | 100.0 |
Party | Candidate | Votes | % | |
---|---|---|---|---|
Democratic | Jennifer Lea Parenti | 7,566 | 100.0 | |
Total votes | 7,566 | 100.0 |
Party | Candidate | Votes | % | |
---|---|---|---|---|
Republican | Dan Woog (incumbent) | 7,996 | 100.0 | |
Total votes | 7,996 | 100.0 |
Party | Candidate | Votes | % | |
---|---|---|---|---|
Democratic | Jennifer Lea Parenti | 21,917 | 50.34 | |
Republican | Dan Woog (incumbent) | 20,450 | 46.97 | |
Libertarian | Joe Johnson | 1,168 | 2.68 | |
Total votes | 43,535 | 100.0 |
Party | Candidate | Votes | % | |
---|---|---|---|---|
Democratic | Tracey Johnson | 4,682 | 100.0 | |
Total votes | 4,682 | 100.0 |
Party | Candidate | Votes | % | |
---|---|---|---|---|
Republican | Don Wilson (incumbent) | 15,744 | 100.0 | |
Total votes | 15,744 | 100.0 |
Party | Candidate | Votes | % | |
---|---|---|---|---|
Republican | Don Wilson (incumbent) | 35,500 | 100.0 | |
Total votes | 35,500 | 100.0 |
Party | Candidate | Votes | % | |
---|---|---|---|---|
Democratic | Kolten Montgomery | 3,481 | 100.0 | |
Total votes | 3,481 | 100.0 |
Party | Candidate | Votes | % | |
---|---|---|---|---|
Republican | Mary Bradfield (incumbent) | 4,187 | 65.35 | |
Republican | Karl O'Brian Dent | 2,220 | 34.65 | |
Total votes | 6,407 | 100.0 |
Party | Candidate | Votes | % | |
---|---|---|---|---|
Republican | Mary Bradfield (incumbent) | 11,612 | 58.38 | |
Democratic | Kolten Montgomery | 8,277 | 41.62 | |
Total votes | 19,889 | 100.0 |
Party | Candidate | Votes | % | |
---|---|---|---|---|
Democratic | Blake Garner | 5,512 | 100.0 | |
Total votes | 5,512 | 100.0 |
Party | Candidate | Votes | % | |
---|---|---|---|---|
Republican | Kenneth G. DeGraff | 11,302 | 100.0 | |
Total votes | 11,302 | 100.0 |
Party | Candidate | Votes | % | |
---|---|---|---|---|
Republican | Kenneth G. DeGraff | 20,763 | 57.66 | |
Democratic | Blake Garner | 14,080 | 39.10 | |
Libertarian | Michael Giallombardo | 1,167 | 3.24 | |
Total votes | 36,010 | 100.0 |
Party | Candidate | Votes | % | |
---|---|---|---|---|
Democratic | Monica Irasema Duran (incumbent) | 9,716 | 100.0 | |
Total votes | 9,716 | 100.0 |
Party | Candidate | Votes | % | |
---|---|---|---|---|
Republican | Fred Clifford | 6,921 | 100.0 | |
Total votes | 6,921 | 100.0 |
Party | Candidate | Votes | % | |
---|---|---|---|---|
Democratic | Monica Irasema Duran (incumbent) | 26,962 | 64.48 | |
Republican | Fred Clifford | 14,723 | 35.32 | |
Total votes | 41,685 | 100.0 |
Party | Candidate | Votes | % | |
---|---|---|---|---|
Democratic | Lindsey Daugherty (incumbent) | 9,711 | 100.0 | |
Total votes | 9,711 | 100.0 |
Party | Candidate | Votes | % | |
---|---|---|---|---|
Republican | Bill Patterson | 9,396 | 100.0 | |
Total votes | 9,396 | 100.0 |
Party | Candidate | Votes | % | |
---|---|---|---|---|
Democratic | Lindsey Daugherty (incumbent) | 26,093 | 57.51 | |
Republican | Bill Patterson | 19,281 | 42.49 | |
Total votes | 45,374 | 100.0 |
Party | Candidate | Votes | % | |
---|---|---|---|---|
Democratic | Tammy Story | 9,695 | 100.0 | |
Total votes | 9,695 | 100.0 |
Party | Candidate | Votes | % | |
---|---|---|---|---|
Republican | Colin Larson (incumbent) | 9,193 | 67.55 | |
Republican | Dede Wagner | 4,416 | 32.45 | |
Total votes | 13,609 | 100.0 |
Party | Candidate | Votes | % | |
---|---|---|---|---|
Democratic | Tammy Story | 25,678 | 49.67 | |
Republican | Colin Larson (incumbent) | 24,959 | 48.28 | |
Libertarian | Todd Dennison | 1,060 | 2.05 | |
Total votes | 51,697 | 100.0 |
Party | Candidate | Votes | % | |
---|---|---|---|---|
Democratic | Meghan Lukens | 6,157 | 100.0 | |
Total votes | 6,157 | 100.0 |
Party | Candidate | Votes | % | |
---|---|---|---|---|
Republican | Savannah Wolfson | 5,999 | 61.50 | |
Republican | Glenn Lowe III | 3,756 | 38.50 | |
Total votes | 9,755 | 100.0 |
Party | Candidate | Votes | % | |
---|---|---|---|---|
Democratic | Meghan Lukens | 21,212 | 53.58 | |
Republican | Savannah Wolfson | 18,376 | 46.42 | |
Total votes | 39,588 | 100.0 |
Party | Candidate | Votes | % | |
---|---|---|---|---|
Democratic | Brianna Titone (incumbent) | 9,586 | 100.0 | |
Total votes | 9,586 | 100.0 |
Party | Candidate | Votes | % | |
---|---|---|---|---|
Republican | Christina Carlino | 8,508 | 100.0 | |
Total votes | 8,508 | 100.0 |
Party | Candidate | Votes | % | |
---|---|---|---|---|
Democratic | Brianna Titone (incumbent) | 26,380 | 57.74 | |
Republican | Lynn Emrick | 18,169 | 39.77 | |
Libertarian | Jacob Luria | 1,136 | 2.49 | |
Total votes | 45,685 | 100.0 |
Party | Candidate | Votes | % | |
---|---|---|---|---|
Democratic | Leanne Emm | 7,951 | 100.0 | |
Total votes | 7,951 | 100.0 |
Party | Candidate | Votes | % | |
---|---|---|---|---|
Republican | Dan Montoya | 8,740 | 100.0 | |
Total votes | 8,740 | 100.0 |
Party | Candidate | Votes | % | |
---|---|---|---|---|
Democratic | Sheila Lieder | 22,064 | 51.57 | |
Republican | Dan Montoya | 19,821 | 46.33 | |
Libertarian | Brian Bakkum | 898 | 2.10 | |
Total votes | 42,783 | 100.0 |
Party | Candidate | Votes | % | |
---|---|---|---|---|
Democratic | Shannon Bird (incumbent) | 8,991 | 100.0 | |
Total votes | 8,991 | 100.0 |
Party | Candidate | Votes | % | |
---|---|---|---|---|
Republican | Vanesa DeMott | 6,888 | 100.0 | |
Total votes | 6,888 | 100.0 |
Party | Candidate | Votes | % | |
---|---|---|---|---|
Democratic | Shannon Bird (incumbent) | 24,632 | 60.93 | |
Republican | Vanesa DeMott | 15,796 | 39.07 | |
Total votes | 40,428 | 100.0 |
Party | Candidate | Votes | % | |
---|---|---|---|---|
Democratic | Chris Kennedy (incumbent) | 8,295 | 100.0 | |
Total votes | 8,295 | 100.0 |
Party | Candidate | Votes | % | |
---|---|---|---|---|
Republican | Russ Carter | 5,412 | 100.0 | |
Total votes | 5,412 | 100.0 |
Party | Candidate | Votes | % | |
---|---|---|---|---|
Democratic | Chris Kennedy (incumbent) | 22,504 | 65.86 | |
Republican | Russ Carter | 11,665 | 34.14 | |
Total votes |
Party | Candidate | Votes | % | |
---|---|---|---|---|
Democratic | Said Sharbini | 4,859 | 100.0 | |
Total votes | 4,859 | 100.0 |
Party | Candidate | Votes | % | |
---|---|---|---|---|
Republican | Heidi Pitchforth | 3,552 | 100.0 | |
Total votes | 3,552 | 100.0 |
Party | Candidate | Votes | % | |
---|---|---|---|---|
Democratic | Said Sharbini | 13,461 | 58.58 | |
Republican | Heidi Pitchforth | 9,517 | 41.42 | |
Total votes | 22,978 | 100.0 |
Party | Candidate | Votes | % | |
---|---|---|---|---|
Democratic | Dafna Michaelson Jenet (incumbent) | 4,051 | 100.0 | |
Total votes | 4,051 | 100.0 |
Party | Candidate | Votes | % | |
---|---|---|---|---|
Republican | Justin Brown | 3,157 | 100.0 | |
Total votes | 3,157 | 100.0 |
Party | Candidate | Votes | % | |
---|---|---|---|---|
Democratic | Dafna Michaelson Jenet (incumbent) | 12,637 | 56.08 | |
Republican | Justin Brown | 9,897 | 43.92 | |
Total votes | 22,534 | 100.0 |
Party | Candidate | Votes | % | |
---|---|---|---|---|
Democratic | William Lindstedt | 9,968 | 100.0 | |
Total votes | 9,968 | 100.0 |
Party | Candidate | Votes | % | |
---|---|---|---|---|
Republican | Stacie Dougherty | 8,076 | 100.0 | |
Total votes | 8,076 | 100.0 |
Party | Candidate | Votes | % | |
---|---|---|---|---|
Democratic | William Lindstedt | 25,549 | 58.82 | |
Republican | Stacie Dougherty | 17,884 | 41.18 | |
Total votes | 43,433 | 100.0 |
Party | Candidate | Votes | % | |
---|---|---|---|---|
Democratic | Jenny Willford | 4,679 | 58.69 | |
Democratic | Sam Nizam | 3,294 | 41.31 | |
Total votes | 7,973 | 100.0 |
Party | Candidate | Votes | % | |
---|---|---|---|---|
Republican | Kevin Allen | 5,719 | 100.0 | |
Total votes | 5,719 | 100.0 |
Party | Candidate | Votes | % | |
---|---|---|---|---|
Democratic | Jenny Willford | 17,601 | 54.09 | |
Republican | Kevin Allen | 14,029 | 43.12 | |
Libertarian | Rob Stutz | 908 | 2.79 | |
Total votes | 32,538 | 100.0 |
Party | Candidate | Votes | % | |
---|---|---|---|---|
Democratic | Adrienne Benavidez (incumbent) | 5,476 | 100.0 | |
Total votes | 5,476 | 100.0 |
Party | Candidate | Votes | % | |
---|---|---|---|---|
Republican | Craig Jones | 2,759 | 100.0 | |
Total votes | 2,759 | 100.0 |
Party | Candidate | Votes | % | |
---|---|---|---|---|
Democratic | Adrienne Benavidez (incumbent) | 15,077 | 65.97 | |
Republican | Craig Jones | 7,779 | 34.03 | |
Total votes | 22,856 | 100.0 |
Party | Candidate | Votes | % | |
---|---|---|---|---|
Democratic | Mike Weissman (incumbent) | 4,620 | 100.0 | |
Total votes | 4,620 | 100.0 |
Party | Candidate | Votes | % | |
---|---|---|---|---|
Republican | William Walters | 3,001 | 100.0 | |
Total votes | 3,001 | 100.0 |
Party | Candidate | Votes | % | |
---|---|---|---|---|
Democratic | Mike Weissman (incumbent) | 13,736 | 64.05 | |
Republican | William Walters | 7,058 | 32.91 | |
Libertarian | Andrew Gibson | 653 | 3.04 | |
Total votes | 21,447 | 100.0 |
Party | Candidate | Votes | % | |
---|---|---|---|---|
Democratic | Ruby Dickson | 7,730 | 100.0 | |
Total votes | 7,730 | 100.0 |
Party | Candidate | Votes | % | |
---|---|---|---|---|
Republican | Paul Archer | 7,802 | 100.0 | |
Total votes | 7,802 | 100.0 |
Party | Candidate | Votes | % | |
---|---|---|---|---|
Democratic | Ruby Dickson | 23,307 | 55.98 | |
Republican | Paul Archer | 18,324 | 44.02 | |
Total votes | 41,631 | 100.0 |
Party | Candidate | Votes | % | |
---|---|---|---|---|
Democratic | David Ortiz (incumbent) | 9,757 | 100.0 | |
Total votes | 9,757 | 100.0 |
Party | Candidate | Votes | % | |
---|---|---|---|---|
Republican | Jaylen Mosqueira | 9,678 | 100.0 | |
Total votes | 9,678 | 100.0 |
Party | Candidate | Votes | % | |
---|---|---|---|---|
Democratic | David Ortiz (incumbent) | 25,765 | 54.52 | |
Republican | Jaylen Mosqueira | 20,394 | 43.15 | |
Libertarian | Brandon L. McDowell | 1,103 | 2.33 | |
Total votes | 47,262 | 100.0 |
Party | Candidate | Votes | % | |
---|---|---|---|---|
Democratic | Eric Brody | 6,406 | 100.0 | |
Total votes | 6,406 | 100.0 |
Party | Candidate | Votes | % | |
---|---|---|---|---|
Republican | Brandi Bradley | 12,661 | 100.0 | |
Total votes | 12,661 | 100.0 |
Party | Candidate | Votes | % | |
---|---|---|---|---|
Republican | Brandi Bradley | 28,347 | 58.06 | |
Democratic | Eric Brody | 20,475 | 41.94 | |
Total votes | 48,822 | 100.0 |
Party | Candidate | Votes | % | |
---|---|---|---|---|
Democratic | Naquetta Ricks (incumbent) | 7,124 | 100.0 | |
Total votes | 7,124 | 100.0 |
Party | Candidate | Votes | % | |
---|---|---|---|---|
Republican | Le Sellers | 5,475 | 100.0 | |
Total votes | 5,475 | 100.0 |
Party | Candidate | Votes | % | |
---|---|---|---|---|
Democratic | Naquetta Ricks (incumbent) | 20,116 | 61.11 | |
Republican | Le Sellers | 12,801 | 38.89 | |
Total votes | 32,917 | 100.0 |
Party | Candidate | Votes | % | |
---|---|---|---|---|
Democratic | Iman Jodeh (incumbent) | 7,935 | 100.0 | |
Total votes | 7,935 | 100.0 |
Party | Candidate | Votes | % | |
---|---|---|---|---|
Republican | Stephanie Hancock | 4,687 | 100.0 | |
Total votes | 4,687 | 100.0 |
Party | Candidate | Votes | % | |
---|---|---|---|---|
Democratic | Iman Jodeh (incumbent) | 18,544 | 64.01 | |
Republican | Stephanie Hancock | 10,426 | 35.99 | |
Total votes | 28,970 | 100.0 |
Party | Candidate | Votes | % | |
---|---|---|---|---|
Democratic | Mandy Lindsay (incumbent) | 2,980 | 58.45 | |
Democratic | Gail Pough | 2,118 | 41.55 | |
Total votes | 5,098 | 100.0 |
Party | Candidate | Votes | % | |
---|---|---|---|---|
Republican | Cory Parella | 2,048 | 100.0 | |
Total votes | 2,048 | 100.0 |
Party | Candidate | Votes | % | |
---|---|---|---|---|
Democratic | Mandy Lindsay (incumbent) | 12,441 | 72.57 | |
Republican | Cory Parella | 4,703 | 27.43 | |
Total votes | 17,144 | 100.0 |
Party | Candidate | Votes | % | |
---|---|---|---|---|
Democratic | Bob Marshall | 7,659 | 100.0 | |
Total votes | 7,659 | 100.0 |
Party | Candidate | Votes | % | |
---|---|---|---|---|
Republican | Kurt Huffman (incumbent) | 7,423 | 60.88 | |
Republican | Robin Webb | 4,770 | 39.12 | |
Total votes | 12,193 | 100.0 |
Party | Candidate | Votes | % | |
---|---|---|---|---|
Democratic | Bob Marshall | 22,876 | 50.45 | |
Republican | Kurt Huffman (incumbent) | 22,471 | 49.55 | |
Total votes | 45,347 | 100.0 |
Party | Candidate | Votes | % | |
---|---|---|---|---|
Democratic | Bob Henry | 5,137 | 100.0 | |
Total votes | 5,137 | 100.0 |
Party | Candidate | Votes | % | |
---|---|---|---|---|
Republican | Anthony Hartsook | 7,361 | 62.65 | |
Republican | Terry Dodd | 4,388 | 37.35 | |
Total votes | 11,749 | 100.0 |
Party | Candidate | Votes | % | |
---|---|---|---|---|
Republican | Anthony Hartsook | 23,362 | 57.20 | |
Democratic | Bob Henry | 16,333 | 39.99 | |
Libertarian | John Sutton | 1,147 | 2.81 | |
Total votes | 40,842 | 100.0 |
Party | Candidate | Votes | % | |
---|---|---|---|---|
Democratic | Ruby Martinez | 5,830 | 100.0 | |
Total votes | 5,830 | 100.0 |
Party | Candidate | Votes | % | |
---|---|---|---|---|
Republican | Lisa Frizell | 8,498 | 56.07 | |
Republican | Bill Jack | 6,658 | 43.93 | |
Total votes | 15,196 | 100.0 |
Party | Candidate | Votes | % | |
---|---|---|---|---|
Republican | Lisa Frizell | 27,884 | 61.88 | |
Democratic | Ruby Martinez | 17,180 | 38.12 | |
Total votes | 45,064 | 100.0 |
Party | Candidate | Votes | % | |
---|---|---|---|---|
Democratic | Tisha Lyn Mauro | 6,127 | 54.86 | |
Democratic | Jason Munoz | 5,042 | 45.14 | |
Total votes | 11,169 | 100.0 |
Party | Candidate | Votes | % | |
---|---|---|---|---|
Republican | Jonathan Ambler | 7,675 | 100.0 | |
Total votes | 7,675 | 100.0 |
Party | Candidate | Votes | % | |
---|---|---|---|---|
Democratic | Tisha Lyn Mauro | 20,197 | 53.99 | |
Republican | Jonathan Ambler | 17,214 | 46.01 | |
Total votes | 37,411 | 100.0 |
Party | Candidate | Votes | % | |
---|---|---|---|---|
Democratic | Edwin Dean Ormiston | 5,934 | 100.0 | |
Total votes | 5,934 | 100.0 |
Party | Candidate | Votes | % | |
---|---|---|---|---|
Republican | Ty Winter | 11,395 | 100.0 | |
Total votes | 11,395 | 100.0 |
Party | Candidate | Votes | % | |
---|---|---|---|---|
Republican | Ty Winter | 23,722 | 64.82 | |
Democratic | Edwin Dean Ormiston | 12,874 | 35.18 | |
Total votes | 36,596 | 100.0 |
Party | Candidate | Votes | % | |
---|---|---|---|---|
Democratic | Spring Erickson | 4,079 | 100.0 | |
Total votes | 4,079 | 100.0 |
Party | Candidate | Votes | % | |
---|---|---|---|---|
Republican | Gabe Evans | 6,394 | 70.23 | |
Republican | Terry Lee Robert DeGroot | 2,710 | 29.77 | |
Total votes | 9,104 | 100.0 |
Party | Candidate | Votes | % | |
---|---|---|---|---|
Republican | Gabe Evans | 20,011 | 63.31 | |
Democratic | Spring Erickson | 10,730 | 33.95 | |
Libertarian | Eric E. Joss | 866 | 2.74 | |
Total votes | 31,607 | 100.0 |
Party | Candidate | Votes | % | |
---|---|---|---|---|
Democratic | Judy Amabile (incumbent) | 13,682 | 100.0 | |
Total votes | 13,682 | 100.0 |
Party | Candidate | Votes | % | |
---|---|---|---|---|
Republican | Kathryn Leher | 5,421 | 56.79 | |
Republican | John Caldwell | 4,125 | 43.21 | |
Total votes | 9,546 | 100.0 |
Party | Candidate | Votes | % | |
---|---|---|---|---|
Democratic | Judy Amabile (incumbent) | 33,326 | 64.31 | |
Republican | Kathryn Leher | 17,186 | 33.17 | |
Libertarian | Daniel Lutz | 1,306 | 2.52 | |
Total votes | 51,818 | 100.0 |
Party | Candidate | Votes | % | |
---|---|---|---|---|
Democratic | Mary Young (incumbent) | 2,860 | 100.0 | |
Total votes | 2,860 | 100.0 |
Party | Candidate | Votes | % | |
---|---|---|---|---|
Republican | Ryan Gonzalez | 3,757 | 100.0 | |
Total votes | 3,757 | 100.0 |
Party | Candidate | Votes | % | |
---|---|---|---|---|
Democratic | Mary Young (incumbent) | 8,616 | 49.19 | |
Republican | Ryan Gonzalez | 8,286 | 47.30 | |
Libertarian | Kyle Moore | 615 | 3.51 | |
Total votes | 17,571 | 100.0 |
Party | Candidate | Votes | % | |
---|---|---|---|---|
Republican | Hugh McKean (incumbent) | 7,741 | 55.97 | |
Republican | Austin Hein | 6,089 | 44.03 | |
Total votes | 13,830 | 100.0 |
Party | Candidate | Votes | % | |
---|---|---|---|---|
Republican | Hugh McKean (incumbent) | 26,542 | 100.0 | |
Total votes | 26,542 | 100.0 |
Party | Candidate | Votes | % | |
---|---|---|---|---|
Democratic | Cathy Kipp (incumbent) | 9,378 | 100.0 | |
Total votes | 9,378 | 100.0 |
Party | Candidate | Votes | % | |
---|---|---|---|---|
Republican | Deborah Vicino | 7,188 | 100.0 | |
Total votes | 7,188 | 100.0 |
Party | Candidate | Votes | % | |
---|---|---|---|---|
Democratic | Cathy Kipp (incumbent) | 28,183 | 64.84 | |
Republican | Deborah Vicino | 15,282 | 35.16 | |
Total votes | 43,465 | 100.0 |
Party | Candidate | Votes | % | |
---|---|---|---|---|
Democratic | Andrew Boesenecker (incumbent) | 7,782 | 100.0 | |
Total votes | 7,782 | 100.0 |
Party | Candidate | Votes | % | |
---|---|---|---|---|
Democratic | Andrew Boesenecker (incumbent) | 25,934 | 75.92 | |
Republican | Donna Walter | 8,224 | 24.08 | |
Total votes | 34,158 | 100.0 |
Party | Candidate | Votes | % | |
---|---|---|---|---|
Democratic | AliceMarie Slaven-Emond | 4,198 | 100.0 | |
Total votes | 4,198 | 100.0 |
Party | Candidate | Votes | % | |
---|---|---|---|---|
Republican | Matt Soper (incumbent) | 16,400 | 100.0 | |
Total votes | 16,400 | 100.0 |
Party | Candidate | Votes | % | |
---|---|---|---|---|
Republican | Matt Soper (incumbent) | 31,026 | 73.80 | |
Democratic | AliceMarie Slaven-Emond | 11,013 | 26.20 | |
Total votes | 42,039 | 100.0 |
Party | Candidate | Votes | % | |
---|---|---|---|---|
Democratic | Damon Davis | 5,215 | 100.0 | |
Total votes | 5,215 | 100.0 |
Party | Candidate | Votes | % | |
---|---|---|---|---|
Republican | Rick Taggart | 9,789 | 52.70 | |
Republican | Trish Weber | 8,787 | 47.30 | |
Total votes | 18,576 | 100.0 |
Party | Candidate | Votes | % | |
---|---|---|---|---|
Republican | Rick Taggart | 25,411 | 63.61 | |
Democratic | Damon Davis | 14,356 | 36.39 | |
Total votes | 39,947 | 100.0 |
Party | Candidate | Votes | % | |
---|---|---|---|---|
Democratic | Kathleen Conway | 3,620 | 100.0 | |
Total votes | 3,620 | 100.0 |
Party | Candidate | Votes | % | |
---|---|---|---|---|
Republican | Rod Bockenfeld (incumbent) | 16,046 | 100.0 | |
Total votes | 16,046 | 100.0 |
Party | Candidate | Votes | % | |
---|---|---|---|---|
Republican | Rod Bockenfeld (incumbent) | 33,608 | 75.83 | |
Democratic | Kathleen Conway | 9,495 | 21.42 | |
Libertarian | Amy Lunde | 1,218 | 2.75 | |
Total votes | 44,321 | 100.0 |
Party | Candidate | Votes | % | |
---|---|---|---|---|
Democratic | Elizabeth Velasco | 5,414 | 64.23 | |
Democratic | Colin Buerger | 3,015 | 35.77 | |
Total votes | 8,429 | 100.0 |
Party | Candidate | Votes | % | |
---|---|---|---|---|
Republican | Perry Will (incumbent) | 8,220 | 100.0 | |
Total votes | 8,220 | 100.0 |
Party | Candidate | Votes | % | |
---|---|---|---|---|
Democratic | Elizabeth Velasco | 19,885 | 53.86 | |
Republican | Perry Will (incumbent) | 17,033 | 46.14 | |
Total votes | 36,918 | 100.0 |
Party | Candidate | Votes | % | |
---|---|---|---|---|
Democratic | Kevin Stanley Kuns | 6,169 | 100.0 | |
Total votes | 6,169 | 100.0 |
Party | Candidate | Votes | % | |
---|---|---|---|---|
Republican | Marc Catlin (incumbent) | 14,706 | 100.0 | |
Total votes | 14,706 | 100.0 |
Party | Candidate | Votes | % | |
---|---|---|---|---|
Republican | Marc Catlin (incumbent) | 26,289 | 56.80 | |
Democratic | Kevin Stanley Kuns | 19,996 | 43.20 | |
Total votes | 46,285 | 100.0 |
Party | Candidate | Votes | % | |
---|---|---|---|---|
Democratic | Barbara McLachlan | 7,372 | 100.0 | |
Total votes | 7,372 | 100.0 |
Party | Candidate | Votes | % | |
---|---|---|---|---|
Republican | Shelli Shaw | 11,664 | 100.0 | |
Total votes | 11,664 | 100.0 |
Party | Candidate | Votes | % | |
---|---|---|---|---|
Democratic | Barbara McLachlan | 26,436 | 56.76 | |
Republican | Shelli Shaw | 20,139 | 43.24 | |
Total votes | 46,575 | 100.0 |
Party | Candidate | Votes | % | |
---|---|---|---|---|
Democratic | Kathryn Green | 5,941 | 100.0 | |
Total votes | 5,941 | 100.0 |
Party | Candidate | Votes | % | |
---|---|---|---|---|
Republican | Stephanie Luck (incumbent) | 14,815 | 100.0 | |
Total votes | 14,815 | 100.0 |
Party | Candidate | Votes | % | |
---|---|---|---|---|
Republican | Stephanie Luck (incumbent) | 29,800 | 68.78 | |
Democratic | Kathryn Green | 13,526 | 31.22 | |
Total votes | 43,326 | 100.0 |
Party | Candidate | Votes | % | |
---|---|---|---|---|
Democratic | Eliza Hamrick | 7,387 | 100.0 | |
Total votes | 7,387 | 100.0 |
Party | Candidate | Votes | % | |
---|---|---|---|---|
Republican | Dave Woolever | 8,586 | 100.0 | |
Total votes | 8,586 | 100.0 |
Party | Candidate | Votes | % | |
---|---|---|---|---|
Democratic | Eliza Hamrick | 20,947 | 50.36 | |
Republican | Dave Woolever | 19,775 | 47.54 | |
Libertarian | Kevin Gulbranson | 876 | 2.11 | |
Total votes | 41,598 | 100.0 |
Party | Candidate | Votes | % | |
---|---|---|---|---|
Democratic | Matthew Martinez | 8,216 | 100.0 | |
Total votes | 8,216 | 100.0 |
Party | Candidate | Votes | % | |
---|---|---|---|---|
Republican | Carol Riggenbach | 4,853 | 60.75 | |
Republican | Ryan Williams | 3,136 | 39.25 | |
Total votes | 7,989 | 100.0 |
Party | Candidate | Votes | % | |
---|---|---|---|---|
Democratic | Matthew Martinez | 17,304 | 55.61 | |
Republican | Carol riggenbach | 13,812 | 44.39 | |
Total votes | 31,116 | 100.0 |
Party | Candidate | Votes | % | |
---|---|---|---|---|
Republican | Richard Holtorf (incumbent) | 11,895 | 71.44 | |
Republican | Jessie Vance | 4,755 | 28.56 | |
Total votes | 16,650 | 100.0 |
Party | Candidate | Votes | % | |
---|---|---|---|---|
Republican | Richard Holtorf (incumbent) | 29,793 | 100.0 | |
Total votes | 29,793 | 100.0 |
Party | Candidate | Votes | % | |
---|---|---|---|---|
Democratic | Richard Webster | 5,035 | 100.0 | |
Total votes | 5,035 | 100.0 |
Party | Candidate | Votes | % | |
---|---|---|---|---|
Republican | Ryan Armagost | 10,714 | 100.0 | |
Total votes | 10,714 | 100.0 |
Party | Candidate | Votes | % | |
---|---|---|---|---|
Republican | Ryan Armagost | 25,216 | 62.65 | |
Democratic | Richard Webster | 15,033 | 37.35 | |
Total votes | 40,249 | 100.0 |
Party | Candidate | Votes | % | |
---|---|---|---|---|
Democratic | Lisa Chollet | 5,505 | 100.0 | |
Total votes | 5,505 | 100.0 |
Party | Candidate | Votes | % | |
---|---|---|---|---|
Republican | Mike Lynch (incumbent) | 12,025 | 100.0 | |
Total votes | 12,025 | 100.0 |
Party | Candidate | Votes | % | |
---|---|---|---|---|
Republican | Mike Lynch (incumbent) | 29,328 | 62.41 | |
Democratic | Lisa Choller | 17,664 | 37.59 | |
Total votes | 46,992 | 100.0 |
The Colorado State Senate is the upper house of the Colorado General Assembly, the state legislature of the US state of Colorado. It is composed of 35 members elected from single-member districts, with each district having a population of about 123,000 as of the 2000 census. Senators are elected to four-year terms, and are limited to two consecutive terms in office. Senators who are term-limited become eligible to run again after a one-term respite.
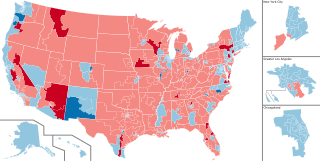
The 1978 United States Senate elections were held on November 7, in the middle of Democratic President Jimmy Carter's term. The 33 seats of Class 2 were contested in regular elections. Special elections were also held to fill vacancies.
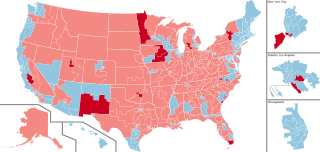
The 1958 United States Senate elections were elections for the United States Senate which occurred in the middle of President Dwight D. Eisenhower's second term. Thirty-two seats of Class 1 were contested in regular elections, the new state of Alaska held its first Senate elections for its Class 2 and 3 seats, and two special elections were held to fill vacancies.
The 1934 United States Senate elections were held in the middle of Democratic President Franklin D. Roosevelt's first term. The 32 seats of Class 1 were contested in regular elections, and special elections were held to fill vacancies. During the Great Depression, voters strongly backed Roosevelt's New Deal and his allies in the Senate, with Democrats picking up a net of nine seats, giving them a supermajority. Republicans later lost three more seats due to mid-term vacancies ; however, a Democrat in Iowa died and the seat remained vacant until the next election. The Democrats entered the next election with a 70-22-2-1 majority.
The 2002 United States House of Representatives elections were held on November 5, 2002, in the middle of President George W. Bush's first term, to elect U.S. Representatives to serve in the 108th United States Congress. This was the first congressional election using districts drawn up during the 2000 United States redistricting cycle on the basis of the 2000 census.
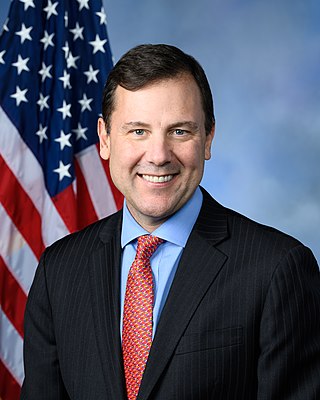
The politics of Oklahoma exists in a framework of a presidential republic modeled after the United States. The governor of Oklahoma is both head of state and head of government, and of a pluriform two-party system. Executive power is exercised by the governor and the government. Legislative power is vested in the governor and the bicameral Oklahoma Legislature. Judicial power is vested in the judiciary of Oklahoma. The political system is laid out in the 1907 Oklahoma Constitution.
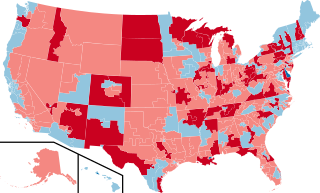
The 2010 United States House of Representatives elections were held on November 2, 2010, as part of the 2010 midterm elections during President Barack Obama's first term in office. Voters of the 50 U.S. states chose 435 U.S. Representatives to serve in the 112th United States Congress. Also, voters of the U.S. territories, commonwealths and District of Columbia chose their non-voting delegates. U.S. Senate elections and various state and local elections were held on the same date.
Andrew Steven Kerr is an American teacher and politician who serves on the county commission in Jefferson County, Colorado. Prior to his tenure on the county commission he served in the Colorado House of Representatives from the 26th district from 2006 to 2013, and in the Colorado Senate from the 22nd district from 2013 to 2019, as a member of the Democratic Party.
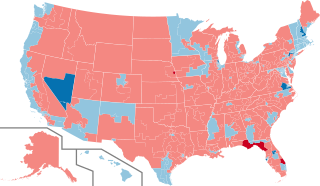
The 2016 United States House of Representatives elections were held on November 8, 2016, to elect representatives for all 435 congressional districts across each of the 50 U.S. states to the 115th United States Congress. Non-voting members for the District of Columbia and territories of the United States were also elected. These elections coincided with the election of President Donald Trump, although his party lost seats in both chambers of Congress. The winners of this election served in the 115th Congress, with seats apportioned among the states based on the 2010 United States census. In October 2015, the House elected a new Speaker, Republican Paul Ryan, who was re-elected in the new term. Democrat Nancy Pelosi continued to lead her party as Minority Leader. Elections were also held on the same day for the U.S. Senate, many governors, and other state and local elections.
The 2018 United States House of Representatives elections were held on November 6, 2018, as part of the 2018 midterm elections during President Donald Trump's first term, with early voting taking place in some states in the weeks preceding that date. Voters chose representatives from all 435 congressional districts across each of the 50 U.S. states to serve in the 116th United States Congress. Non-voting delegates from the District of Columbia and four of the five inhabited U.S. territories were also elected. On Election Day, Republicans had held a House majority since January 2011.
The 2022 United States Senate election in Colorado was held on November 8, 2022. Incumbent Democratic Senator Michael Bennet won reelection to a third term, defeating the Republican candidate, businessman Joe O'Dea. Originally appointed to the seat in 2009, Bennet won full terms in 2010 and 2016.
The 2020 United States House of Representatives elections were held on November 3, 2020, to elect representatives from all 435 congressional districts across each of the 50 U.S. states to the 117th United States Congress, as well as six non-voting delegates from the District of Columbia and the inhabited U.S. territories. Special House elections were also held on various dates throughout 2020.
The 2022 United States House of Representatives elections were held on November 8, 2022, as part of the 2022 United States elections during incumbent president Joe Biden's term. Representatives were elected from all 435 U.S. congressional districts across each of the 50 states to serve in the 118th United States Congress, as well as 5 non-voting members of the U.S. House of Representatives from the District of Columbia and four of the five inhabited insular areas. Numerous other federal, state, and local elections, including the 2022 U.S. Senate elections and the 2022 U.S. gubernatorial elections, were also held simultaneously. This was the first election after the 2020 redistricting cycle.
The 2018 Colorado State Senate elections took place as part of the biennial United States elections. Colorado voters elected state senators in 17 of the 35 districts in the state senate. State senators serve four-year terms in the Colorado State Senate. The Colorado Reapportionment Commission provides a statewide map of the state Senate here, and individual district maps are available from the U.S. Census here.
The Michigan Senate election of 2022 occurred on November 8, 2022, to elect all 38 members to the Michigan Senate. The election coincided with elections for all of Michigan's constitutional offices; governor, attorney general, secretary of state and all 110 seats in the Michigan House of Representatives. Seats in the Michigan Senate were last elected in 2018.
The 2022 Oregon House of Representatives election was held on Tuesday, November 8, 2022. Primary elections were held on Tuesday, May 17, 2022. Voters in the 60 districts of the Oregon House of Representatives elected their representatives. The elections coincided with the elections for other offices, including for State Senate.
The 2022 Iowa Senate elections were held on November 8, 2022, to elect members of the Iowa Senate from 25 odd-numbered districts. Senators serve four-year terms in single-member constituencies, with half of the seats up for election each cycle. Primary elections were held on June 7.
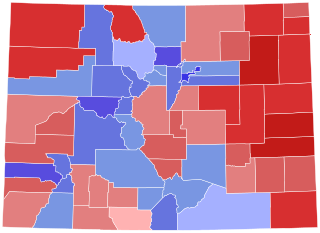
The 2022 Colorado Senate elections took place on November 8, 2022, along with elections in the State House of Representatives, with the primary elections held on June 28, 2022. Voters in 17 out of the 35 districts of the Colorado Senate elected their representative for a four-year term. It coincided with other Colorado elections of the same year and the biennial United States elections.
The 2022 South Dakota House of Representatives elections were held on November 8, 2022, as part of the biennial 2022 United States elections. All 70 seats in the South Dakota House of Representatives were up for election. Primary elections were held on June 7, 2022. The elections coincided with elections for other offices in South Dakota, including the US Senate, US House, South Dakota Governor, South Dakota Secretary of State, South Dakota Attorney General, and the South Dakota Senate.
The 2024 United States House of Representatives elections were held on November 5, 2024, as part of the 2024 United States elections, to elect the 441 members of the House of Representatives - representatives from all 435 congressional districts across each of the 50 U.S. states, as well as 6 non-voting delegates from the District of Columbia and the inhabited U.S. territories to the United States House of Representatives. Special elections have also been held on various dates in 2024. Numerous other federal, state, and local elections, including the U.S. presidential election and elections to the Senate, were also held on this date. The winners of this election will serve in the 119th United States Congress, with seats apportioned among the states based on the 2020 United States census.