The 1972 United States House of Representatives elections were held on November 7, 1972, to elect U.S. Representatives to serve in the 93rd United States Congress. This was the first election held after the 1970 United States redistricting cycle. It coincided with the landslide reelection victory of President Richard M. Nixon. Nixon's Republican Party managed to gain a net of twelve House of Representatives seats from the Democratic Party, although the Democrats retained a majority.

The 2004 United States House of Representatives elections in Texas occurred on November 2, 2004, to elect the members of the state of Texas's delegation to the United States House of Representatives. Texas had thirty-two seats in the House, apportioned according to the 2000 United States census.

An election was held on November 6, 2012, to elect all 41 members to Delaware's House of Representatives. The election coincided with the elections for other offices, including for U.S. President, Governor, Lieutenant Governor, U.S. Senate, U.S. House of Representatives, and state senate. The primary election was held on September 11, 2012.

The 2012 Iowa State Senate elections took place as part of the biennial 2012 United States elections. Iowa voters elected state senators in 26 of the state senate's 50 districts—the 25 even-numbered state senate districts and the 49th district. State senators serve four-year terms in the Iowa State Senate, with half of the seats up for election each cycle. This was the first election cycle following the 2010 census and 2011 redistricting process.

The 2004 North Carolina Senate elections were held on November 2, 2004, to elect members to all fifty seats in the North Carolina Senate. The election coincided with the elections for other offices including the Presidency, U.S. Senate, Governorship, U.S. House of Representatives, Council of State, and state house. The primary election was held on July 20, 2004, with a primary run-off occurring on August 17, 2004. These elections were the first to use new district lines drawn by the General Assembly to account the for changes in population amongst each of the districts after the 2000 census. The 2002 election had been conducted under a map ordered by the North Carolina Superior Court.

The 1981 New Jersey State Senate elections were held on November 3. The New Jersey legislature reapportioned its state legislative districts in advance of the 1981 election. The new districts resulted in many senators running for re-election in newly re-numbered districts. The election coincided with a tightly contested gubernatorial election between Thomas Kean and James Florio. Republicans gained five seats, narrowing the Democratic majority to 22-18.

Elections for the Iowa House of Representatives were held on November 8, 2022. This was the first election for the Iowa House using the new legislative maps that were enacted following the 2020 census. Republicans expanded their majority in the chamber after a number of their members were defeated in primaries.

The 2022 Idaho House of Representatives elections took place on November 8, 2022. Primary elections were held on May 17, 2022. Idaho voters elected state representatives in all 70 seats of the House, electing two state representatives in each of the 35 Idaho state legislative districts. State representatives serve two-year terms in the Idaho House of Representatives.
An election was held on November 8, 2022, to elect all 120 members to North Carolina's House of Representatives. The election coincided with the elections for other offices, including the U.S Senate, U.S. House of Representatives, and state senate. The primary election was originally going to be held on March 8, 2022, with a run-off in June 2022; however, the North Carolina Supreme Court delayed the primary until May 17, 2022, pending challenges over the State's districts and paused candidate filing. Prior to this pause, several candidates had already filed to run. The elections would be held under new districts passed by the General Assembly in House Bill 976 to account for population changes following the 2020 census. The maps were later overturned by the North Carolina Supreme Court, who ordered the legislature to draw new maps. The North Carolina General Assembly later redrew the maps which were upheld by the Wake County Superior Court and the North Carolina Supreme Court. Candidate filing resumed on February 24, 2022, and concluded on March 4, 2022.
An election was held on November 8, 2022, to elect all 50 members to North Carolina's Senate. The election coincided with the elections for other offices, including the U.S. Senate, U.S. House of Representatives, and state house. The filing period lasted from February 24, 2022, to March 4, 2022, with the primary election being held on May 17, 2022. The elections were originally to be held under new districts passed by the General Assembly in Senate Bill 739 to account for population changes following the 2020 census; however, following a ruling by the North Carolina Supreme Court, the General Assembly redrew the maps to comply with the court's ruling.

The 2022 Delaware House of Representatives elections took place on November 8, 2022, as part of the 2022 United States elections. The election coincided with elections for other offices, including for U.S. House, Attorney General, and state senate. Delaware voters elected state senators in all 41 of the state's Senate districts. 41 State Representatives serve four-year terms in the Delaware House of Representatives.
The 2022 Georgia House of Representatives elections were held on November 8, 2022, as part of the biennial United States elections. The election coincided with elections for other offices including for governor, U.S Senate, U.S House, and State Senate. Georgia voters elected state representatives in all 180 of the state house's districts to the 157th Georgia General Assembly. State representatives serve two-year terms in the Georgia House of Representatives. The primary election was held on May 24, 2022, with a primary run-off held on June 21, 2022.

The 2022 Hawaii House of Representatives elections were held on Tuesday, November 8, as part of the biennial 2022 United States elections. The process elected all 51 seats in the Hawaii House of Representatives.

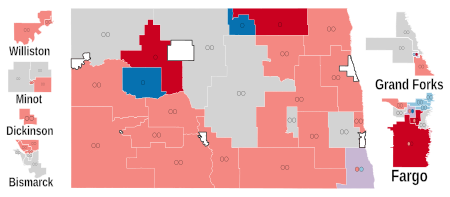
The 2022 North Dakota Senate elections were held on November 8, 2022, as part of the biennial 2022 United States elections. 32 of the seats in the North Dakota State Senate were up for election. Primary elections were held on June 14, 2022. The elections coincided with elections for other offices in North Dakota, including the US Senate, US House, North Dakota Secretary of State, North Dakota Attorney General, and the North Dakota House of Representatives.

The 2022 South Dakota House of Representatives elections were held on November 8, 2022, as part of the biennial 2022 United States elections. All 70 seats in the South Dakota House of Representatives were up for election. Primary elections were held on June 7, 2022. The elections coincided with elections for other offices in South Dakota, including the US Senate, US House, South Dakota Governor, South Dakota Secretary of State, South Dakota Attorney General, and the South Dakota Senate.

The 2022 Kentucky House of Representatives election was held on November 8, 2022. The Republican and Democratic primary elections were held on May 17. All 100 seats of the house were up for election. Republicans increased their majority in the chamber, gaining five seats.

The 2022 Maryland House of Delegates election was held on November 8, 2022, electing all 141 members of the chamber. This coincided with the election of all 47 of Maryland's state senators, along with other statewide offices. The Democratic and Republican primaries were held on July 19, 2022.

The 2023 Virginia Senate election was held on Tuesday, November 7, 2023, concurrently with elections for the Virginia House of Delegates, to elect senators to all 40 seats in the Senate of Virginia for the 163rd and 164th Virginia Assembly. Nomination primaries held through the Department of Elections were held June 20, 2023. These were the first elections held following redistricting as a result of the 2020 census. The Democrats retained control of the Senate.
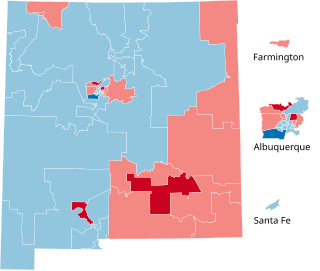
The 2012 New Mexico Senate election took place as part of the biennial United States elections. New Mexico voters elected state senators in all 42 of the state senate's districts. State senators serve four-year terms in the New Mexico Senate. The election coincided with elections for other offices, including for U.S. President, U.S. Senate, U.S House, and state house.
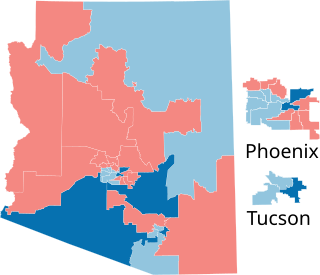
The 2012 Arizona Senate election was held on November 6, 2012. Voters elected members of the Arizona Senate in all 30 of the state's legislative districts to serve a two-year term. These were the first elections following the 2010 redistricting cycle. Since passage of Proposition 106 in 2000, redistricting in Arizona is done by the Arizona Independent Redistricting Commission (AIRC). Following redistricting, many incumbents were moved into new districts. Primary elections were held on August 28, 2012.