| |||||||||||||||||||||||||||||||||||||||||||||
All 151 seats in the Maine House of Representatives 76 seats needed for a majority | |||||||||||||||||||||||||||||||||||||||||||||
|---|---|---|---|---|---|---|---|---|---|---|---|---|---|---|---|---|---|---|---|---|---|---|---|---|---|---|---|---|---|---|---|---|---|---|---|---|---|---|---|---|---|---|---|---|---|
| Registered | 1,145,052 [1] [2] ( | ||||||||||||||||||||||||||||||||||||||||||||
| Turnout | 59.47% [3] ( | ||||||||||||||||||||||||||||||||||||||||||||
| |||||||||||||||||||||||||||||||||||||||||||||
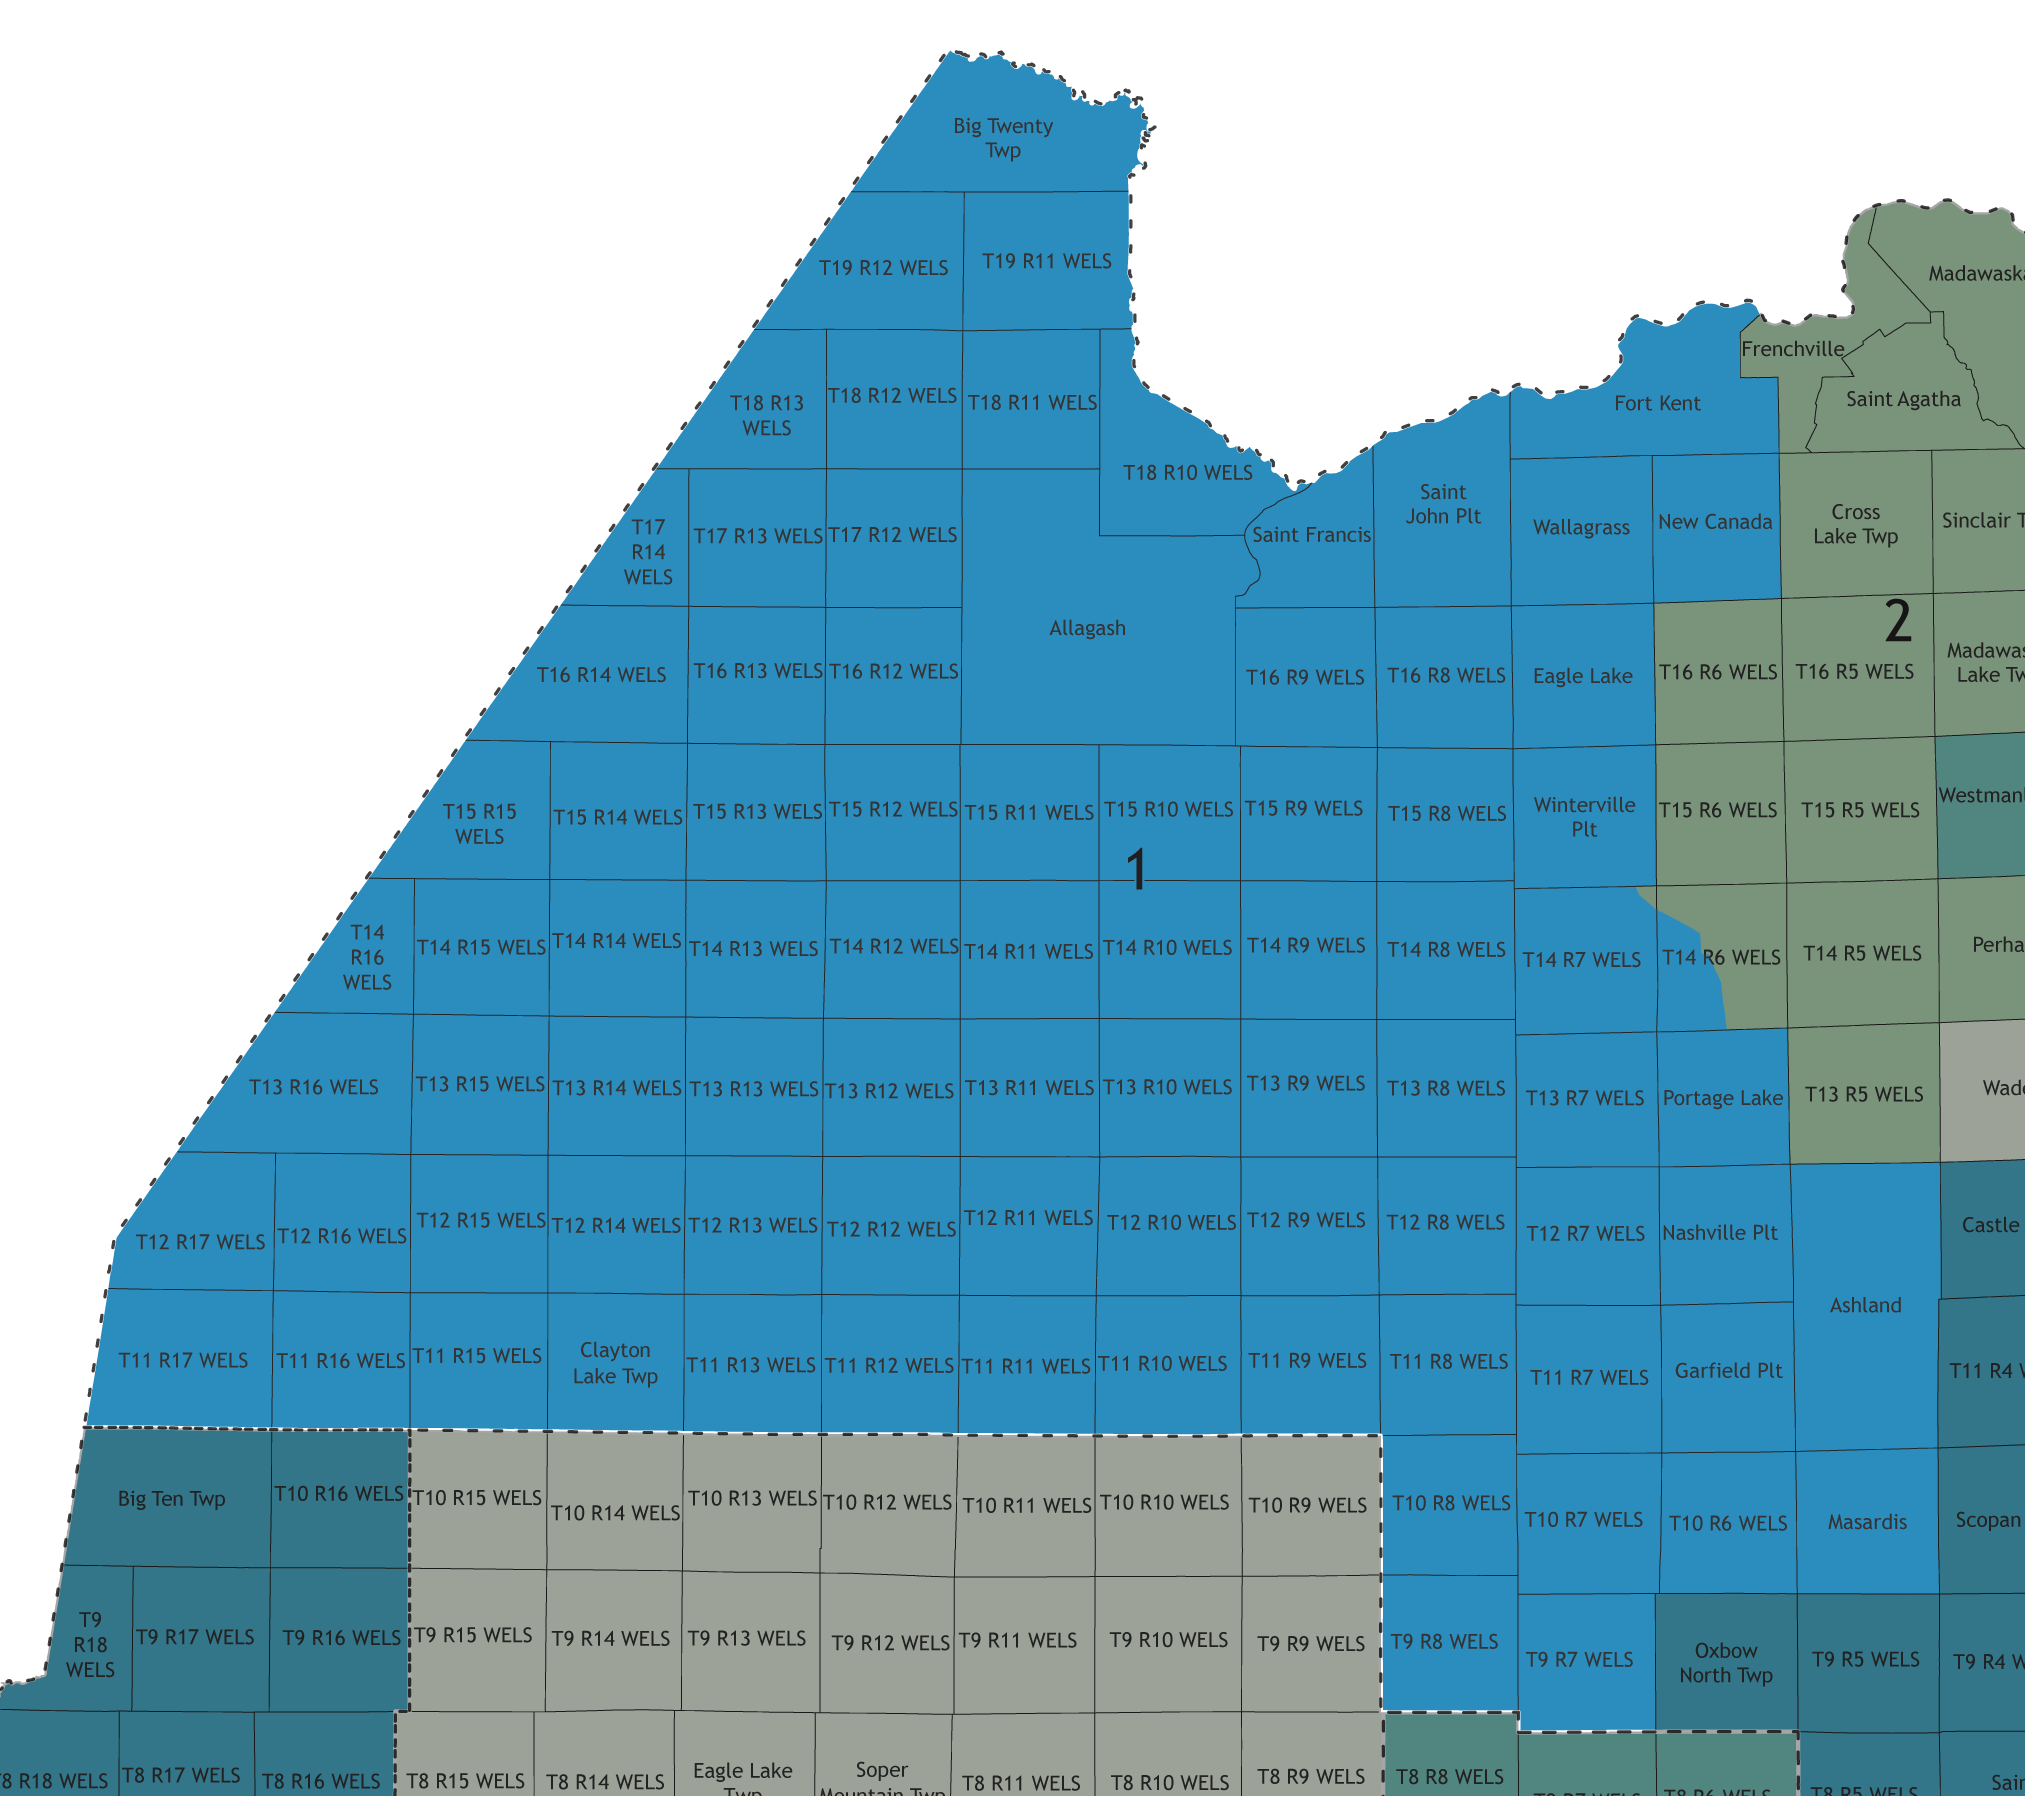
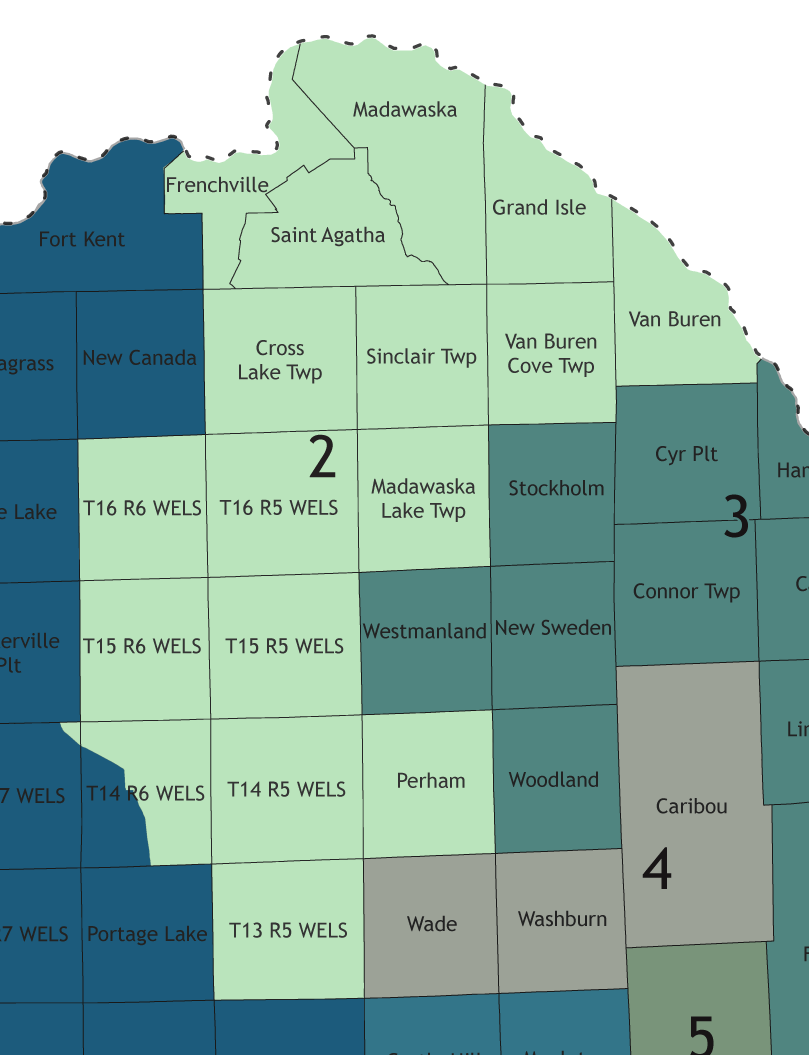
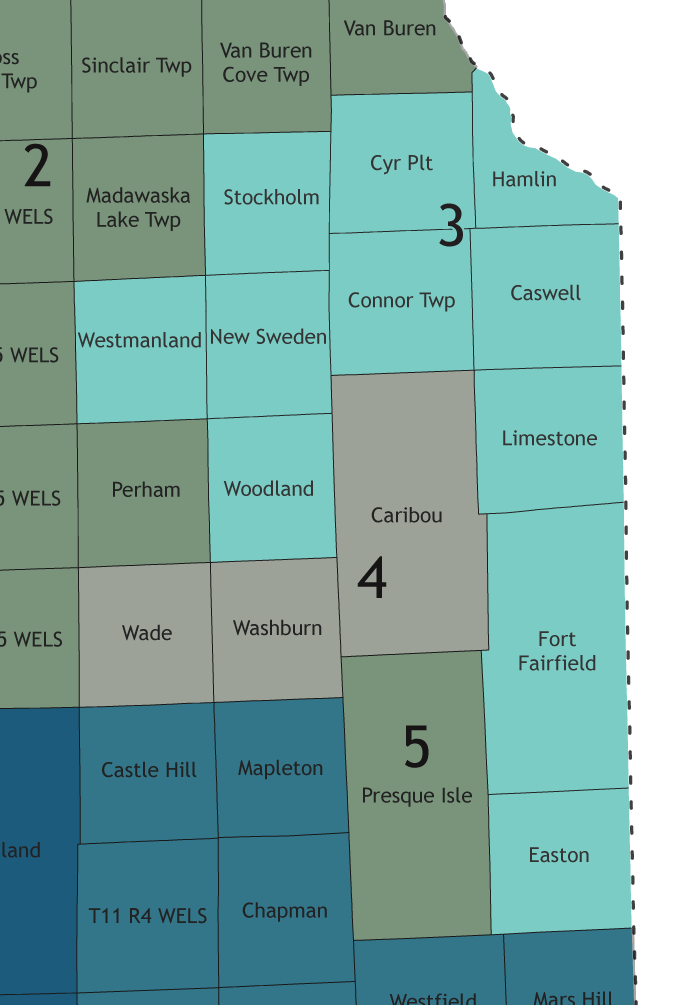
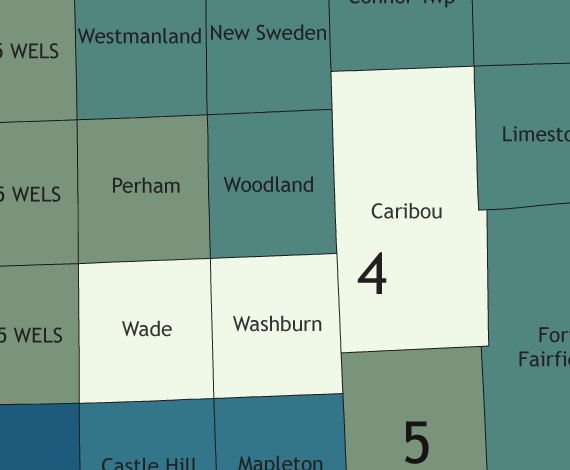
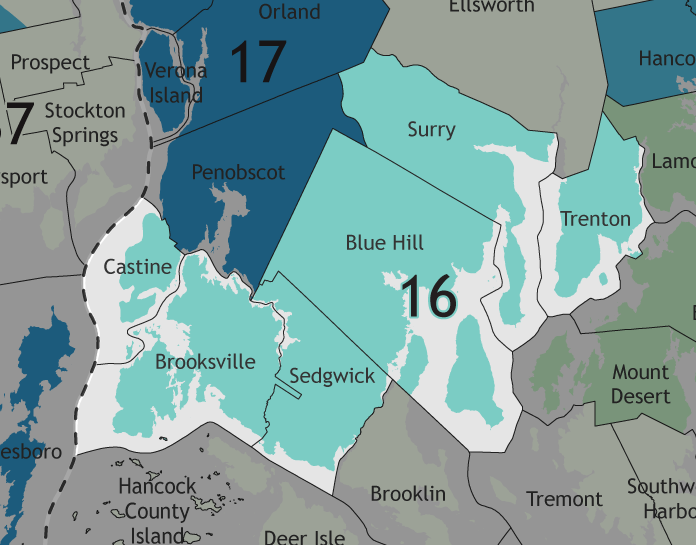
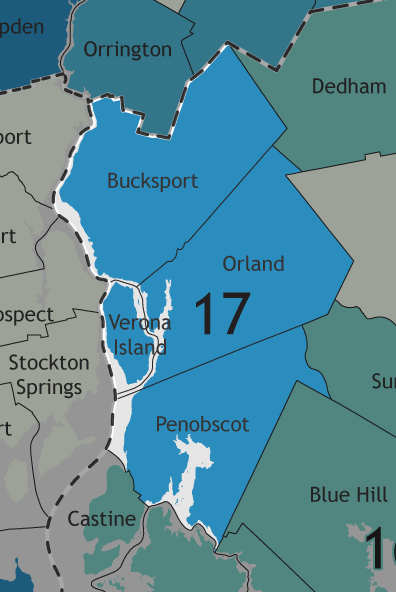
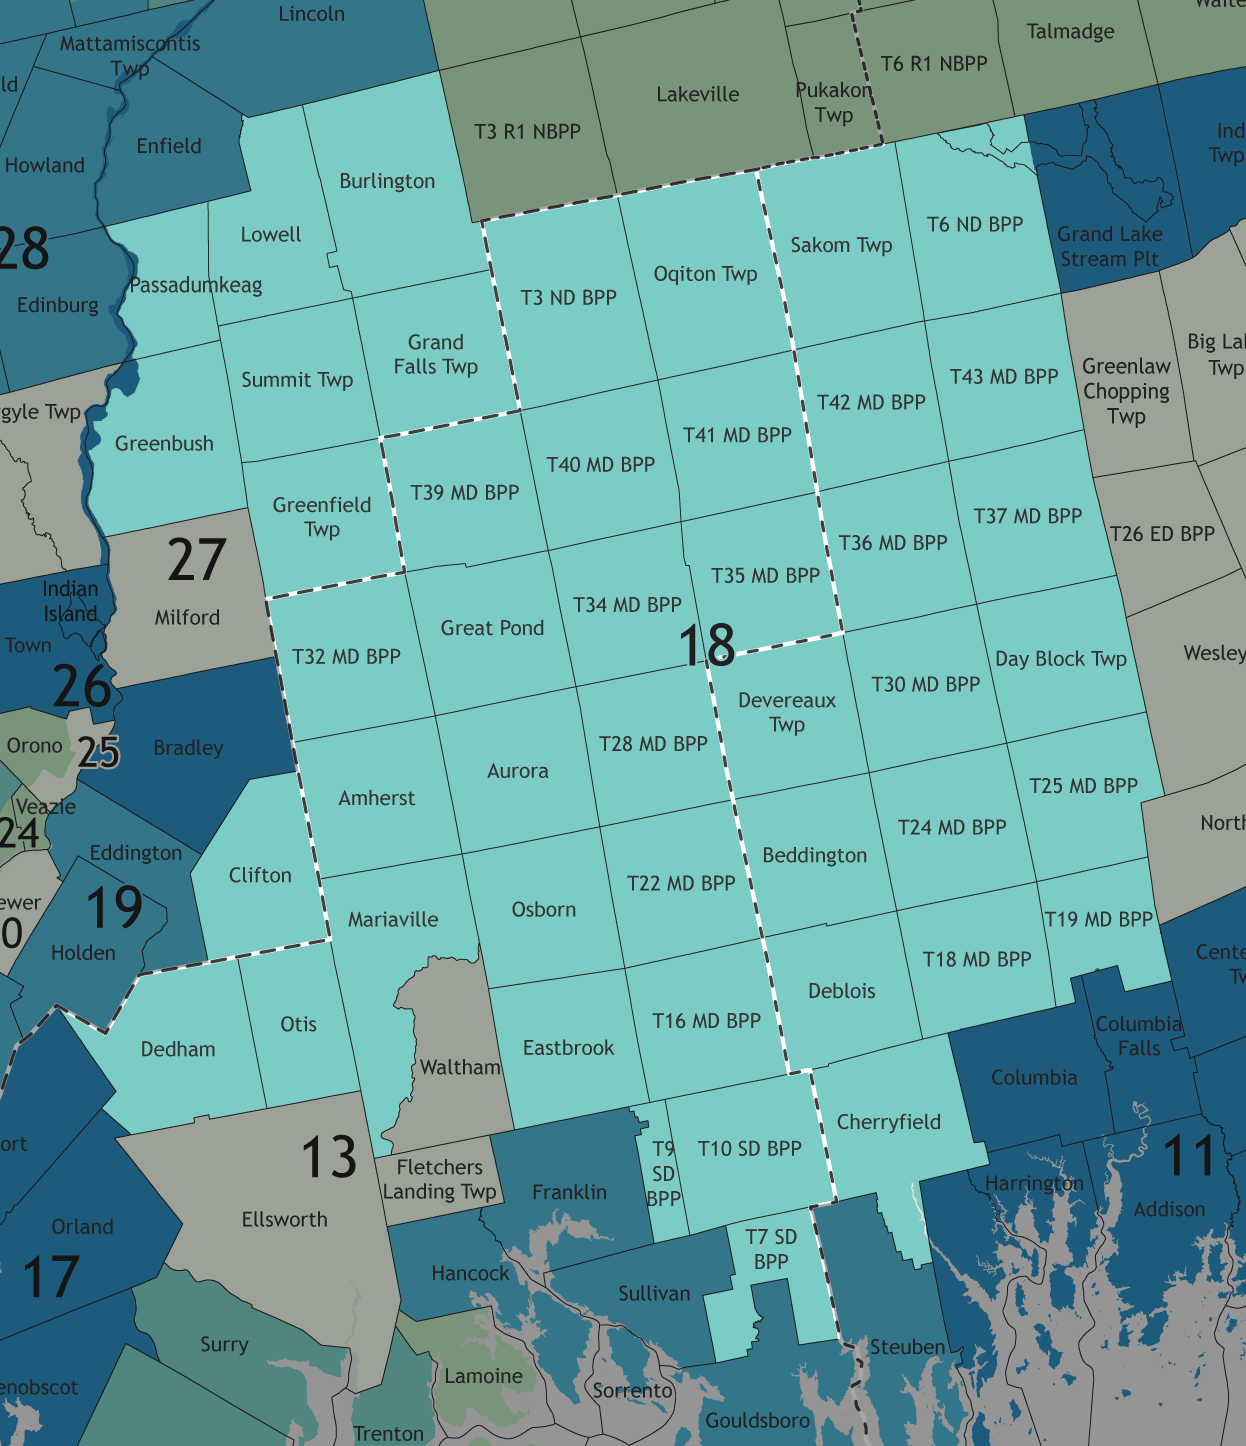
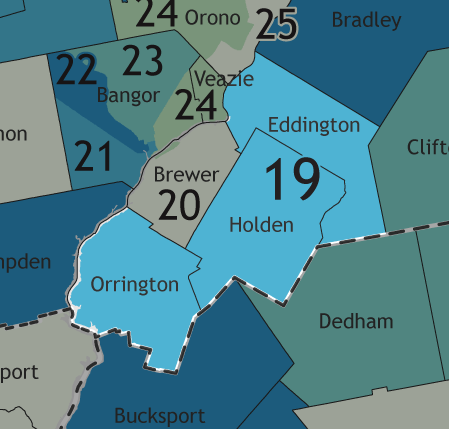
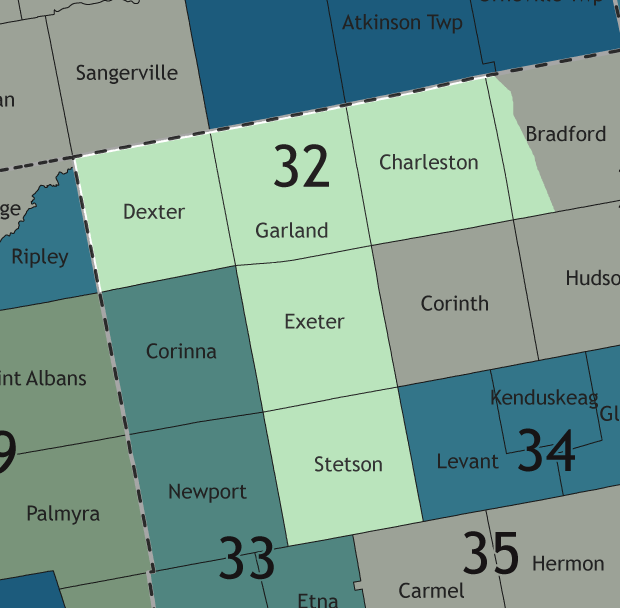
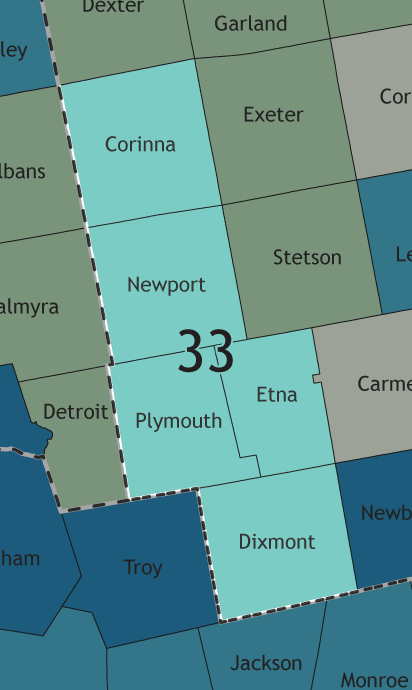
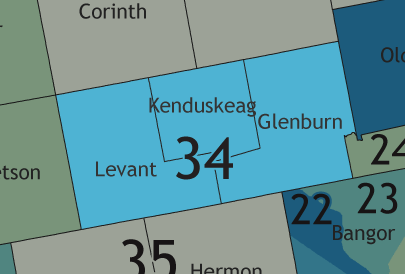
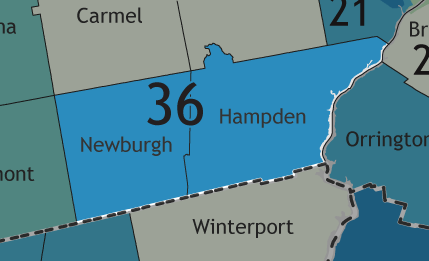
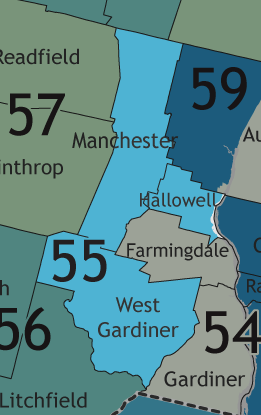
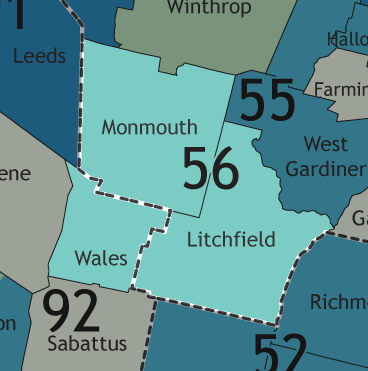
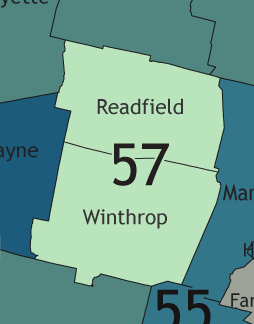
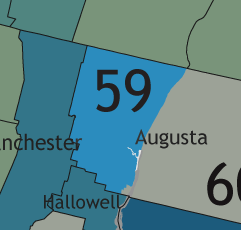
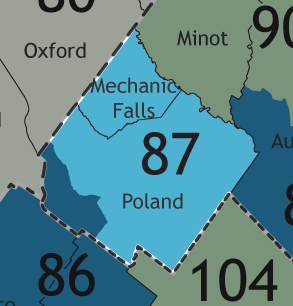
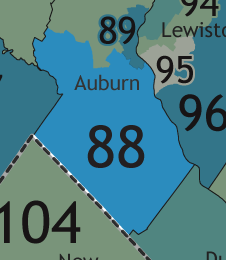
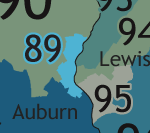
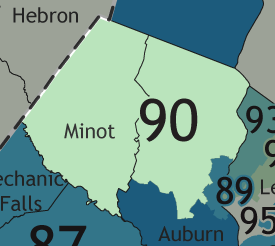
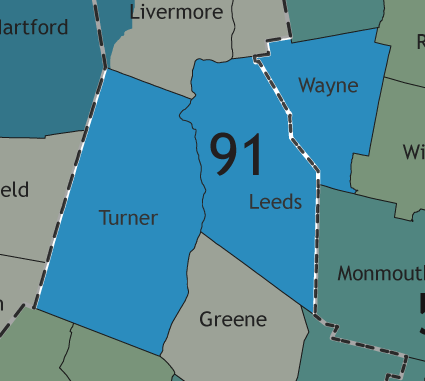
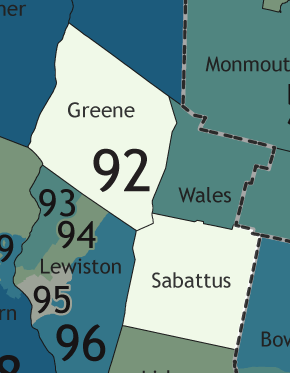
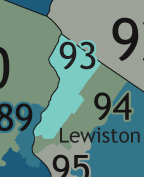
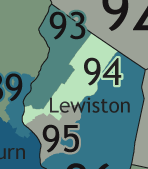
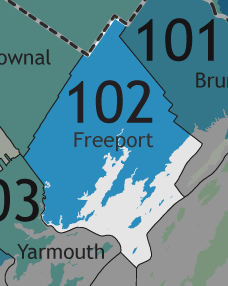
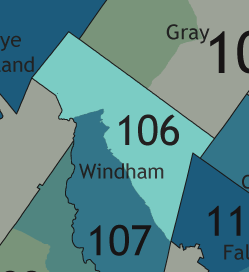
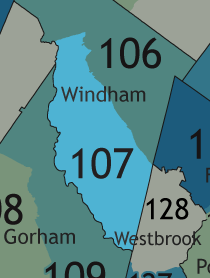
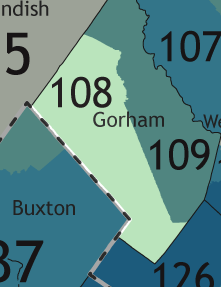
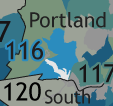
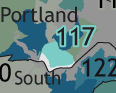
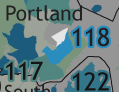
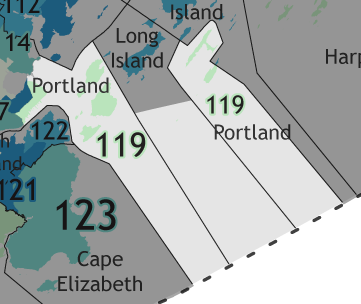
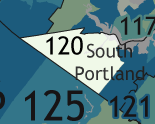
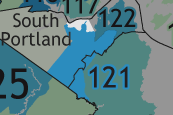
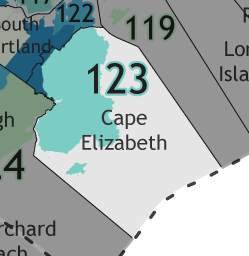
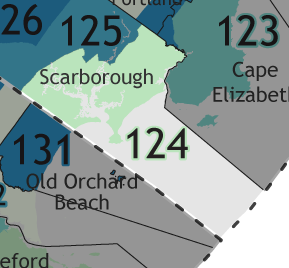
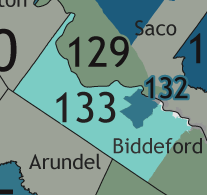
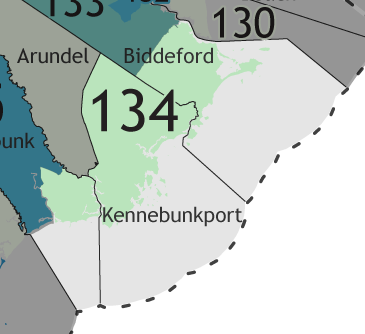
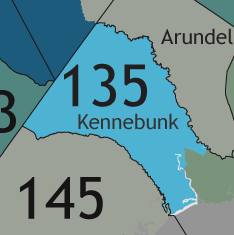
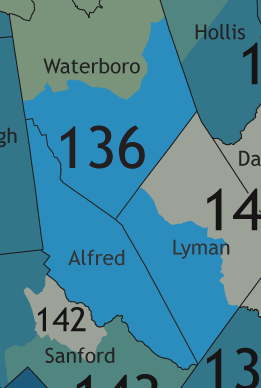
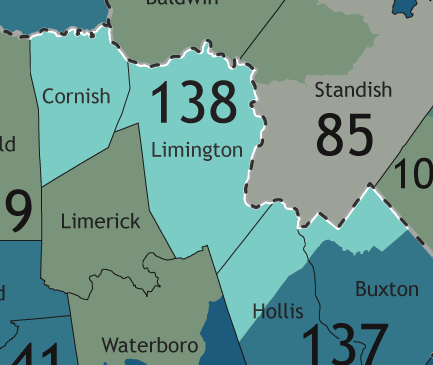
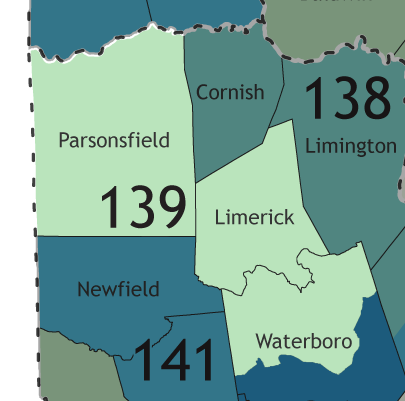
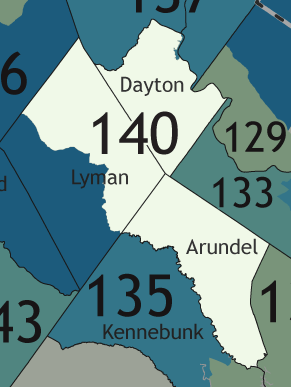
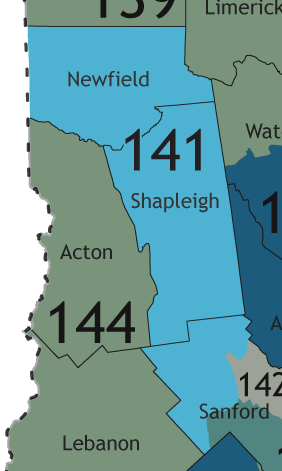
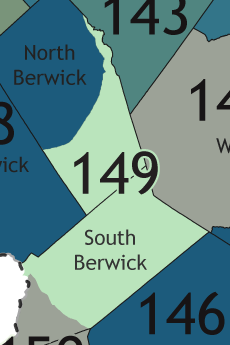
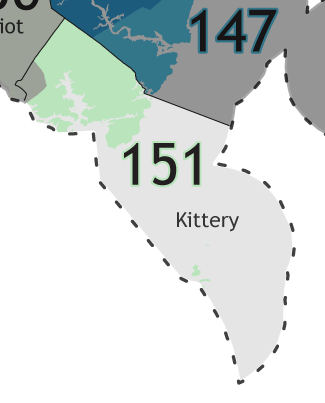
  Results: Democratic gain Republican gain Democratic hold Republican hold Independent hold Vote share: Democratic: 50–60% 60–70% 70–80% 80–90% >90% Republican: 40–50% 50–60% 60–70% 70–80% >90% Independent: 50–60% | |||||||||||||||||||||||||||||||||||||||||||||
| |||||||||||||||||||||||||||||||||||||||||||||
| Elections in Maine |
|---|
 |
The 2022 Maine House of Representatives elections took place on November 8, 2022, alongside the biennial United States elections. Maine voters elected members of the Maine House of Representatives via instant-runoff voting in all 151 of the state house's districts, as well as a non-voting member from the Passamaquoddy Tribe. These were the first elections in Maine following the 2020 United States redistricting cycle, which resulted in nearly all members being assigned to new districts.
Contents
- Predictions
- Overview
- Election
- Summary of results by House district
- Detailed results
- District 1
- District 2
- District 3
- District 4
- District 5
- District 6
- District 7
- District 8
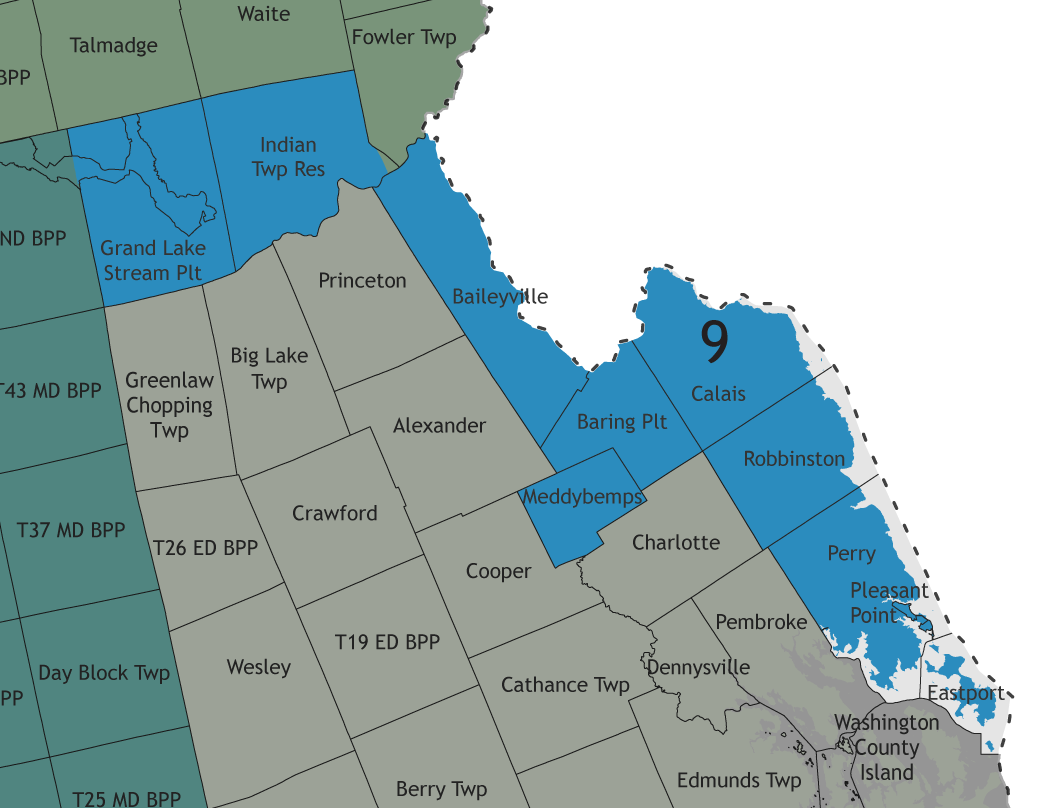
- District 9
- District 10
- District 11
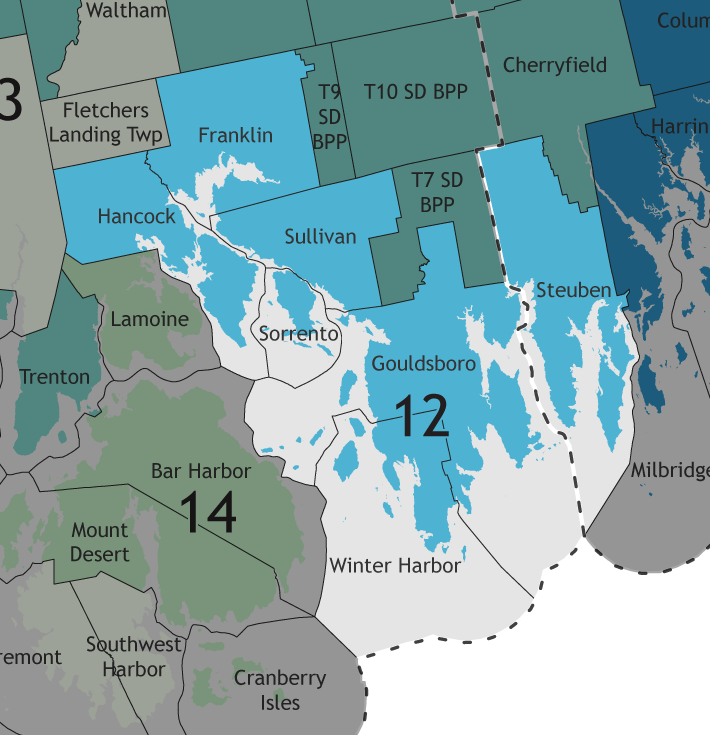
- District 12
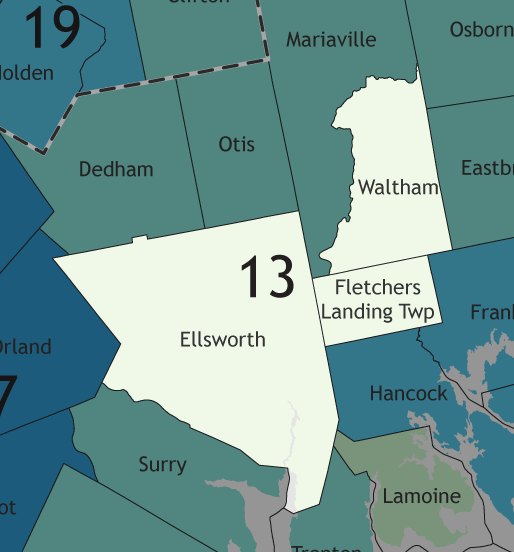
- District 13
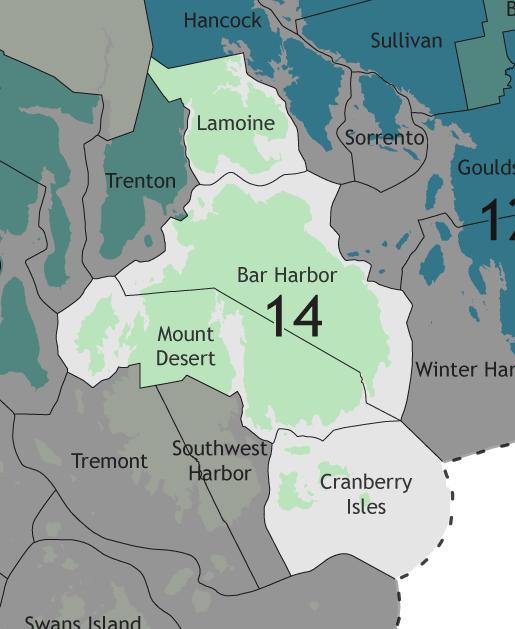
- District 14
- District 15
- District 16
- District 17
- District 18
- District 19
- District 20
- District 21
- District 22
- District 23
- District 24
- District 25
- District 26
- District 27
- District 28
- District 29
- District 30
- District 31
- District 32
- District 33
- District 34
- District 35
- District 36
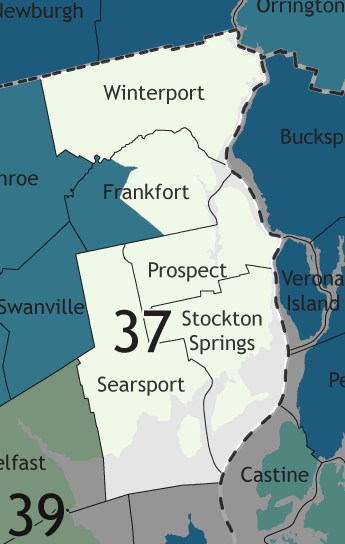
- District 37
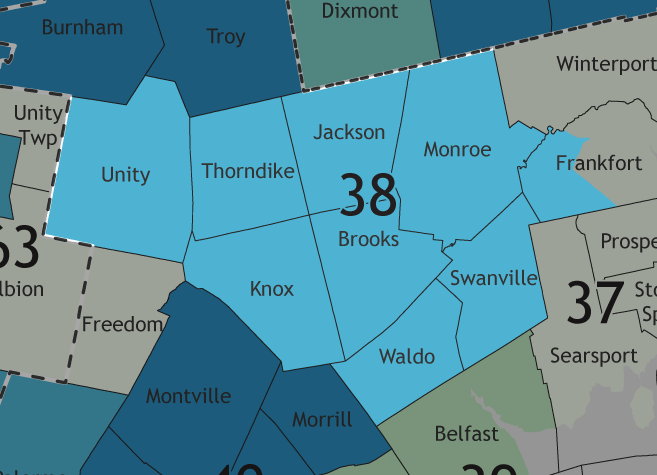
- District 38
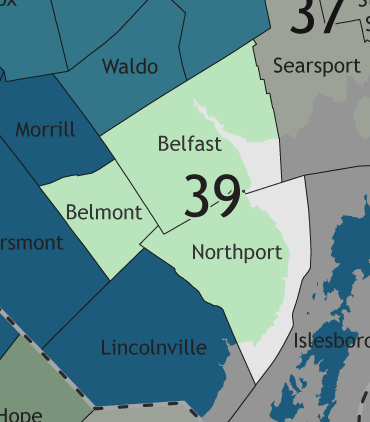
- District 39
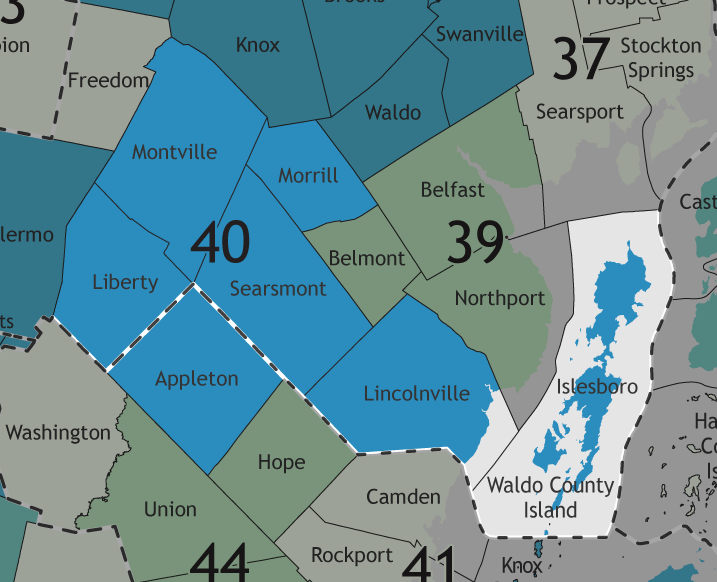
- District 40
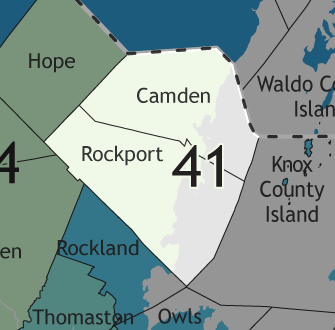
- District 41
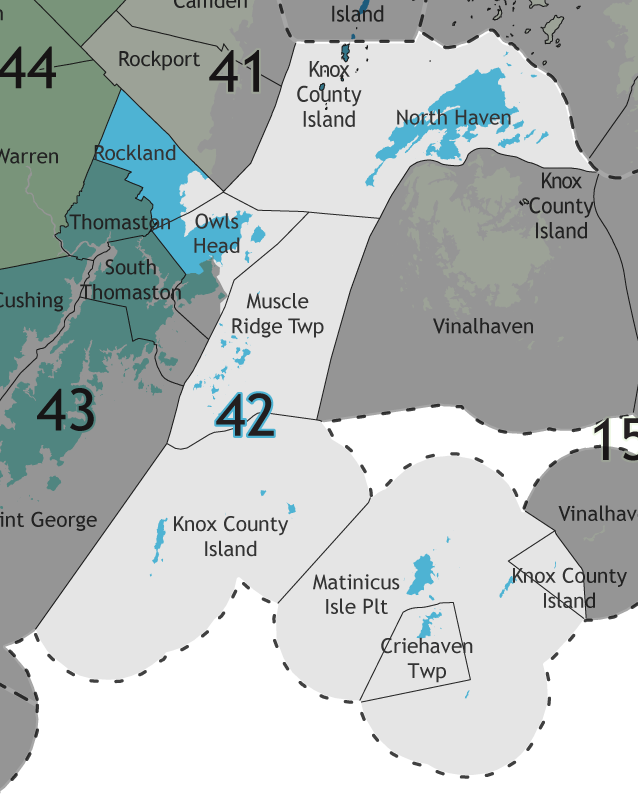
- District 42
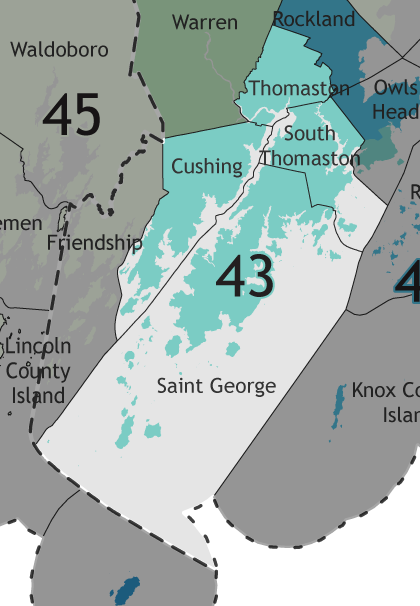
- District 43
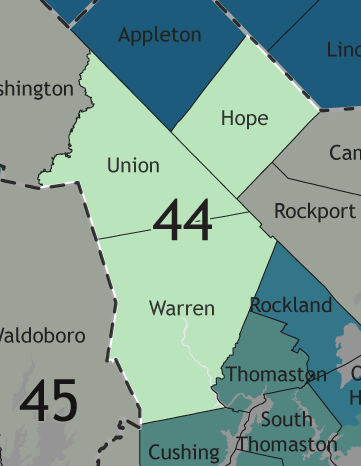
- District 44
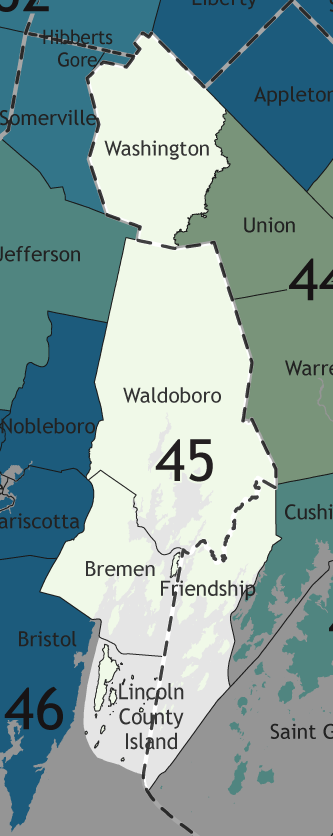
- District 45
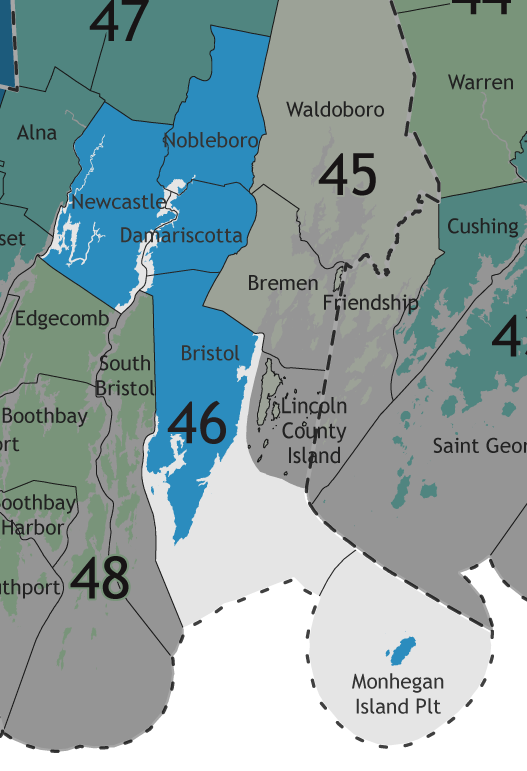
- District 46
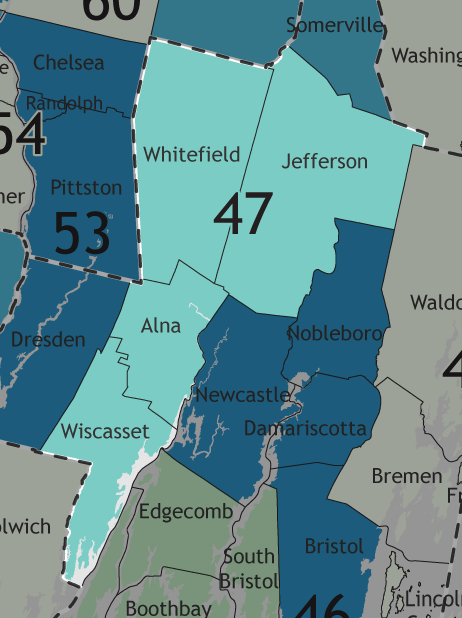
- District 47
- District 48
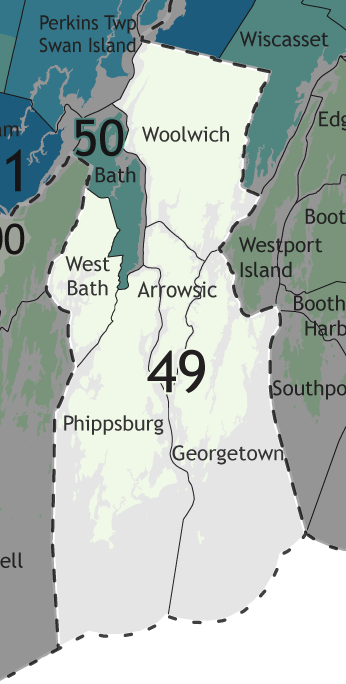
- District 49
- District 50
- District 51
- District 52
- District 53
- District 54
- District 55
- District 56
- District 57
- District 58
- District 59
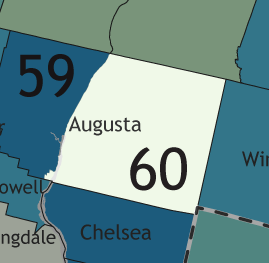
- District 60
- District 61
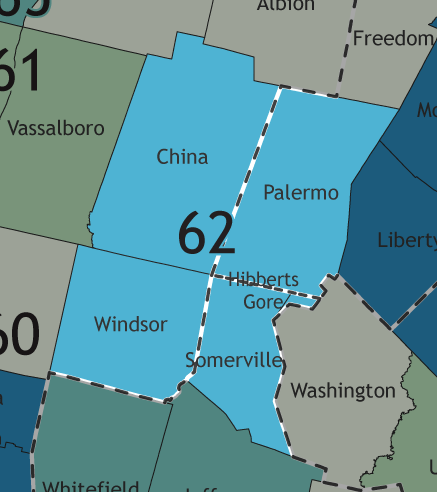
- District 62
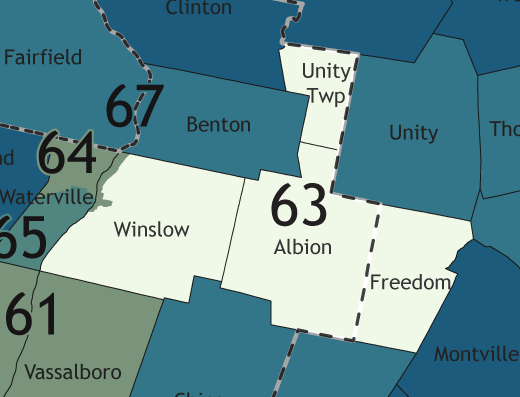
- District 63
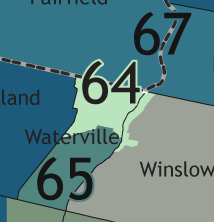
- District 64
- District 65
- District 66
- District 67
- District 68
- District 69
- District 70
- District 71
- District 72
- District 73
- District 74
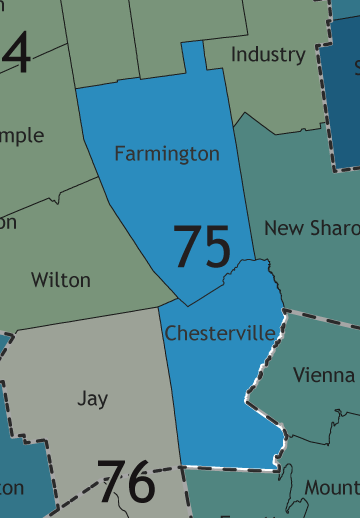
- District 75
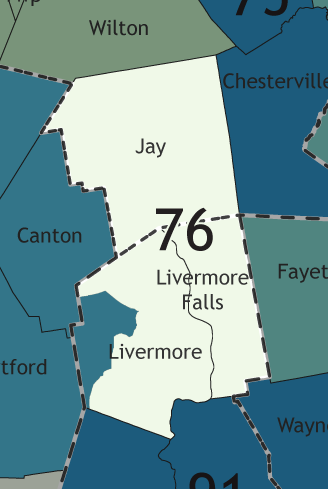
- District 76
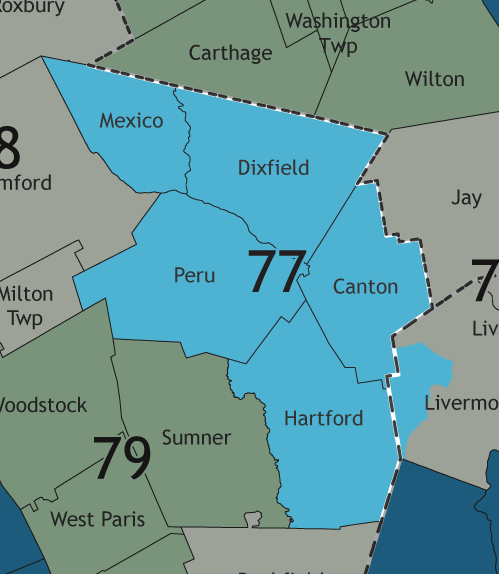
- District 77
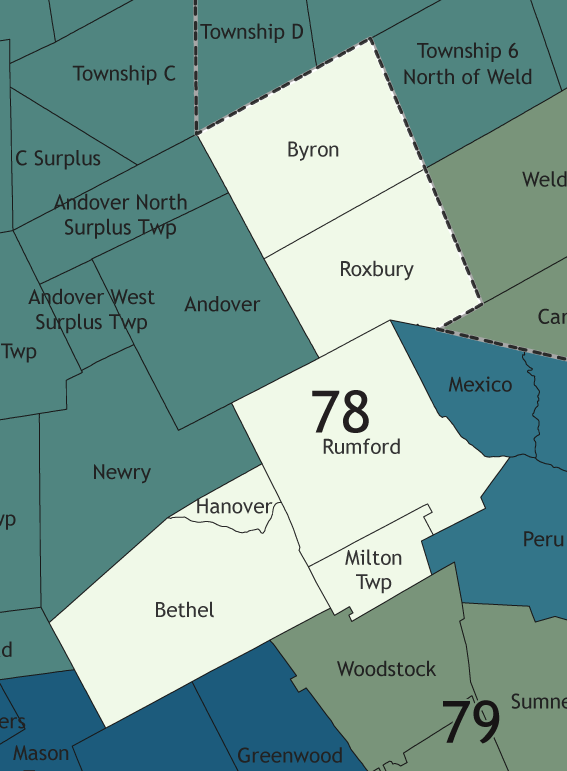
- District 78
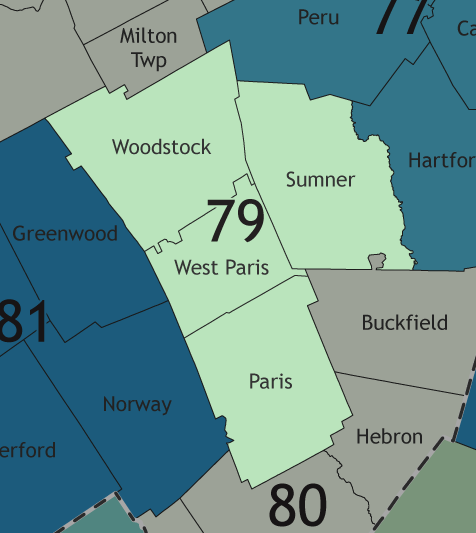
- District 79
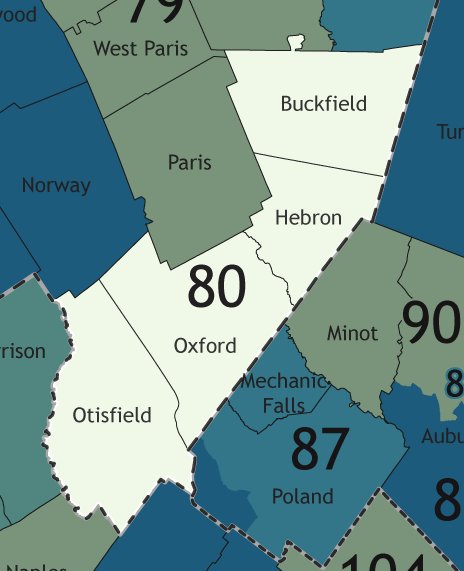
- District 80
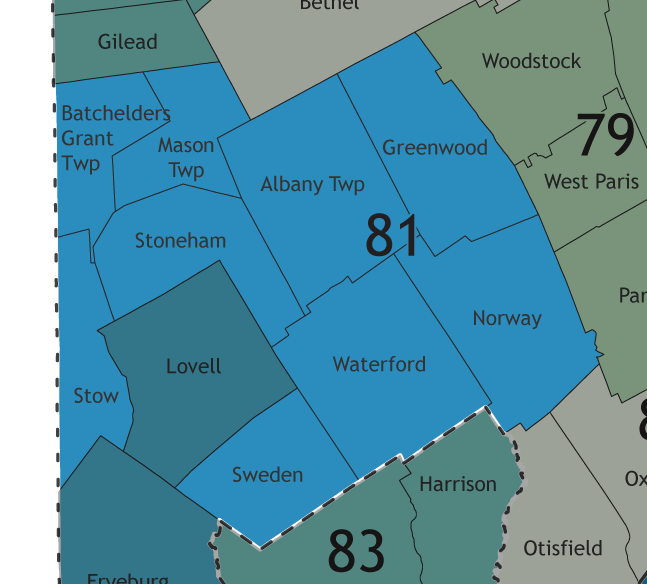
- District 81
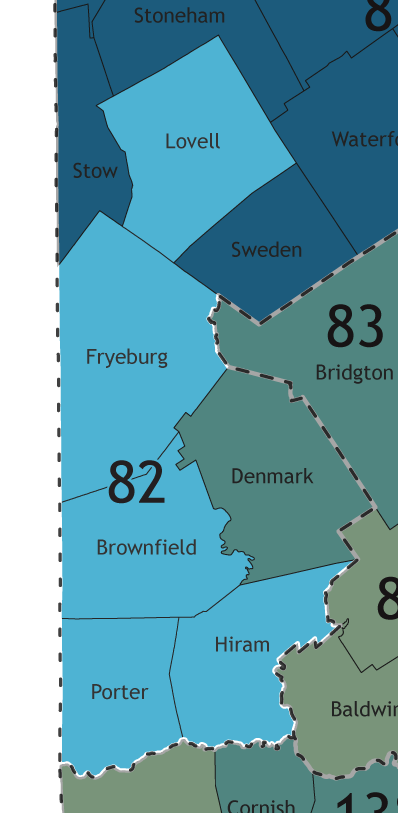
- District 82
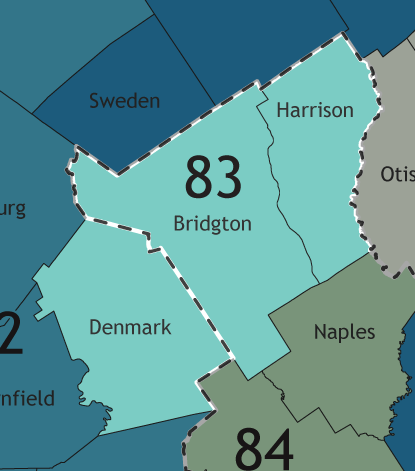
- District 83
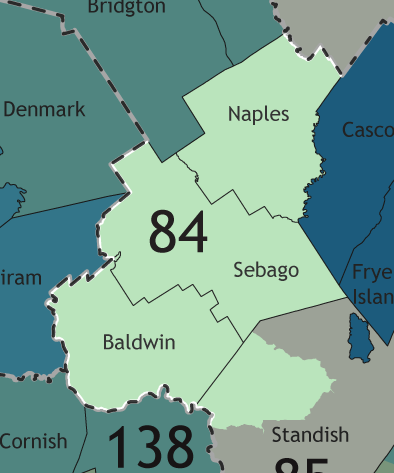
- District 84
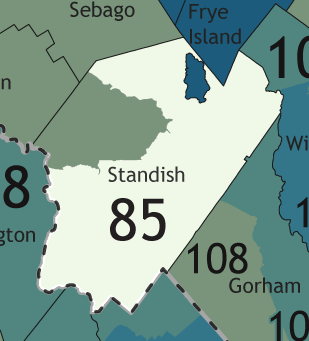
- District 85
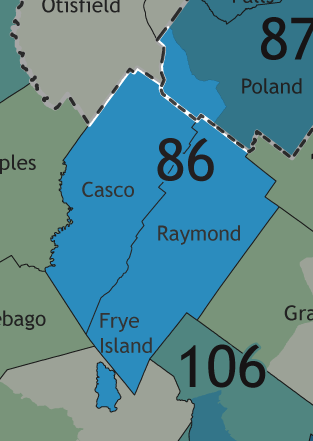
- District 86
- District 87
- District 88
- District 89
- District 90
- District 91
- District 92
- District 93
- District 94
- District 95
- District 96
- District 97
- District 98
- District 99
- District 100
- District 101
- District 102
- District 103
- District 104
- District 105
- District 106
- District 107
- District 108
- District 109
- District 110
- District 111
- District 112
- District 113
- District 114
- District 115
- District 116
- District 117
- District 118
- District 119
- District 120
- District 121
- District 122
- District 123
- District 124
- District 125
- District 126
- District 127
- District 128
- District 129
- District 130
- District 131
- District 132
- District 133
- District 134
- District 135
- District 136
- District 137
- District 138
- District 139
- District 140
- District 141
- District 142
- District 143
- District 144
- District 145
- District 146
- District 147
- District 148
- District 149
- District 150
- District 151
- See also
- Notes
- References
The election was also held alongside elections for the Maine Senate. State representatives serve two-year terms in the Maine State House. Democrats gained five seats and Republicans gained four seats, many of them previously vacant. [4]
