| |||||||||||||||||||||||||||||||||||||||||||||
All 75 seats in the Rhode Island House of Representatives 38 seats needed for a majority | |||||||||||||||||||||||||||||||||||||||||||||
---|---|---|---|---|---|---|---|---|---|---|---|---|---|---|---|---|---|---|---|---|---|---|---|---|---|---|---|---|---|---|---|---|---|---|---|---|---|---|---|---|---|---|---|---|---|
| |||||||||||||||||||||||||||||||||||||||||||||
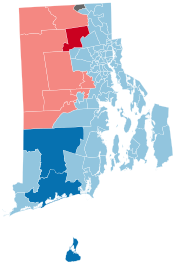
Results: Democratic hold Democratic gain Republican hold Republican gain Independent gain | |||||||||||||||||||||||||||||||||||||||||||||
|
Elections in Rhode Island |
---|
The 2022 Rhode Island House of Representatives elections took place on November 8, 2022. [1] Primary elections were held on September 13, 2022. [2] Rhode Island voters elected state representatives in all 75 seats of the House of Representatives to serve two-year terms. [3]
The election coincided with United States national elections and Rhode Island state elections, including U.S. House, Governor, and Rhode Island Senate. [4] [5] Since the previous election in 2020, Democrats held a 65-to-10-seat supermajority over Republicans. Democrats maintained the supermajority in 2022, winning 65 seats. Republicans decreased to nine seats while Jon D. Brien was the sole Independent elected. [6]
These were the first elections in Rhode Island following the 2020 United States redistricting cycle, which resulted in redrawn legislative district boundaries. [7]
Source | Ranking | As of |
---|---|---|
Sabato's Crystal Ball [8] | Safe D | May 19, 2022 |
Italics denote an open seat held by the incumbent party; bold text denotes a gain for a party. [9] [10] [11]
Sources for election results: [12] [13] [14]
Party | Candidate | Votes | % | |
---|---|---|---|---|
Democratic Party Primary Results | ||||
Democratic | Edith Hanover Ajello (incumbent) | 1,552 | 100.00% | |
Total votes | 1,552 | 100.00% |
Party | Candidate | Votes | % | |
---|---|---|---|---|
Democratic | Edith Hanover Ajello (incumbent) | 2,444 | 88.04% | |
Independent | Thomas Edward O'Connell | 332 | 11.96% | |
Total votes | 2,776 | 100.00% | ||
Democratic hold |
Party | Candidate | Votes | % | |
---|---|---|---|---|
Democratic Party Primary Results | ||||
Democratic | Christopher R. Blazejewski (incumbent) | 1,340 | 73.87% | |
Democratic | Savannah H. DaCruz | 474 | 26.13% | |
Total votes | 1,814 | 100.00% |
Party | Candidate | Votes | % | |
---|---|---|---|---|
Democratic | Christopher R. Blazejewski (incumbent) | 3,122 | 100.00% | |
Total votes | 3,122 | 100.00% | ||
Democratic hold |
Party | Candidate | Votes | % | |
---|---|---|---|---|
Democratic Party Primary Results | ||||
Democratic | Nathan W. Biah (incumbent) | 719 | 100.00% | |
Total votes | 719 | 100.00% |
Party | Candidate | Votes | % | |
---|---|---|---|---|
Democratic | Nathan W. Biah (incumbent) | 1,428 | 100.00% | |
Total votes | 1,428 | 100.00% | ||
Democratic hold |
Party | Candidate | Votes | % | |
---|---|---|---|---|
Democratic Party Primary Results | ||||
Democratic | Rebecca M. Kislak (incumbent) | 3,203 | 100.00% | |
Total votes | 3,203 | 100.00% | ||
Republican Party Primary Results | ||||
Republican | Alex W. Cannon | 46 | 100.00% | |
Total votes | 46 | 100.00% |
Party | Candidate | Votes | % | |
---|---|---|---|---|
Democratic | Rebecca M. Kislak (incumbent) | 5,021 | 88.82% | |
Republican | Alex W. Cannon | 632 | 11.18% | |
Total votes | 5,653 | 100.00% | ||
Democratic hold |
Party | Candidate | Votes | % | |
---|---|---|---|---|
Democratic Party Primary Results | ||||
Democratic | Anthony J. DeSimone | 735 | 52.31% | |
Democratic | Raphael Olawale Okelola | 256 | 18.22% | |
Democratic | Diana Garlington | 218 | 15.52% | |
Democratic | Torlo Kormasa Amos | 196 | 13.95% | |
Total votes | 1,405 | 100.00% |
Party | Candidate | Votes | % | |
---|---|---|---|---|
Democratic | Anthony J. DeSimone | 1,880 | 80.14% | |
Independent | Stacey Jana Capizzano | 466 | 19.86% | |
Total votes | 2,346 | 100.00% | ||
Democratic hold |
Party | Candidate | Votes | % | |
---|---|---|---|---|
Democratic Party Primary Results | ||||
Democratic | Raymond A. Hull (incumbent) | 1,269 | 60.78% | |
Democratic | Damian A. Lima | 819 | 39.22% | |
Total votes | 2,088 | 100.00% |
Party | Candidate | Votes | % | |
---|---|---|---|---|
Democratic | Raymond A. Hull (incumbent) | 3,091 | 100.00% | |
Total votes | 3,091 | 100.00% | ||
Democratic hold |
Party | Candidate | Votes | % | |
---|---|---|---|---|
Democratic Party Primary Results | ||||
Democratic | David Morales (incumbent) | 1,469 | 100.00% | |
Total votes | 1,469 | 100.00% |
Party | Candidate | Votes | % | |
---|---|---|---|---|
Democratic | David Morales (incumbent) | 2,154 | 81.99% | |
Independent | Christopher L. Ireland | 473 | 18.01% | |
Total votes | 2,627 | 100.00% | ||
Democratic hold |
Party | Candidate | Votes | % | |
---|---|---|---|---|
Democratic Party Primary Results | ||||
Democratic | John J. Lombardi (incumbent) | 1,140 | 100.00% | |
Total votes | 1,140 | 100.00% |
Party | Candidate | Votes | % | |
---|---|---|---|---|
Democratic | John J. Lombardi (incumbent) | 2,216 | 100.00% | |
Total votes | 2,216 | 100.00% | ||
Democratic hold |
Party | Candidate | Votes | % | |
---|---|---|---|---|
Democratic Party Primary Results | ||||
Democratic | Enrique George Sanchez | 802 | 53.57% | |
Democratic | Anastasia P. Williams (incumbent) | 587 | 39.21% | |
Democratic | Lonnie L. Mangum | 108 | 7.21% | |
Total votes | 1,497 | 100.00% |
Party | Candidate | Votes | % | |
---|---|---|---|---|
Democratic | Enrique George Sanchez | 1,836 | 100.00% | |
Total votes | 1,836 | 100.00% | ||
Democratic hold |
Party | Candidate | Votes | % | |
---|---|---|---|---|
Democratic Party Primary Results | ||||
Democratic | Scott A. Slater (incumbent) | 1,089 | 100.00% | |
Total votes | 1,089 | 100.00% |
Party | Candidate | Votes | % | |
---|---|---|---|---|
Democratic | Scott A. Slater (incumbent) | 1,628 | 100.00% | |
Total votes | 1,628 | 100.00% | ||
Democratic hold |
Party | Candidate | Votes | % | |
---|---|---|---|---|
Democratic Party Primary Results | ||||
Democratic | Grace Diaz (incumbent) | 1,027 | 65.12% | |
Democratic | Laura Perez | 550 | 34.88% | |
Total votes | 1,577 | 100.00% | ||
Republican Party Primary Results | ||||
Republican | Emmanuel C. Nyema | 26 | 100.00% | |
Total votes | 26 | 100.00% |
Party | Candidate | Votes | % | |
---|---|---|---|---|
Democratic | Grace Diaz (incumbent) | 1,739 | 86.43% | |
Republican | Emmanuel C. Nyema | 273 | 13.57% | |
Total votes | 2,012 | 100.00% | ||
Democratic hold |
Party | Candidate | Votes | % | |
---|---|---|---|---|
Democratic Party Primary Results | ||||
Democratic | Jose F. Batista (incumbent) | 1,046 | 100.00% | |
Total votes | 1,046 | 100.00% |
Party | Candidate | Votes | % | |
---|---|---|---|---|
Democratic | Jose F. Batista (incumbent) | 1,418 | 100.00% | |
Total votes | 1,418 | 100.00% | ||
Democratic hold |
Party | Candidate | Votes | % | |
---|---|---|---|---|
Democratic Party Primary Results | ||||
Democratic | Ramon A. Perez (incumbent) | 1,090 | 100.00% | |
Total votes | 1,090 | 100.00% |
Party | Candidate | Votes | % | |
---|---|---|---|---|
Democratic | Ramon A. Perez (incumbent) | 1,376 | 64.48% | |
Independent | Ivan J. Montanez | 758 | 35.52% | |
Total votes | 2,134 | 100.00% | ||
Democratic hold |
Party | Candidate | Votes | % | |
---|---|---|---|---|
Democratic Party Primary Results | ||||
Democratic | Charlene Lima (incumbent) | 557 | 59.13% | |
Democratic | Giona A. Picheco | 385 | 40.87% | |
Total votes | 942 | 100.00% |
Party | Candidate | Votes | % | |
---|---|---|---|---|
Democratic | Charlene Lima (incumbent) | 2,127 | 100.00% | |
Total votes | 2,127 | 100.00% | ||
Democratic hold |
Party | Candidate | Votes | % | |
---|---|---|---|---|
Republican Party Primary Results | ||||
Republican | Barbara Ann Fenton Fung (incumbent) | 591 | 92.34% | |
Republican | Suzanne Michelle Downing | 49 | 7.66% | |
Total votes | 640 | 100.00% |
Party | Candidate | Votes | % | |
---|---|---|---|---|
Republican | Barbara Ann Fenton Fung (incumbent) | 4,978 | 100.00% | |
Total votes | 4,978 | 100.00% | ||
Republican hold |
Party | Candidate | Votes | % | |
---|---|---|---|---|
Democratic Party Primary Results | ||||
Democratic | Brandon C. Potter (incumbent) | 960 | 67.32% | |
Democratic | Natalya DelSanto | 466 | 32.68% | |
Total votes | 1,426 | 100.00% | ||
Republican Party Primary Results | ||||
Republican | Jason John Klas | 273 | 100.00% | |
Total votes | 273 | 100.00% |
Party | Candidate | Votes | % | |
---|---|---|---|---|
Democratic | Brandon C. Potter (incumbent) | 2,760 | 58.07% | |
Republican | Jason John Klas | 1,993 | 41.93% | |
Total votes | 4,753 | 100.00% | ||
Democratic hold |
Party | Candidate | Votes | % | |
---|---|---|---|---|
Democratic Party Primary Results | ||||
Democratic | Jacquelyn M. Baginski (incumbent) | 1,077 | 100.00% | |
Total votes | 1,077 | 100.00% |
Party | Candidate | Votes | % | |
---|---|---|---|---|
Democratic | Jacquelyn M. Baginski (incumbent) | 3,741 | 100.00% | |
Total votes | 3,741 | 100.00% | ||
Democratic hold |
Party | Candidate | Votes | % | |
---|---|---|---|---|
Democratic Party Primary Results | ||||
Democratic | Arthur Handy (incumbent) | 1,156 | 100.00% | |
Total votes | 1,156 | 100.00% |
Party | Candidate | Votes | % | |
---|---|---|---|---|
Democratic | Arthur Handy (incumbent) | 3,072 | 100.00% | |
Total votes | 3,072 | 100.00% | ||
Democratic hold |
Party | Candidate | Votes | % | |
---|---|---|---|---|
Democratic Party Primary Results | ||||
Democratic | Joseph McNamara (incumbent) | 2,070 | 68.18% | |
Democratic | Stuart A. Wilson | 966 | 31.82% | |
Total votes | 3,036 | 100.00% |
Party | Candidate | Votes | % | |
---|---|---|---|---|
Democratic | Joseph McNamara (incumbent) | 5,888 | 100.00% | |
Total votes | 5,888 | 100.00% | ||
Democratic hold |
Party | Candidate | Votes | % | |
---|---|---|---|---|
Democratic Party Primary Results | ||||
Democratic | David A. Bennett (incumbent) | 1,284 | 100.00% | |
Total votes | 1,284 | 100.00% |
Party | Candidate | Votes | % | |
---|---|---|---|---|
Democratic | David A. Bennett (incumbent) | 3,167 | 62.38% | |
Independent | Dan Elliott | 1,910 | 37.62% | |
Total votes | 5,077 | 100.00% | ||
Democratic hold |
Party | Candidate | Votes | % | |
---|---|---|---|---|
Democratic Party Primary Results | ||||
Democratic | Camille F. Vella-Wilkinson (incumbent) | 866 | 51.58% | |
Democratic | Capri C. Catanzaro | 813 | 48.42% | |
Total votes | 1,679 | 100.00% | ||
Republican Party Primary Results | ||||
Republican | Marie A. Hopkins | 384 | 100.00% | |
Total votes | 384 | 100.00% |
Party | Candidate | Votes | % | |
---|---|---|---|---|
Democratic | Camille F. Vella-Wilkinson (incumbent) | 2,618 | 50.37% | |
Republican | Marie A. Hopkins | 2,580 | 49.63% | |
Total votes | 5,198 | 100.00% | ||
Democratic hold |
Party | Candidate | Votes | % | |
---|---|---|---|---|
Democratic Party Primary Results | ||||
Democratic | Joseph J. Solomon, Jr. (incumbent) | 993 | 67.19% | |
Democratic | Zakary J. Pereira | 485 | 32.81% | |
Total votes | 1,478 | 100.00% | ||
Republican Party Primary Results | ||||
Republican | David Stone | 344 | 100.00% | |
Total votes | 344 | 100.00% |
Party | Candidate | Votes | % | |
---|---|---|---|---|
Democratic | Joseph J. Solomon, Jr. (incumbent) | 3,034 | 56.22% | |
Republican | David Stone | 2,363 | 43.78% | |
Total votes | 5,397 | 100.00% | ||
Democratic hold |
Party | Candidate | Votes | % | |
---|---|---|---|---|
Democratic Party Primary Results | ||||
Democratic | K. Joseph Shekarchi (incumbent) | 1,271 | 69.72% | |
Democratic | Jacqueline M. Anderson | 552 | 30.28% | |
Total votes | 1,823 | 100.00% | ||
Republican Party Primary Results | ||||
Republican | Dana James Traversie | 359 | 100.00% | |
Total votes | 359 | 100.00% |
Party | Candidate | Votes | % | |
---|---|---|---|---|
Democratic | K. Joseph Shekarchi (incumbent) | 3,416 | 59.99% | |
Republican | Dana James Traversie | 2,278 | 40.01% | |
Total votes | 5,694 | 100.00% | ||
Democratic hold |
Party | Candidate | Votes | % | |
---|---|---|---|---|
Democratic Party Primary Results | ||||
Democratic | Evan Patrick Shanley (incumbent) | 1,722 | 100.00% | |
Total votes | 1,722 | 100.00% |
Party | Candidate | Votes | % | |
---|---|---|---|---|
Democratic | Evan Patrick Shanley (incumbent) | 4,364 | 64.91% | |
Independent | Jonathan H. Martin | 2,359 | 35.09% | |
Total votes | 6,723 | 100.00% | ||
Democratic hold |
Party | Candidate | Votes | % | |
---|---|---|---|---|
Democratic Party Primary Results | ||||
Democratic | Thomas E. Noret (incumbent) | 653 | 100.00% | |
Total votes | 653 | 100.00% |
Party | Candidate | Votes | % | |
---|---|---|---|---|
Democratic | Thomas E. Noret (incumbent) | 2,891 | 100.00% | |
Total votes | 2,891 | 100.00% | ||
Democratic hold |
Party | Candidate | Votes | % | |
---|---|---|---|---|
Republican Party Primary Results | ||||
Republican | Patricia L. Morgan (incumbent) | 380 | 100.00% | |
Total votes | 380 | 100.00% | ||
Democratic Party Primary Results | ||||
Democratic | Samara R. Yelle | 825 | 100.00% | |
Total votes | 825 | 100.00% |
Party | Candidate | Votes | % | |
---|---|---|---|---|
Republican | Patricia L. Morgan (incumbent) | 2,919 | 59.08% | |
Democratic | Samara R. Yelle | 2,022 | 40.92% | |
Total votes | 4,941 | 100.00% | ||
Republican hold |
Party | Candidate | Votes | % | |
---|---|---|---|---|
Democratic Party Primary Results | ||||
Democratic | Patricia A. Serpa (incumbent) | 1,004 | 100.00% | |
Total votes | 1,004 | 100.00% | ||
Republican Party Primary Results | ||||
Republican | Andrew N. Kowalski | 377 | 100.00% | |
Total votes | 377 | 100.00% |
Party | Candidate | Votes | % | |
---|---|---|---|---|
Democratic | Patricia A. Serpa (incumbent) | 3,216 | 58.69% | |
Republican | Andrew N. Kowalski | 2,264 | 41.31% | |
Total votes | 5,480 | 100.00% | ||
Democratic hold |
Party | Candidate | Votes | % | |
---|---|---|---|---|
Republican Party Primary Results | ||||
Republican | George A. Nardone (incumbent) | 423 | 100.00% | |
Total votes | 423 | 100.00% | ||
Democratic Party Primary Results | ||||
Democratic | Scott J. Guthrie | 972 | 100.00% | |
Total votes | 972 | 100.00% |
Party | Candidate | Votes | % | |
---|---|---|---|---|
Republican | George A. Nardone (incumbent) | 3,539 | 58.51% | |
Democratic | Scott J. Guthrie | 2,510 | 41.49% | |
Total votes | 6,049 | 100.00% | ||
Republican hold |
Party | Candidate | Votes | % | |
---|---|---|---|---|
Republican Party Primary Results | ||||
Republican | Sherry L. Roberts (incumbent) | 450 | 100.00% | |
Total votes | 450 | 100.00% |
Party | Candidate | Votes | % | |
---|---|---|---|---|
Republican | Sherry L. Roberts (incumbent) | 4,489 | 100.00% | |
Total votes | 4,489 | 100.00% | ||
Republican hold |
Party | Candidate | Votes | % | |
---|---|---|---|---|
Democratic Party Primary Results | ||||
Democratic | Justine A. Caldwell (incumbent) | 1,532 | 100.00% | |
Total votes | 1,532 | 100.00% | ||
Republican Party Primary Results | ||||
Republican | Amanda M. Blau | 424 | 100.00% | |
Total votes | 424 | 100.00% |
Party | Candidate | Votes | % | |
---|---|---|---|---|
Democratic | Justine A. Caldwell (incumbent) | 3,665 | 54.60% | |
Republican | Amanda M. Blau | 3,048 | 45.40% | |
Total votes | 6,713 | 100.00% | ||
Democratic hold |
Party | Candidate | Votes | % | |
---|---|---|---|---|
Democratic Party Primary Results | ||||
Democratic | Julie A. Casimiro (incumbent) | 1,130 | 64.79% | |
Democratic | Melissa K. Devine | 614 | 35.21% | |
Total votes | 1,744 | 100.00% | ||
Republican Party Primary Results | ||||
Republican | Lisa Marie Leavitt | 403 | 100.00% | |
Total votes | 403 | 100.00% |
Party | Candidate | Votes | % | |
---|---|---|---|---|
Democratic | Julie A. Casimiro (incumbent) | 3,989 | 59.00% | |
Republican | Lisa Marie Leavitt | 2,772 | 41.00% | |
Total votes | 6,761 | 100.00% | ||
Democratic hold |
Party | Candidate | Votes | % | |
---|---|---|---|---|
Democratic Party Primary Results | ||||
Democratic | Robert E. Craven (incumbent) | 1,314 | 58.95% | |
Democratic | Danielle L. Walsh | 915 | 41.05% | |
Total votes | 2,229 | 100.00% | ||
Republican Party Primary Results | ||||
Republican | Ryan J. Hansen | 342 | 100.00% | |
Total votes | 342 | 100.00% |
Party | Candidate | Votes | % | |
---|---|---|---|---|
Democratic | Robert E. Craven (incumbent) | 4,532 | 64.10% | |
Republican | Ryan J. Hansen | 2,538 | 35.90% | |
Total votes | 7,070 | 100.00% | ||
Democratic hold |
Party | Candidate | Votes | % | |
---|---|---|---|---|
Democratic Party Primary Results | ||||
Democratic | Carol Hagan McEntee (incumbent) | 1,880 | 100.00% | |
Total votes | 1,880 | 100.00% | ||
Republican Party Primary Results | ||||
Republican | Jessica A. Drew Day | 312 | 100.00% | |
Total votes | 312 | 100.00% |
Party | Candidate | Votes | % | |
---|---|---|---|---|
Democratic | Carol Hagan McEntee (incumbent) | 4,258 | 61.18% | |
Republican | Jessica A. Drew Day | 2,702 | 38.82% | |
Total votes | 6,960 | 100.00% | ||
Democratic hold |
Party | Candidate | Votes | % | |
---|---|---|---|---|
Democratic Party Primary Results | ||||
Democratic | Teresa A. Tanzi (incumbent) | 1,600 | 100.00% | |
Total votes | 1,600 | 100.00% | ||
Republican Party Primary Results | ||||
Republican | Catherine E. Canavan | 217 | 100.00% | |
Total votes | 217 | 100.00% |
Party | Candidate | Votes | % | |
---|---|---|---|---|
Democratic | Teresa A. Tanzi (incumbent) | 3,925 | 62.96% | |
Republican | Catherine E. Canavan | 2,309 | 37.04% | |
Total votes | 6,234 | 100.00% | ||
Democratic hold |
Party | Candidate | Votes | % | |
---|---|---|---|---|
Democratic Party Primary Results | ||||
Democratic | Kathleen A. Fogarty (incumbent) | 1,136 | 100.00% | |
Total votes | 1,136 | 100.00% | ||
Republican Party Primary Results | ||||
Republican | William R. Paniccia, III | 172 | 100.00% | |
Total votes | 172 | 100.00% |
Party | Candidate | Votes | % | |
---|---|---|---|---|
Democratic | Kathleen A. Fogarty (incumbent) | 2,879 | 64.36% | |
Republican | William R. Paniccia, III | 1,594 | 35.64% | |
Total votes | 4,473 | 100.00% | ||
Democratic hold |
Party | Candidate | Votes | % | |
---|---|---|---|---|
Republican Party Primary Results | ||||
Republican | John F. Pacheco, III | 373 | 100.00% | |
Total votes | 373 | 100.00% | ||
Democratic Party Primary Results | ||||
Democratic | Tina L. Spears | 1,751 | 100.00% | |
Total votes | 1,751 | 100.00% |
Party | Candidate | Votes | % | |
---|---|---|---|---|
Democratic | Tina L. Spears | 4,730 | 61.61% | |
Republican | John F. Pacheco, III | 2,947 | 38.39% | |
Total votes | 7,677 | 100.00% | ||
Democratic gain from Republican |
Party | Candidate | Votes | % | |
---|---|---|---|---|
Democratic Party Primary Results | ||||
Democratic | Samuel Angelo Azzinaro (incumbent) | 1,190 | 100.00% | |
Total votes | 1,190 | 100.00% |
Party | Candidate | Votes | % | |
---|---|---|---|---|
Democratic | Samuel Angelo Azzinaro (incumbent) | 4,965 | 100.00% | |
Total votes | 4,965 | 100.00% | ||
Democratic hold |
Party | Candidate | Votes | % | |
---|---|---|---|---|
Democratic Party Primary Results | ||||
Democratic | Brian Patrick Kennedy (incumbent) | 796 | 100.00% | |
Total votes | 796 | 100.00% | ||
Republican Party Primary Results | ||||
Republican | Donald J. Kohlman, II | 369 | 100.00% | |
Total votes | 369 | 100.00% |
Party | Candidate | Votes | % | |
---|---|---|---|---|
Democratic | Brian Patrick Kennedy (incumbent) | 3,174 | 57.97% | |
Republican | Donald J. Kohlman, II | 2,301 | 42.03% | |
Total votes | 5,475 | 100.00% | ||
Democratic hold |
Party | Candidate | Votes | % | |
---|---|---|---|---|
Republican Party Primary Results | ||||
Republican | Justin K. Price (incumbent) | 533 | 100.00% | |
Total votes | 533 | 100.00% | ||
Democratic Party Primary Results | ||||
Democratic | Megan L. Cotter | 1,110 | 100.00% | |
Total votes | 1,110 | 100.00% |
Party | Candidate | Votes | % | |
---|---|---|---|---|
Democratic | Megan L. Cotter | 3,031 | 45.24% | |
Republican | Justin K. Price (incumbent) | 2,999 | 44.76% | |
Independent | Sean Patrick Comella | 670 | 10.00% | |
Total votes | 6,700 | 100.00% | ||
Democratic gain from Republican |
Party | Candidate | Votes | % | |
---|---|---|---|---|
Republican Party Primary Results | ||||
Republican | Michael W. Chippendale (incumbent) | 553 | 100.00% | |
Total votes | 553 | 100.00% | ||
Democratic Party Primary Results | ||||
Democratic | Linda A. Nichols | 909 | 100.00% | |
Total votes | 909 | 100.00% |
Party | Candidate | Votes | % | |
---|---|---|---|---|
Republican | Michael W. Chippendale (incumbent) | 4,368 | 67.44% | |
Democratic | Linda A. Nichols | 2,109 | 32.56% | |
Total votes | 6,477 | 100.00% | ||
Republican hold |
Party | Candidate | Votes | % | |
---|---|---|---|---|
Republican Party Primary Results | ||||
Republican | Robert J. Quattrocchi (incumbent) | 500 | 100.00% | |
Total votes | 500 | 100.00% | ||
Democratic Party Primary Results | ||||
Democratic | James S. Safford | 904 | 100.00% | |
Total votes | 904 | 100.00% |
Party | Candidate | Votes | % | |
---|---|---|---|---|
Republican | Robert J. Quattrocchi (incumbent) | 4,723 | 68.40% | |
Democratic | James S. Safford | 2,182 | 31.60% | |
Total votes | 6,905 | 100.00% | ||
Republican hold |
Party | Candidate | Votes | % | |
---|---|---|---|---|
Democratic Party Primary Results | ||||
Democratic | Edward T. Cardillo, Jr. (incumbent) | 642 | 41.37% | |
Democratic | Kelsey Kristine Coletta | 559 | 36.02% | |
Democratic | Dennis Cardillo, Jr. | 351 | 22.62% | |
Total votes | 1,552 | 100.00% | ||
Republican Party Primary Results | ||||
Republican | Harold K. Borders, Jr. | 279 | 100.00% | |
Total votes | 279 | 100.00% |
Party | Candidate | Votes | % | |
---|---|---|---|---|
Democratic | Edward T. Cardillo, Jr. (incumbent) | 2,650 | 52.45% | |
Republican | Harold K. Borders, Jr. | 2,402 | 47.55% | |
Total votes | 5,052 | 100.00% | ||
Democratic hold |
Party | Candidate | Votes | % | |
---|---|---|---|---|
Democratic Party Primary Results | ||||
Democratic | Deborah Ann Fellela (incumbent) | 1,365 | 100.00% | |
Total votes | 1,365 | 100.00% | ||
Republican Party Primary Results | ||||
Republican | Nicola Antonio Grasso | 257 | 100.00% | |
Total votes | 257 | 100.00% |
Party | Candidate | Votes | % | |
---|---|---|---|---|
Democratic | Deborah Ann Fellela (incumbent) | 2,621 | 51.78% | |
Republican | Nicola Antonio Grasso | 2,441 | 48.22% | |
Total votes | 5,062 | 100.00% | ||
Democratic hold |
Party | Candidate | Votes | % | |
---|---|---|---|---|
Democratic Party Primary Results | ||||
Democratic | Gregory J. Costantino (incumbent) | 1,481 | 100.00% | |
Total votes | 1,481 | 100.00% | ||
Republican Party Primary Results | ||||
Republican | Peter Anthony Trementozzi | 398 | 100.00% | |
Total votes | 398 | 100.00% |
Party | Candidate | Votes | % | |
---|---|---|---|---|
Democratic | Gregory J. Costantino (incumbent) | 3,729 | 54.21% | |
Republican | Peter Anthony Trementozzi | 3,150 | 45.79% | |
Total votes | 6,879 | 100.00% | ||
Democratic hold |
Party | Candidate | Votes | % | |
---|---|---|---|---|
Democratic Party Primary Results | ||||
Democratic | Mia A. Ackerman (incumbent) | 1,208 | 100.00% | |
Total votes | 1,208 | 100.00% | ||
Republican Party Primary Results | ||||
Republican | Thomas Alexander Rando | 256 | 100.00% | |
Total votes | 256 | 100.00% |
Party | Candidate | Votes | % | |
---|---|---|---|---|
Democratic | Mia A. Ackerman (incumbent) | 3,062 | 55.49% | |
Republican | Thomas Alexander Rando | 2,456 | 44.51% | |
Total votes | 5,518 | 100.00% | ||
Democratic hold |
Party | Candidate | Votes | % | |
---|---|---|---|---|
Democratic Party Primary Results | ||||
Democratic | Mary Ann Shallcross Smith (incumbent) | 1,180 | 100.00% | |
Total votes | 1,180 | 100.00% |
Party | Candidate | Votes | % | |
---|---|---|---|---|
Democratic | Mary Ann Shallcross Smith (incumbent) | 3,449 | 61.37% | |
Independent | Angelo Kapsimalis | 2,171 | 38.63% | |
Total votes | 5,620 | 100.00% | ||
Democratic hold |
Party | Candidate | Votes | % | |
---|---|---|---|---|
Republican Party Primary Results | ||||
Republican | David J. Place (incumbent) | 445 | 100.00% | |
Total votes | 445 | 100.00% | ||
Democratic Party Primary Results | ||||
Democratic | Paul A. Roselli | 662 | 100.00% | |
Total votes | 662 | 100.00% |
Party | Candidate | Votes | % | |
---|---|---|---|---|
Republican | David J. Place (incumbent) | 3,433 | 67.16% | |
Democratic | Paul A. Roselli | 1,679 | 32.84% | |
Total votes | 5,112 | 100.00% | ||
Republican hold |
Party | Candidate | Votes | % | |
---|---|---|---|---|
Republican Party Primary Results | ||||
Republican | Brian C. Newberry (incumbent) | 524 | 100.00% | |
Total votes | 524 | 100.00% | ||
Democratic Party Primary Results | ||||
Democratic | Paul M. Jones | 835 | 100.00% | |
Total votes | 835 | 100.00% |
Party | Candidate | Votes | % | |
---|---|---|---|---|
Republican | Brian C. Newberry (incumbent) | 3,654 | 63.87% | |
Democratic | Paul M. Jones | 2,067 | 36.13% | |
Total votes | 5,721 | 100.00% | ||
Republican hold |
Party | Candidate | Votes | % | |
---|---|---|---|---|
Democratic Party Primary Results | ||||
Democratic | Glenn F. Dusablon | 440 | 57.82% | |
Democratic | Alexander G. Kithes | 321 | 42.18% | |
Total votes | 761 | 100.00% |
Party | Candidate | Votes | % | |
---|---|---|---|---|
Independent | Jon D. Brien [a] | 1,270 | 50.96% | |
Democratic | Glenn F. Dusablon | 1,222 | 49.04% | |
Total votes | 2,492 | 100.00% | ||
Independent gain from Democratic |
Party | Candidate | Votes | % | |
---|---|---|---|---|
Democratic Party Primary Results | ||||
Democratic | Stephen M. Casey (incumbent) | 547 | 100.00% | |
Total votes | 547 | 100.00% |
Party | Candidate | Votes | % | |
---|---|---|---|---|
Democratic | Stephen M. Casey (incumbent) | 2,188 | 100.00% | |
Total votes | 2,188 | 100.00% | ||
Democratic hold |
Party | Candidate | Votes | % | |
---|---|---|---|---|
Democratic Party Primary Results | ||||
Democratic | Robert D. Phillips (incumbent) | 517 | 63.13% | |
Democratic | Marlene B. Guay | 302 | 36.87% | |
Total votes | 819 | 100.00% |
Party | Candidate | Votes | % | |
---|---|---|---|---|
Democratic | Robert D. Phillips (incumbent) | 2,349 | 100.00% | |
Total votes | 2,349 | 100.00% | ||
Democratic hold |
Party | Candidate | Votes | % | |
---|---|---|---|---|
Democratic Party Primary Results | ||||
Democratic | Alex Daniel Marszalkowski (incumbent) | 1,582 | 100.00% | |
Total votes | 1,582 | 100.00% | ||
Republican Party Primary Results | ||||
Republican | Christopher J. Hogan | 318 | 100.00% | |
Total votes | 318 | 100.00% |
Party | Candidate | Votes | % | |
---|---|---|---|---|
Democratic | Alex Daniel Marszalkowski (incumbent) | 3,609 | 56.34% | |
Republican | Christopher J. Hogan | 2,797 | 43.66% | |
Total votes | 6,406 | 100.00% | ||
Democratic hold |
Party | Candidate | Votes | % | |
---|---|---|---|---|
Democratic Party Primary Results | ||||
Democratic | Bernard A. Hawkins (incumbent) | 1,029 | 100.00% | |
Total votes | 1,029 | 100.00% | ||
Republican Party Primary Results | ||||
Republican | Brian J. Rea | 341 | 100.00% | |
Total votes | 341 | 100.00% |
Party | Candidate | Votes | % | |
---|---|---|---|---|
Republican | Brian J. Rea | 2,503 | 50.59% | |
Democratic | Bernard A. Hawkins (incumbent) | 2,445 | 49.41% | |
Total votes | 4,948 | 100.00% | ||
Republican gain from Democratic |
Party | Candidate | Votes | % | |
---|---|---|---|---|
Democratic Party Primary Results | ||||
Democratic | William W. O'Brien (incumbent) | 1,476 | 100.00% | |
Total votes | 1,476 | 100.00% |
Party | Candidate | Votes | % | |
---|---|---|---|---|
Democratic | William W. O'Brien (incumbent) | 3,464 | 100.00% | |
Total votes | 3,464 | 100.00% | ||
Democratic hold |
Party | Candidate | Votes | % | |
---|---|---|---|---|
Democratic Party Primary Results | ||||
Democratic | Arthur J. Corvese (incumbent) | 1,711 | 68.85% | |
Democratic | Clara A. Hardy | 774 | 31.15% | |
Total votes | 2,485 | 100.00% |
Party | Candidate | Votes | % | |
---|---|---|---|---|
Democratic | Arthur J. Corvese (incumbent) | 3,866 | 100.00% | |
Total votes | 3,866 | 100.00% | ||
Democratic hold |
Party | Candidate | Votes | % | |
---|---|---|---|---|
Democratic Party Primary Results | ||||
Democratic | Joshua J.D. Giraldo (incumbent) | 495 | 100.00% | |
Total votes | 495 | 100.00% |
Party | Candidate | Votes | % | |
---|---|---|---|---|
Democratic | Joshua J.D. Giraldo (incumbent) | 934 | 100.00% | |
Total votes | 934 | 100.00% | ||
Democratic hold |
Party | Candidate | Votes | % | |
---|---|---|---|---|
Democratic Party Primary Results | ||||
Democratic | Brandon T. Voas | 675 | 51.29% | |
Democratic | James N. McLaughlin (incumbent) | 641 | 48.71% | |
Total votes | 1,316 | 100.00% | ||
Republican Party Primary Results | ||||
Republican | Dennis Huard | 158 | 100.00% | |
Total votes | 158 | 100.00% |
Party | Candidate | Votes | % | |
---|---|---|---|---|
Democratic | Brandon T. Voas | 1,752 | 64.82% | |
Republican | Dennis Huard | 951 | 35.18% | |
Total votes | 2,703 | 100.00% | ||
Democratic hold |
Party | Candidate | Votes | % | |
---|---|---|---|---|
Democratic Party Primary Results | ||||
Democratic | Cherie L. Cruz | 368 | 33.15% | |
Democratic | Maribel Echeverry McLaughlin | 325 | 29.28% | |
Democratic | George P. Hovarth | 323 | 29.10% | |
Democratic | Matthew P. Carvalho | 94 | 8.47% | |
Total votes | 1,110 | 100.00% |
Party | Candidate | Votes | % | |
---|---|---|---|---|
Democratic | Cherie L. Cruz | 1,647 | 100.00% | |
Total votes | 1,647 | 100.00% | ||
Democratic hold |
Party | Candidate | Votes | % | |
---|---|---|---|---|
Democratic Party Primary Results | ||||
Democratic | Jennifer A. Stewart | 718 | 52.52% | |
Democratic | Jean Philippe Barros (incumbent) | 649 | 47.48% | |
Total votes | 1,367 | 100.00% |
Party | Candidate | Votes | % | |
---|---|---|---|---|
Democratic | Jennifer A. Stewart | 2,188 | 100.00% | |
Total votes | 2,188 | 100.00% | ||
Democratic hold |
Party | Candidate | Votes | % | |
---|---|---|---|---|
Democratic Party Primary Results | ||||
Democratic | Karen Alzate (incumbent) | 531 | 100.00% | |
Total votes | 531 | 100.00% |
Party | Candidate | Votes | % | |
---|---|---|---|---|
Democratic | Karen Alzate (incumbent) | 1,392 | 100.00% | |
Total votes | 1,392 | 100.00% | ||
Democratic hold |
Party | Candidate | Votes | % | |
---|---|---|---|---|
Democratic Party Primary Results | ||||
Democratic | Leonela Felix (incumbent) | 1,049 | 100.00% | |
Total votes | 1,049 | 100.00% | ||
Republican Party Primary Results | ||||
Republican | Richard R. Karsulavitch | 155 | 100.00% | |
Total votes | 155 | 100.00% |
Party | Candidate | Votes | % | |
---|---|---|---|---|
Democratic | Leonela Felix (incumbent) | 2,202 | 61.59% | |
Republican | Richard R. Karsulavitch | 1,373 | 38.41% | |
Total votes | 3,575 | 100.00% | ||
Democratic hold |
Party | Candidate | Votes | % | |
---|---|---|---|---|
Democratic Party Primary Results | ||||
Democratic | Mary Duffy Messier (incumbent) | 747 | 63.74% | |
Democratic | Kinverly P. Dicupe Paulino | 425 | 36.26% | |
Total votes | 1,172 | 100.00% | ||
Republican Party Primary Results | ||||
Republican | Wayne J. Charbonneau | 113 | 100.00% | |
Total votes | 113 | 100.00% |
Party | Candidate | Votes | % | |
---|---|---|---|---|
Democratic | Mary Duffy Messier (incumbent) | 1,787 | 61.03% | |
Republican | Wayne J. Charbonneau | 892 | 30.46% | |
Independent | David A. Coughlin, Jr. | 249 | 8.50% | |
Total votes | 2,928 | 100.00% | ||
Democratic hold |
Party | Candidate | Votes | % | |
---|---|---|---|---|
Democratic Party Primary Results | ||||
Democratic | Katherine S. Kazarian (incumbent) | 1,955 | 100.00% | |
Total votes | 1,955 | 100.00% | ||
Republican Party Primary Results | ||||
Republican | Anthony Sionni | 241 | 100.00% | |
Total votes | 241 | 100.00% |
Party | Candidate | Votes | % | |
---|---|---|---|---|
Democratic | Katherine S. Kazarian (incumbent) | 3,640 | 70.65% | |
Republican | Anthony Sionni | 1,512 | 29.35% | |
Total votes | 5,152 | 100.00% | ||
Democratic hold |
Party | Candidate | Votes | % | |
---|---|---|---|---|
Democratic Party Primary Results | ||||
Democratic | Brianna E. Henries (incumbent) | 695 | 55.25% | |
Democratic | Ashley Pereira | 563 | 44.75% | |
Total votes | 1,258 | 100.00% |
Party | Candidate | Votes | % | |
---|---|---|---|---|
Democratic | Brianna E. Henries (incumbent) | 2,107 | 66.57% | |
Independent | Antonio U. de Simas | 1,058 | 33.43% | |
Total votes | 3,165 | 100.00% | ||
Democratic hold |
Party | Candidate | Votes | % | |
---|---|---|---|---|
Democratic Party Primary Results | ||||
Democratic | Matthew S. Dawson | 1,385 | 63.59% | |
Democratic | San Shoppell | 793 | 36.41% | |
Total votes | 2,178 | 100.00% | ||
Republican Party Primary Results | ||||
Republican | John R. Peters | 329 | 100.00% | |
Total votes | 329 | 100.00% |
Party | Candidate | Votes | % | |
---|---|---|---|---|
Democratic | Matthew S. Dawson | 3,613 | 66.66% | |
Republican | John R. Peters | 1,807 | 33.34% | |
Total votes | 5,420 | 100.00% | ||
Democratic hold |
Party | Candidate | Votes | % | |
---|---|---|---|---|
Democratic Party Primary Results | ||||
Democratic | Jennifer Smith Boylan | 1,716 | 100.00% | |
Total votes | 1,716 | 100.00% |
Party | Candidate | Votes | % | |
---|---|---|---|---|
Democratic | Jennifer Smith Boylan | 3,584 | 57.57% | |
Independent | Samuel R. Read | 2,641 | 42.43% | |
Total votes | 6,225 | 100.00% | ||
Democratic hold |
Party | Candidate | Votes | % | |
---|---|---|---|---|
Democratic Party Primary Results | ||||
Democratic | Jason P. Knight (incumbent) | 1,573 | 100.00% | |
Total votes | 1,573 | 100.00% | ||
Republican Party Primary Results | ||||
Republican | Scott W. Fuller | 304 | 100.00% | |
Total votes | 304 | 100.00% |
Party | Candidate | Votes | % | |
---|---|---|---|---|
Democratic | Jason P. Knight (incumbent) | 3,603 | 60.56% | |
Republican | Scott W. Fuller | 2,346 | 39.44% | |
Total votes | 5,949 | 100.00% | ||
Democratic hold |
Party | Candidate | Votes | % | |
---|---|---|---|---|
Democratic Party Primary Results | ||||
Democratic | June S. Speakman (incumbent) | 1,357 | 100.00% | |
Total votes | 1,357 | 100.00% | ||
Republican Party Primary Results | ||||
Republican | Rae-Ann Lawrence | 285 | 100.00% | |
Total votes | 285 | 100.00% |
Party | Candidate | Votes | % | |
---|---|---|---|---|
Democratic | June S. Speakman (incumbent) | 3,333 | 56.98% | |
Republican | Rae-Ann Lawrence | 2,516 | 43.02% | |
Total votes | 5,849 | 100.00% | ||
Democratic hold |
Party | Candidate | Votes | % | |
---|---|---|---|---|
Democratic Party Primary Results | ||||
Democratic | Susan Ann Donovan (incumbent) | 887 | 100.00% | |
Total votes | 887 | 100.00% | ||
Republican Party Primary Results | ||||
Republican | Robert Emmett O'Neill | 203 | 100.00% | |
Total votes | 203 | 100.00% |
Party | Candidate | Votes | % | |
---|---|---|---|---|
Democratic | Susan Ann Donovan (incumbent) | 2,684 | 60.40% | |
Republican | Robert Emmett O'Neill | 1,760 | 39.60% | |
Total votes | 4,444 | 100.00% | ||
Democratic hold |
Party | Candidate | Votes | % | |
---|---|---|---|---|
Democratic Party Primary Results | ||||
Democratic | John G. Edwards, IV (incumbent) | 832 | 100.00% | |
Total votes | 832 | 100.00% | ||
Republican Party Primary Results | ||||
Republican | Christopher M. Borden | 388 | 100.00% | |
Total votes | 388 | 100.00% |
Party | Candidate | Votes | % | |
---|---|---|---|---|
Democratic | John G. Edwards, IV (incumbent) | 2,901 | 54.72% | |
Republican | Christopher M. Borden | 2,401 | 45.28% | |
Total votes | 5,302 | 100.00% | ||
Democratic hold |
Party | Candidate | Votes | % | |
---|---|---|---|---|
Democratic Party Primary Results | ||||
Democratic | Michelle Elise McGaw (incumbent) | 1,453 | 100.00% | |
Total votes | 1,453 | 100.00% |
Party | Candidate | Votes | % | |
---|---|---|---|---|
Democratic | Michelle Elise McGaw (incumbent) | 3,787 | 63.84% | |
Independent | Kobe J. Taylor | 2,145 | 36.16% | |
Total votes | 5,932 | 100.00% | ||
Democratic hold |
Party | Candidate | Votes | % | |
---|---|---|---|---|
Democratic Party Primary Results | ||||
Democratic | Terri-Denise Cortvriend (incumbent) | 1,396 | 100.00% | |
Total votes | 1,396 | 100.00% |
Party | Candidate | Votes | % | |
---|---|---|---|---|
Democratic | Terri-Denise Cortvriend (incumbent) | 4,524 | 100.00% | |
Total votes | 4,524 | 100.00% | ||
Democratic hold |
Party | Candidate | Votes | % | |
---|---|---|---|---|
Democratic Party Primary Results | ||||
Democratic | Marvin L. Abney (incumbent) | 816 | 100.00% | |
Total votes | 816 | 100.00% |
Party | Candidate | Votes | % | |
---|---|---|---|---|
Democratic | Marvin L. Abney (incumbent) | 2,983 | 100.00% | |
Total votes | 2,983 | 100.00% | ||
Democratic hold |
Party | Candidate | Votes | % | |
---|---|---|---|---|
Democratic Party Primary Results | ||||
Democratic | Alex S. Finkelman | 1,414 | 100.00% | |
Total votes | 1,414 | 100.00% |
Party | Candidate | Votes | % | |
---|---|---|---|---|
Democratic | Alex S. Finkelman | 4,087 | 100.00% | |
Total votes | 4,087 | 100.00% | ||
Democratic hold |
Party | Candidate | Votes | % | |
---|---|---|---|---|
Democratic Party Primary Results | ||||
Democratic | Lauren H. Carson (incumbent) | 1,138 | 100.00% | |
Total votes | 1,138 | 100.00% |
Party | Candidate | Votes | % | |
---|---|---|---|---|
Democratic | Lauren H. Carson (incumbent) | 3,485 | 100.00% | |
Total votes | 3,485 | 100.00% | ||
Democratic hold |
Arthur J. “Doc” Corvese is an American politician and a Democratic member of the Rhode Island House of Representatives representing District 55 since January 2003. Corvese served consecutively from January 1999 until January 2003 in the District 71 seat.
Roger A. Picard is an American politician and a Democratic member of the Rhode Island Senate representing District 20 since January 2009. Picard served consecutively in the Rhode Island General Assembly from January 1993 until January 2009 in the Rhode Island House of Representatives District 66 and 51 seats.
The 2018 Nevada Senate election took place as part of the biennial United States elections. Nevada voters elected state senators in 11 of the state senate's 21 districts. State senators serve four-year terms in the Nevada State Senate.
The 2018 United States state legislative elections were held on November 6, 2018, for 87 state legislative chambers in 46 states. Across the fifty states, approximately 56 percent of all upper house seats and 92 percent of all lower house seats were up for election. Additionally, six territorial chambers in four territories and the District of Columbia were up as well.
A general election was held in the U.S. state of North Carolina on November 3, 2020.
The 2022 Wyoming Senate election took place on Tuesday, November 8, 2022, with the primary election held on Tuesday, August 16, 2022. Wyoming voters selected state senators in the 16 odd-numbered districts of the Senate to serve four-year terms.
The 2022 United States state legislative elections were held on November 8, 2022, for 88 state legislative chambers in 46 states. Across the fifty states, approximately 56 percent of all upper house seats and 92 percent of all lower house seats were up for election. Additionally, six territorial chambers were up in four territories and the District of Columbia. These midterm elections coincided with other state and local elections, including gubernatorial elections in multiple states.
The 2022 Idaho House of Representatives elections took place on November 8, 2022. Primary elections were held on May 17, 2022. Idaho voters elected state representatives in all 70 seats of the House, electing two state representatives in each of the 35 Idaho state legislative districts. State representatives serve two-year terms in the Idaho House of Representatives.
All 62 members of the Wyoming House of Representatives were elected on November 8, 2022, as part of the 2022 Wyoming elections. Primary elections were held on August 16. Republicans expanded their supermajority, gaining six seats.
The 2022 Idaho State Senate elections took place on November 8, 2022. Primary elections were held on May 17, 2022. Idaho voters elected state senators in all 35 seats of the Senate, electing one state senator and two state representatives in each of the 35 Idaho state legislative districts. State senators serve two-year terms in the Idaho Senate.
The 2022 Rhode Island State Senate elections took place on November 8, 2022. Primary elections were held on September 13, 2022. Rhode Island voters elected state senators in all 38 seats of the Senate. State senators serve two-year terms in the Rhode Island Senate.
The 2022 Massachusetts State Senate election was held on Tuesday, November 8, 2022, with the primary election having been held on Tuesday, September 6, 2022. Massachusetts voters selected all 40 members of the State Senate to serve two-year terms in the 2023–2024 Massachusetts legislature. The election coincided with United States national elections and Massachusetts state elections, including U.S. House, Governor, and Massachusetts House.
The 2022 Massachusetts House of Representatives election was held on Tuesday, November 8, 2022, with the primary election having been held on Tuesday, September 6, 2022. Massachusetts voters selected all 160 members of the State House to serve two-year terms in the 2023–2024 Massachusetts legislature. The election coincided with United States national elections and Massachusetts state elections, including U.S. House, Governor, and Massachusetts Senate.
Elections in the U.S. state of California took place on November 5, 2024, with the statewide direct primary election being held on March 5, 2024.
The 2022 Missouri House of Representatives election took place on Tuesday, November 8, 2022, with the primary election held on Tuesday, August 2, 2022. Missouri voters selected state representatives in all 163 seats of the House of Representatives to serve two-year terms.
The 2022 Missouri Senate election took place on Tuesday, November 8, 2022, with the primary election held on Tuesday, August 2, 2022. Missouri voters selected state senators in the 17 even-numbered districts of the Senate to serve four-year terms.
The 2022 New York state elections took place on November 8, 2022. On this date, the State of New York held elections for the following offices: Governor and Lieutenant Governor, Attorney General, Comptroller, U.S. Senate, U.S. House of Representatives, New York State Senate, New York State Assembly, and various others. Primary elections took place on June 28 and August 23, 2022. This election cycle was highlighted by a redistricting process in which there were many election maps that were ultimately ruled to be unconstitutional Democratic gerrymanders.
The 2024 United States state legislative elections were held on November 5, 2024, for 85 state legislative chambers in 44 states. Across the fifty states, approximately 65 percent of all upper house seats and 85 percent of all lower house seats were up for election. Nine legislative chambers in the five permanently inhabited U.S. territories and the federal district of Washington, D.C., also held elections. The elections take place concurrently with several other federal, state, and local elections, including the presidential election, U.S. Senate elections, U.S. House elections, and gubernatorial elections.
The 2024 Rhode Island House of Representatives elections took place on Tuesday, November 5, 2024, with the primary election held on Tuesday, September 10, 2024. Rhode Island voters elected state representatives in all 75 seats of the House to serve two-year terms.
The 2024 Rhode Island State Senate elections took place on Tuesday, November 5, 2024. The primary election was held on Tuesday, September 10, 2024. Rhode Island voters elected state senators in all 38 seats of the Senate to serve two-year terms.