![]() | |||||||||||||||||
| |||||||||||||||||
Turnout | 54.58% ![]() | ||||||||||||||||
---|---|---|---|---|---|---|---|---|---|---|---|---|---|---|---|---|---|
| |||||||||||||||||
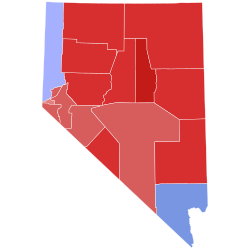
Lombardo: 40–50% 50–60% 60–70% 70–80% 80–90% >90% Sisolak: 40–50% 50–60% 60–70% 70–80% 80–90% >90% Tie: 40–50% 50% No votes | |||||||||||||||||
|
Elections in Nevada |
---|
![]() |
![]() |
The 2022 Nevada gubernatorial election took place on November 8, 2022, to elect the governor of Nevada. Incumbent Democratic governor Steve Sisolak ran for re-election to a second term, but lost in the general election to Republican Joe Lombardo, the Clark County Sheriff. This was the first time since 1966 an incumbent Democratic governor lost reelection in Nevada.
Sisolak was the first Democrat to seek re-election to Nevada's governorship since Bob Miller in 1994, and was subsequently the only incumbent governor in the United States to lose re-election in 2022. Decision Desk HQ called the race for Lombardo on November 11. [1]
Significantly, Lombardo's win marked the first time in the state's history that anyone had won the governorship without winning either Clark or Washoe counties, home to a combined 89% of the state's population. This was largely due to Lombardo's stronger performance in Clark, his home county; Sisolak's previous opponent, Adam Laxalt, lost the county by 13.3% there, while Lombardo only lost by 5.7%, a significant gain.
Political analysts have attributed Sisolak's defeat to his handling of the COVID-19 pandemic; [2] lockdowns during the pandemic proved unpopular in Nevada, which has a tourism-driven economy and a reputation for libertarian political leanings. [3]
Amid a slate of failed gubernatorial pickup attempts, this was the only governorship Republicans flipped in the 2022 elections, as well as the only state governorship to flip to the party that did not carry that state in the 2020 presidential election. This was also the first time since Pat Quinn's defeat in the 2014 Illinois gubernatorial election that an incumbent Democratic governor lost re-election in any state.
Organizations
Newspapers
Labor unions
Party | Candidate | Votes | % | |
---|---|---|---|---|
Democratic | Steve Sisolak (incumbent) | 157,283 | 89.53% | |
Democratic | Tom Collins | 12,051 | 6.86% | |
None of These Candidates | 6,340 | 3.61% | ||
Total votes | 175,674 | 100.0% |
2022 Nevada gubernatorial Republican primary election debates [i] | |||||||||||||||
---|---|---|---|---|---|---|---|---|---|---|---|---|---|---|---|
No. | Date | Organizer | Location | Key: P Participant A Absent N Non-invitee I Invitee W Withdrawn | Source | ||||||||||
Michele Fiore | Joey Gilbert | Tom Heck | Dean Heller | John Lee | Joe Lombardo | Guy Nohra | Fred Simon | Barak Zilberberg | |||||||
1 | January 6, 2022 | Nevada Commonwealth & Sierra Republican Club | Atlantis Casino Resort Spa, Reno | P | P | P | P | P | A | P | P | P | [31] | ||
2 | February 8, 2022 | Clark County Republican Club | Dragon Ridge Country Club, Henderson | P | P | N | P | P | A | P | P | N | [32] | ||
3 | April 20, 2022 | Republican Women of Las Vegas | Las Vegas | W | P | N | P | P | A | P | P | N | [33] | ||
4 | May 26, 2022 | 8 News Now | Las Vegas | W | P | N | P | P | P | P | N | N | [34] |
Executive Branch officials
Organizations
Organizations
Executive Branch officials
State officials
Newspapers
Graphical summary
![]() | Graphs are unavailable due to technical issues. Updates on reimplementing the Graph extension, which will be known as the Chart extension, can be found on Phabricator and on MediaWiki.org. |
Source of poll aggregation | Dates administered | Dates updated | Joey Gilbert | Dean Heller | John Lee | Joe Lombardo | Guy Nohra | Fred Simon | Other [a] | Margin |
---|---|---|---|---|---|---|---|---|---|---|
Real Clear Politics [40] | April 25 – June 7, 2022 | June 10, 2022 | 18.3% | 14.7% | 11.5% | 33.0% | 7.5% | 3.5% | 11.5% | Lombardo +14.7 |
Poll source | Date(s) administered | Sample size [b] | Margin of error | Michele Fiore | Joey Gilbert | Dean Heller | John Lee | Joe Lombardo | Guy Nohra | Fred Simon | None of These Candidates | Other | Undecided | ||
---|---|---|---|---|---|---|---|---|---|---|---|---|---|---|---|
OH Predictive Insights [41] | June 6–7, 2022 | 525 (LV) | ± 4.4% | – | 21% | 10% | 10% | 34% | 6% | 4% | 3% | 4% [c] | 7% | ||
University of Nevada Reno [42] | May 17–27, 2022 | 368 (LV) | ± 5.9% | – | 12% | 14% | 9% | 47% | 2% | 3% | – | 13% [d] | – | ||
OH Predictive Insights [43] | May 10–12, 2022 | 500 (LV) | ± 4.4% | – | 15% | 11% | 9% | 35% | 3% | 3% | 4% | 5% [e] | 14% | ||
Emerson College [44] | April 30 – May 2, 2022 | 1,000 (LV) | ± 3.0% | – | 14% | 11% | 10% | 33% | 4% | 2% | – | 3% [f] | 25% | ||
The Trafalgar Group (R) [45] | April 25–28, 2022 | 1,071 (LV) | ± 3.0% | – | 18% | 18% | 13% | 26% | 9% | 3% | – | 7% | 6% | ||
Fiore withdraws from the race | |||||||||||||||
WPA Intelligence (R) [46] [A] | March 13–15, 2022 | 500 (LV) | ± 4.4% | 5% | 9% | 22% | 13% | 28% | 1% | – | – | 2% | 17% | ||
Public Policy Polling (D) [47] [B] | March 7–8, 2022 | 580 (LV) | ± 4.1% | 8% | 12% | 13% | 13% | 26% | 1% | – | – | – | 27% | ||
OH Predictive Insights [48] | January 19–26, 2022 | 230 (RV) | ± 6.5% | 8% | 7% | 9% | 5% | 28% | 1% | 2% | – | 1% [g] | 36% | ||
The Tarrance Group (R) [49] [C] | November 7–9, 2021 | 500 (LV) | ± 4.5% | 8% | 7% | 19% | 5% | 37% | 0% | 3% | – | 1% [h] | 37% | ||
The Mellman Group (D) [50] | September 15–22, 2021 | 400 (LV) | ± 4.9% | – | 11% | 31% | 3% | 23% | 0% | 1% | 3% | 0% [i] | 27% | ||
The Tarrance Group (R) [49] [C] | July 2021 | – (LV) | – | – | 7% | 27% | 13% | 22% | 1% | – | – | – | 28% |
Party | Candidate | Votes | % | |
---|---|---|---|---|
Republican | Joe Lombardo | 87,761 | 38.40% | |
Republican | Joey Gilbert | 61,738 | 27.01% | |
Republican | Dean Heller | 32,087 | 14.04% | |
Republican | John Lee | 17,846 | 7.81% | |
Republican | Guy Nohra | 8,348 | 3.65% | |
Republican | Fred J. Simon | 6,856 | 3.00% | |
Republican | Thomas Heck | 4,315 | 1.89% | |
None of These Candidates | 4,219 | 1.85% | ||
Republican | Eddie Hamilton | 1,293 | 0.57% | |
Republican | Amber Whitley | 1,238 | 0.54% | |
Republican | William Walls | 833 | 0.36% | |
Republican | Gary Evertsen | 558 | 0.24% | |
Republican | Seven Achilles Evans | 475 | 0.21% | |
Republican | Edward O'Brien | 422 | 0.18% | |
Republican | Barak Zilberberg | 352 | 0.15% | |
Republican | Stanleigh Lusak | 229 | 0.10% | |
Total votes | 228,570 | 100.0% |
Source | Ranking | As of |
---|---|---|
The Cook Political Report [52] | Tossup | March 4, 2022 |
Inside Elections [53] | Tossup | September 23, 2022 |
Sabato's Crystal Ball [54] | Lean R (flip) | November 7, 2022 |
Politico [55] | Tossup | April 1, 2022 |
RCP [56] | Tossup | January 10, 2022 |
Fox News [57] | Tossup | May 12, 2022 |
538 [58] | Lean R (flip) | November 7, 2022 |
Elections Daily [59] | Lean R (flip) | November 7, 2022 |
Executive Branch officials
U.S. senators
Organizations
Labor unions
Governors
Individuals
Newspapers
Organizations
Aggregate polls
Source of poll aggregation | Dates administered | Dates updated | Steve Sisolak (D) | Joe Lombardo (R) | Undecided [j] | Margin |
---|---|---|---|---|---|---|
Real Clear Politics [78] | September 26 – November 6, 2022 | November 6, 2022 | 44.3% | 46.9% | 8.8% | Lombardo +2.6 |
FiveThirtyEight [79] | September 15, 2021 – November 6, 2022 | November 6, 2022 | 44.9% | 46.6% | 8.5% | Lombardo +1.7 |
Average | 44.6% | 46.8% | 8.6% | Lombardo +2.2 |
![]() | Graphs are unavailable due to technical issues. Updates on reimplementing the Graph extension, which will be known as the Chart extension, can be found on Phabricator and on MediaWiki.org. |
Poll source | Date(s) administered | Sample size [b] | Margin of error | Steve Sisolak (D) | Joe Lombardo (R) | None of These Candidates | Other | Undecided |
---|---|---|---|---|---|---|---|---|
The Trafalgar Group (R) [80] | November 5–7, 2022 | 1,089 (LV) | ± 2.9% | 46% | 49% | – | 3% [k] | 2% |
Research Co. [81] | November 4–6, 2022 | 450 (LV) | ± 4.6% | 45% | 47% | – | 3% [l] | 5% |
Data for Progress (D) [82] | November 2–6, 2022 | 1,100 (LV) | ± 3.0% | 46% | 48% | 2% | 5% [m] | – |
InsiderAdvantage (R) [83] [D] | November 4, 2022 | 550 (LV) | ± 4.2% | 44% | 49% | – | 4% [n] | 4% |
KAConsulting (R) [84] [E] | November 2–3, 2022 | 501 (LV) | ± 4.4% | 43% | 45% | – | 2% | 10% |
Cygnal (R) [85] [D] | November 1–2, 2022 | 600 (LV) | – | 42% | 47% | – | – | 5% |
Emerson College [86] | October 26–29, 2022 | 2,000 (LV) | ± 2.1% | 45% | 49% | – | – | 3% |
46% | 50% | – | – | – | ||||
Suffolk University [87] | October 24–28, 2022 | 500 (LV) | ± 4.4% | 43% | 43% | 4% | 5% [o] | 6% |
OH Predictive Insights [88] | October 24–27, 2022 | 600 (LV) | ± 4.0% | 45% | 41% | 1% | 4% [p] | 9% |
Susquehanna Polling and Research (R) [89] [F] | October 24–27, 2022 | 500 (LV) | ± 4.3% | 44% | 45% | 1% | 3% [q] | 7% |
Echelon Insights [90] | October 24–26, 2022 | 500 (LV) | ± 4.9% | 44% | 45% | – | 4% [r] | 7% |
45% | 48% | – | – | 6% | ||||
The Trafalgar Group (R) [91] | October 21–24, 2022 | 1,100 (LV) | ± 2.9% | 44% | 51% | – | 3% [s] | 2% |
Siena Research/NYT [92] | October 19–24, 2022 | 885 (LV) | ± 4.2% | 45% | 49% | – | <1% [t] | 5% |
Phillips Academy [93] | October 22–23, 2022 | 1,052 (LV) | ± 3.0% | 50% | 45% | – | – | 5% |
InsiderAdvantage (R) [94] [D] | October 20, 2022 | 550 (LV) | ± 4.2% | 43% | 49% | – | 4% [u] | 5% |
CBS News/YouGov [95] | October 14–19, 2022 | 1,057 (LV) | ± 4.4% | 48% | 48% | – | 4% [v] | – |
Data for Progress (D) [96] | October 13–19, 2022 | 819 (LV) | ± 3.0% | 47% | 48% | – | 3% [w] | 2% |
BSP Research/Shaw & Co. [97] [G] | October 12–19, 2022 | 1,000 (RV) | ± 3.1% | 43% | 41% | – | 6% [x] | 10% |
University of Nevada, Reno [98] | October 5–19, 2022 | 585 (LV) | ± 4.0% | 47% | 45% | – | 4% [y] | 5% |
Rasmussen Reports (R) [99] | October 13–17, 2022 | 707 (LV) | ± 4.0% | 42% | 47% | – | 7% [z] | 4% |
Suffolk University [100] | October 4–7, 2022 | 500 (LV) | ± 4.4% | 43% | 44% | 2% | 4% [aa] | 7% |
CNN/SSRS [101] | September 26 – October 2, 2022 | 926 (RV) | ± 4.7% | 46% | 46% | 5% | 2% [ab] | – |
828 (LV) | ± 5.0% | 46% | 48% | 4% | 2% [ac] | – | ||
OH Predictive Insights [102] | September 20–29, 2022 | 741 (LV) | ± 3.6% | 42% | 45% | 5% | 3% [ad] | 5% |
Big Data Poll [103] | September 18–20, 2022 | 1,000 (LV) | ± 3.0% | 40% | 42% | – | 5% | 13% |
The Trafalgar Group (R) [104] | September 17–20, 2022 | 1,086 (LV) | ± 2.9% | 45% | 48% | – | 5% [ae] | 3% |
Data for Progress (D) [105] | September 14–19, 2022 | 874 (LV) | ± 3.0% | 45% | 45% | – | 7% [af] | 3% |
Emerson College [106] | September 8–10, 2022 | 750 (LV) | ± 3.4% | 40% | 40% | – | 4% | 12% |
Fabrizio Ward (R)/Impact Research (D) [107] | August 16–24, 2022 | 1,332 (LV) | ± 4.4% | 41% | 38% | 3% | 7% [ag] | 10% |
46% | 48% | – | – | 6% | ||||
The Trafalgar Group (R) [108] | August 15–18, 2022 | 1,082 (LV) | ± 2.9% | 44% | 46% | – | 4% [ah] | 6% |
Suffolk University [109] | August 14–17, 2022 | 500 (LV) | ± 4.4% | 43% | 40% | 2% | 5% [ai] | 10% |
Beacon Research (D) [110] [H] | July 5–20, 2022 | 479 (RV) | ± 4.5% | 49% | 39% | – | 1% | 6% |
301 (LV) | ± 5.6% | 48% | 46% | – | 2% | 3% | ||
Emerson College [111] | July 7–10, 2022 | 2,000 (RV) | ± 2.1% | 44% | 40% | – | 9% | 7% |
The Tarrance Group (R) [112] [I] | July 5–10, 2022 | 600 (LV) | ± 4.1% | 46% | 44% | 5% | – | 5% |
Change Research (D) [113] [J] | June 24–27, 2022 | 701 (LV) | ± 3.7% | 46% | 43% | – | – | 11% |
WPA Intelligence (R) [114] [A] | June 4–6, 2022 | 502 (LV) | ± 4.4% | 47% | 48% | – | – | 5% |
University of Nevada, Reno [115] | May 17–27, 2022 | 1,091 (A) | ± 3.4% | 43% | 31% | – | 11% | 16% |
OH Predictive Insights [116] | April 1–9, 2022 | 748 (RV) | ± 4.4% | 44% | 35% | – | – | 21% |
Suffolk University [117] | April 2–6, 2022 | 500 (LV) | ± 4.4% | 37% | 39% | 6% | – | 18% |
Blueprint Polling (D) [118] | March 21–24, 2022 | 671 (LV) | ± 3.8% | 40% | 43% | – | – | 17% |
OH Predictive Insights [48] | January 19–26, 2022 | 755 (RV) | ± 3.6% | 52% | 48% | – | – | – |
Impact Research (D) [119] | December 1–7, 2021 | 800 (LV) | ± 3.7% | 47% | 45% | – | – | 8% |
OnMessage Inc. (R) [120] | November 16–18, 2021 | 600 (LV) | ± 4.0% | 41% | 51% | – | – | 8% |
The Mellman Group (D) [50] | September 15–22, 2021 | 600 (LV) | ± 4.0% | 45% | 44% | 3% | – | 8% |
Steve Sisolak vs. Joey Gilbert
Poll source | Date(s) administered | Sample size [b] | Margin of error | Steve Sisolak (D) | Joey Gilbert (R) | None of These Candidates | Other | Undecided |
---|---|---|---|---|---|---|---|---|
University of Nevada, Reno [115] | May 17–27, 2022 | 1,090 (A) | ± 3.4% | 43% | 17% | – | 20% | 19% |
OH Predictive Insights [116] | April 1–9, 2022 | 748 (RV) | ± 4.4% | 45% | 31% | – | – | 24% |
Suffolk University [117] | April 2–6, 2022 | 500 (LV) | ± 4.4% | 39% | 35% | 4% | – | 21% |
Steve Sisolak vs. Dean Heller
Poll source | Date(s) administered | Sample size [b] | Margin of error | Steve Sisolak (D) | Dean Heller (R) | None of These Candidates | Other | Undecided |
---|---|---|---|---|---|---|---|---|
University of Nevada, Reno [115] | May 17–27, 2022 | 1,094 (A) | ± 3.4% | 44% | 21% | – | 16% | 18% |
OH Predictive Insights [116] | April 1–9, 2022 | 748 (RV) | ± 4.4% | 46% | 33% | – | – | 21% |
Suffolk University [117] | April 2–6, 2022 | 500 (LV) | ± 4.4% | 39% | 39% | 7% | – | 15% |
OH Predictive Insights [48] | January 19–26, 2022 | 755 (RV) | ± 3.6% | 54% | 46% | – | – | – |
Impact Research (D) [119] | December 1–7, 2021 | 800 (LV) | ± 3.7% | 47% | 44% | – | – | 8% |
The Trafalgar Group (R) [121] | November 24–29, 2021 | 1,034 (LV) | ± 3.0% | 40% | 47% | – | – | 13% |
OnMessage Inc. (R) [120] | November 16–18, 2021 | 600 (LV) | ± 4.0% | 43% | 49% | – | – | 8% |
The Mellman Group (D) [50] | September 15–22, 2021 | 600 (LV) | ± 4.0% | 46% | 43% | 3% | – | 8% |
Steve Sisolak vs. John Lee
Poll source | Date(s) administered | Sample size [b] | Margin of error | Steve Sisolak (D) | John Lee (R) | None of These Candidates | Undecided |
---|---|---|---|---|---|---|---|
OH Predictive Insights [116] | April 1–9, 2022 | 748 (RV) | ± 4.4% | 46% | 33% | – | 21% |
Suffolk University [117] | April 2–6, 2022 | 500 (LV) | ± 4.4% | 37% | 40% | 5% | 18% |
Steve Sisolak vs. Guy Nohra
Poll source | Date(s) administered | Sample size [b] | Margin of error | Steve Sisolak (D) | Guy Nohra (R) | None of These Candidates | Undecided |
---|---|---|---|---|---|---|---|
Suffolk University [117] | April 2–6, 2022 | 500 (LV) | ± 4.4% | 41% | 29% | 7% | 23% |
Campaign finance reports as of October 17, 2022 | |||
---|---|---|---|
Candidate | Raised | Spent | Cash on hand |
Joe Lombardo (R) | $3,962,985 | $4,849,360 | $1,765,137 |
Steve Sisolak (D) | $6,528,859 | $13,525,957 | $1,216,990 |
Source: Nevada Secretary of State [122] |
No. | Date | Host | Moderator | Link | Democratic | Republican |
---|---|---|---|---|---|---|
Key: P Participant A Absent N Non-invitee I Invitee W Withdrawn | ||||||
Steve Sisolak | Joe Lombardo | |||||
1 | October 2, 2022 | KSNV | [123] | P | P |
Party | Candidate | Votes | % | ±% | |
---|---|---|---|---|---|
Republican | Joe Lombardo | 497,377 | 48.81% | +3.50% | |
Democratic | Steve Sisolak (incumbent) | 481,991 | 47.30% | −2.09% | |
Libertarian | Brandon Davis | 14,919 | 1.46% | +0.57% | |
None of These Candidates | 14,866 | 1.46% | -0.48% | ||
Independent American | Ed Bridges | 9,918 | 0.97% | −0.07% | |
Total votes | 1,019,071 | 100.0% | |||
Turnout | 1,023,617 | 54.58% | |||
Registered electors | 1,875,578 | ||||
Republican gain from Democratic |
By county | ||||||||||||||||||||||||||||||||||||||||||||||||||||||||||||||||||||||||||||||||||||||||||||||||||||||||||||||||||||||||||||||||||||||||||||||||||||||||||||||||||||||||||||||||||||||||||||||||||||||||||||||||||||||||||||||||||||||||||||||||||||||||||||||||||||||||||||||||||||||
---|---|---|---|---|---|---|---|---|---|---|---|---|---|---|---|---|---|---|---|---|---|---|---|---|---|---|---|---|---|---|---|---|---|---|---|---|---|---|---|---|---|---|---|---|---|---|---|---|---|---|---|---|---|---|---|---|---|---|---|---|---|---|---|---|---|---|---|---|---|---|---|---|---|---|---|---|---|---|---|---|---|---|---|---|---|---|---|---|---|---|---|---|---|---|---|---|---|---|---|---|---|---|---|---|---|---|---|---|---|---|---|---|---|---|---|---|---|---|---|---|---|---|---|---|---|---|---|---|---|---|---|---|---|---|---|---|---|---|---|---|---|---|---|---|---|---|---|---|---|---|---|---|---|---|---|---|---|---|---|---|---|---|---|---|---|---|---|---|---|---|---|---|---|---|---|---|---|---|---|---|---|---|---|---|---|---|---|---|---|---|---|---|---|---|---|---|---|---|---|---|---|---|---|---|---|---|---|---|---|---|---|---|---|---|---|---|---|---|---|---|---|---|---|---|---|---|---|---|---|---|---|---|---|---|---|---|---|---|---|---|---|---|---|---|---|---|---|---|---|---|---|---|---|---|---|---|---|---|---|---|---|---|---|---|---|---|---|---|---|---|---|---|---|---|---|---|---|---|
|
Despite losing re-election, Sisolak won three of the state's four congressional districts. [125]
District | Sisolak | Lombardo | Representative |
---|---|---|---|
1st | 51% | 46% | Dina Titus |
2nd | 41% | 55% | Mark Amodei |
3rd | 50% | 47% | Susie Lee |
4th | 49% | 46% | Steven Horsford |
Partisan clients
{{cite web}}
: CS1 maint: numeric names: authors list (link)Official campaign websites