1998 Nevada gubernatorial election

Last updated

1998 Nevada gubernatorial election
Flag of Nevada.svg
  1994 November 3, 1998 (1998-11-3) 2002  
  Kenny Guinn.jpg 3x4.svg
Nominee Kenny Guinn Jan Laverty Jones
Party Republican Democratic
Popular vote223,892182,281
Percentage51.6%42.0%

1998 Nevada gubernatorial election results map by county.svg
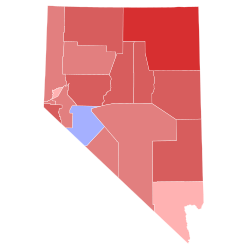
County results
Guinn:      40–50%     50–60%     60–70%     70–80%
Jones:      40–50%

Governor before election

Bob Miller
Democratic

Elected Governor

Kenny Guinn
Republican

The 1998 Nevada gubernatorial election occurred on November 3, 1998. Incumbent Democrat Bob Miller was term limited. Republican nominee Kenny Guinn defeated Democratic nominee Jan Laverty Jones to become Governor of Nevada.

Contents

This was the first open seat Nevada gubernatorial election since 1978, with Guinn becoming the first Republican elected as Nevada Governor since Robert List was elected in that same election.

Democratic primary

Candidates

Results

Democratic primary results [1]
PartyCandidateVotes%
Democratic Jan Laverty Jones 62,495 59.62%
Democratic Joe Neal16,64615.88%
None of These Candidates 12,85712.27%
Democratic Patrick Matthew "Pat" Fitzpatrick3,4683.31%
Democratic Barbara Scott3,2133.07%
Democratic Jim Champagne1,9641.87%
Democratic Burvle "Ed" Swindle1,5911.52%
Democratic Caeser D. Adamson1,1781.12%
Democratic John Geremia7810.75%
Democratic Carlo Poliak6300.60%
Total votes104,823 100.00%

Republican primary

Candidates

Results

Republican Primary results [1]
PartyCandidateVotes%
Republican Kenny Guinn 76,953 58.14%
Republican Aaron Russo34,25125.88%
Republican Lonnie Hammargren13,41010.13%
None of These Candidates 5,7834.37%
Republican Bruce Westcott1,9561.48%
Total votes132,353 100.00%

General election

Results

Nevada gubernatorial election, 1998 [2]
PartyCandidateVotes%±%
Republican Kenny Guinn 223,892 51.63% +10.31%
Democratic Jan Laverty Jones 182,28142.04%−10.65%
None of These Candidates 12,6412.92%+0.60%
Independent American Chuck Horne7,5091.73%−0.91%
Libertarian Terry C. Savage7,3071.69%+0.64%
Majority41,6119.60%
Total votes433,630 100.00%
Republican gain from Democratic Swing +20.86%

County results

CountyKenny Guinn
Republican
Jan Laverty Jones
Democratic
None of These CandidatesChuck Horne
Independent American
Terry C. Savage
Libertarian
MarginTotal votes cast [2]
# %# %# %# %# %# %
Carson City 8,76352.46%6,97641.76%4902.93%2481.48%2771.36%1,78710.70%16,704
Churchill 4,59363.52%2,13829.57%2183.01%1682.32%1141.58%2,45533.95%7,231
Clark 125,92649.82%111,64144.17%6,6982.65%4,5801.81%3,9001.54%14,2855.65%252,745
Douglas 8,78360.92%4,72732.79%4393.04%2401.66%2291.59%4,05628.13%14,418
Elko 7,35272.95%1,99019.75%2782.76%2552.53%2032.01%5,36253.21%10,078
Esmeralda 31959.51%13825.75%407.46%244.48%152.80%18133.77%536
Eureka 46168.50%15122.44%263.86%162.38%192.82%31046.06%673
Humboldt 2,62762.10%1,27130.05%1754.14%892.10%681.61%1,35632.06%4,230
Lander 1,33164.58%55126.73%984.75%411.99%401.94%78037.85%2,061
Lincoln 1,20461.68%54928.13%653.33%1025.23%321.64%65533.56%1,952
Lyon 5,04254.25%3,57638.48%3183.42%1711.84%1872.01%1,46615.77%9,294
Mineral 95143.95%1,01246.77%1205.55%482.22%331.52%-61-2.82%2,164
Nye 4,84451.05%3,88440.93%2702.85%2072.18%2842.99%96010.12%9,489
Pershing 87656.30%56236.12%634.05%291.86%261.67%31420.18%1,556
Storey 79047.19%70442.05%855.08%452.69%502.99%865.14%1,674
Washoe 47,96250.22%41,40943.36%3,1533.30%1,1441.20%1,8421.93%6,5536.86%95,510
White Pine 2,06862.38%1,00230.23%1053.17%1023.08%381.15%1,06632.16%3,315
Totals223,89251.63%182,28142.04%12,6412.92%7,5091.73%7,3071.69%41,6119.60%433,630

Counties that flipped from Democratic to Republican

References

  1. 1 2 "1998 Official Primary Election Results" (PDF). Nevada Secretary of State. Retrieved June 26, 2018.
  2. 1 2 "1998 Official General Election Returns" (PDF). Nevada Secretary of State. Retrieved June 26, 2018.