2022 United States House of Representatives elections in Texas Last updated December 09, 2025
2022 United States House of Representatives elections in Texas Majority party Minority party Party Republican Democratic Last election 23 13 Seats before 24 12 Seats won 25 13 Seat change Popular vote 4,559,280 3,004,053 Percentage 58.78% 38.73% Swing
Democratic
Hold
Gain
Republican
Hold
Gain
Party gains Republican
40–50%
50–60%
60–70%
70–80%
80–90%
>90%
Democratic
50–60%
60–70%
70–80%
District results Republican
40–50%
50–60%
60–70%
70–80%
80–90%
>90%
Democratic
50–60%
60–70%
70–80%
County results
The 2022 United States House of Representatives elections in Texas were held on November 8, 2022, to elect the 38 U.S. representatives from Texas , one from each of the state's 38 congressional districts . The state gained two seats after the results of the 2020 census . The elections coincided with other elections to the House of Representatives, other elections to the United States Senate , and various state and local elections . Primary elections took place on March 1, with primary runoffs scheduled for May 24 for districts where no candidate received over 50% of the vote.
Republicans had gained one seat in the House due to a special election in the 34th district seeing Mayra Flores succeed Filemon Vela and become the first Mexican-born congresswoman. [ 1] [ 2] During the 2022 elections, the Democrats and Republicans each gained one of the two seats Texas gained through reapportionment. [ 3] [ 4] While Republicans flipped the 15th district , Democrats flipped back the 34th district, and retained the 28th district , dashing Republican hopes of a red wave in the Rio Grande Valley . [ 5] This resulted in a net gain of one seat for both parties.
Redistricting The Texas Legislature drew new maps for Texas' congressional districts to account for the two new congressional districts it gained through the 2020 census . The Republican Party had a trifecta in the Texas Government at the time, giving them full control of the redistricting process. [ 6] Legislators drew the maps for the state during a special session in Fall 2021. [ 7] The maps that passed were widely criticized as racial and partisan gerrymanders designed to keep Republicans in power and reduce the voting power of minorities. [ 8] [ 9] News sources specifically noted that both of Texas' new congressional districts were majority white, despite voters of color making up 95% of the state's growth in the previous decade. [ 10] [ 11] [ 12] [ 13]
Unlike before the 2012 elections , Texas' maps did not have to pass preclearance under Section 5 of the Voting Rights Act of 1965 , as the Supreme Court had ruled preclearance unconstitutional through Shelby County v. Holder in 2013. [ 14] [ 15] Despite this, the Justice Department sued the state of Texas after the map's passage, arguing that they violated Section 2 of the Voting Rights Act. [ 16]
Overview Statewide Popular vote Republican
58.78% Democratic
38.73% Libertarian
1.66% Independent
0.81% Write-in
0.02%
House seats Republican
65.8% Democratic
34.2%
District 1 2022 Texas's 1st congressional district election County resultsMoran: 70–80% 80–90% ≥90%
The 1st district encompasses Tyler , Longview , and Texarkana . The incumbent was Republican Louie Gohmert , who had represented the district since 2004 and was reelected with 72.6% of the vote in 2020. [ 17] On November 22, 2021, Gohmert announced that he would run for Texas Attorney General against incumbent Ken Paxton . [ 18]
Republican primary Candidates Eliminated in primary Aditya Atholi, former oil rig worker [ 20] Joe McDaniel II, businessman [ 21] John Porro, physician [ 21] Democratic primary Candidates Eliminated in runoff Victor Dunn, businessman [ 25] Eliminated in primary Gavin Dass, teacher [ 25] Stephen Kocen, self-employed [ 21] District 2 2022 Texas's 2nd congressional district election Results by county Results by precinct Crenshaw: 50–60% 60–70% 70–80% 80–90%Fulford: 50–60% 60–70% 70–80% 80–90%
Tie: 50%
The 2nd district encompasses The Woodlands , Spring , Kingwood , Humble , and Atascocita . The incumbent was Republican Dan Crenshaw , who had represented the district since 2019 and was reelected with 55.6% of the vote in 2020.
Republican primary Incumbent representative Dan Crenshaw , who had maintained a high profile since his election, faced three primary challengers. [ 37] All three ran as more conservative alternatives to Crenshaw, criticizing him for his vote to certify the results of the 2020 presidential election . [ 37]
Candidates Eliminated in primary Jameson Ellis, marketing executive [ 38] Martin Etwop, Christian missionary [ 39] Milam Langella, pilot [ 25] Endorsements Dan Crenshaw
Organizations
Newspapers and publications
Democratic primary Candidates Nominee Robin Fulford, stay-at-home mother [ 25] District 3 2022 Texas's 3rd congressional district election County results Precinct results Self: 40–50% 50–60% 60–70% 70–80% 80–90% ≥90%Srivastava: 40–50% 50–60% 60–70% ≥90%
Tie: 40–50%
The 3rd district encompasses much of Collin County and Hunt County . The incumbent was Republican Van Taylor , who had represented the district since 2019 and was reelected with 55.1% of the vote in 2020. On March 2, 2022, after being forced into a runoff, Taylor announced he would end his reelection campaign amid allegations of infidelity with a former jihadist . [ 48] Former judge Keith Self became the Republican nominee following Taylor's withdrawal, canceling the runoff. [ 49] [ 50]
Republican primary Candidates Eliminated in primary Suzanne Harp, sales executive [ 25] [ 51] Jeremy Ivanovskis, flight attendant [ 25] Rickey Williams, educator [ 25] Endorsements Van Taylor
U.S. senators
Organizations
Runoff results The Republican primary runoff was canceled following Taylor's withdrawal. Self became the Republican nominee. [ 50]
Democratic primary Endorsements Sandeep Srivastava
Organizations
Collin County Young Democrats [ 57] Labor unions
District 4 2022 Texas's 4th congressional district election County resultsFallon: 50–60% 70–80% 80–90%
The 4th district encompasses counties along the Red River , as well as some sections of the suburban and exurban DFW Metroplex . The incumbent was Republican Pat Fallon , who had represented the district since 2021 and was elected with 75.1% of the vote in 2020. [ 17]
Republican primary Endorsements Pat Fallon
Executive branch officials
Organizations
Democratic primary Candidates Nominee Iro Omere, consultant [ 25] District 5 2022 Texas's 5th congressional district election County resultsGooden: 60–70% 80–90%Hill: 40–50%
The 5th district encompasses Mesquite , Anderson , Cherokee , Henderson , Van Zandt , and Kaufman . The incumbent was Republican Lance Gooden , who had represented the district since 2019 and was reelected with 62% of the vote in 2020.
Republican primary Endorsements Lance Gooden
Executive branch officials
District 6 2022 Texas's 6th congressional district election County resultsEllzey: 100%
The 6th district encompasses Ellis County and Palestine . The incumbent was Republican Jake Ellzey , who had represented the district since 2021 and was elected with 53.3% of the vote in 2021 after the previous incumbent, Ron Wright , died of complications from COVID-19 on February 7, 2021. [ 17]
Republican primary Candidates Eliminated in primary James Buford, maintenance supervisor [ 25] Bill Payne, retired attorney [ 25] Endorsements Jake Ellzey
Executive branch officials
Organizations
District 7 2022 Texas's 7th congressional district election County results Precinct results Fletcher: 50–60% 60–70% 70–80% 80–90% ≥90%Teague: 50–60% 60–70% ≥90%
No vote:
The 7th district encompasses the suburbs of Houston such as Gulfton and Alief . The incumbent was Democrat Lizzie Fletcher , who had represented the district since 2019 and was reelected with 50.8% of the vote in 2020. [ 17]
Democratic primary Endorsements Lizzie Fletcher
Organizations
Labor unions
Republican primary Candidates Nominee Johnny Teague, pastor, rancher and author of The Lost Diary of Anne Frank [ 25] [ 70] Eliminated in runoff Tim Stroud, former combat medic [ 71] Eliminated in primary Rudy Atencio, mediator conflict specialist [ 25] Tina Blum Cohen, actress and furniture company owner [ 25] [ 51] Benson Gitau, businessman [ 25] [ 51] Laique Rehman, entrepreneur [ 25] Lance Stewart, franchisee [ 25] Endorsements Johnny Teague
Federal officials
Tom DeLay , former House majority leader and former US representative from Texas [ 76] District 8 2022 Texas's 8th congressional district election County resultsLuttrell: 80–90%Jones: 50–60%
The 8th district includes northern suburbs and exurbs of Houston such as Conroe and Willis . It was represented by Republican Kevin Brady , who retired, leaving the 8th as an open seat during the 2022 election.
Republican primary Candidates Eliminated in primary Betsy Bates, surgical tech [ 25] Candice Burrows, businesswoman [ 25] Christian Collins, former aide to Ted Cruz [ 78] Jonathan Hullihan, Navy JAG veteran and attorney [ 25] Dan McKaughan, pastor and U.S. Navy veteran [ 79] [ 51] Jonathan Mitchell, pipeliner [ 25] Chuck Montgomery, comedian [ 25] Michael Philips, telecom executive [ 25] Jessica Wellington, former congressional aide [ 25] Taylor Whichard, Willis public works director [ 25] [ 51] Endorsements Christian Collins
U.S. senators
U.S. representatives
State and local officials
Individuals
PACs
Morgan Luttrell
Executive branch officials
U.S. governors
U.S. representatives
PACs
District 9 2022 Texas's 9th congressional district election County results Precinct results Green: 50–60% 60–70% 70–80% 80–90% ≥90%Leon: 50–60% 70–80%
The 9th district encompasses the southern Houston suburbs such as Missouri City . The incumbent was Democrat Al Green , who was reelected with 75.5% of the vote in 2020. [ 17]
Democratic primary Endorsements Al Green
Labor unions
Organizations
Republican primary Candidates Nominee Jimmy Leon, educator [ 25] District 10 2022 Texas's 10th congressional district election County resultsMcCaul: 50–60% 60–70% 80–90%Nuno: 50–60%
The 10th district stretches from northwestern Austin to Bryan–College Station . The incumbent was Republican Michael McCaul , who was reelected in 2020 with 52.6% of the vote. [ 17]
Republican primary Endorsements Michael McCaul
Executive branch officials
Organizations
Democratic primary Candidates Nominee Linda Nuno, healthcare worker [ 25] District 11 2022 Texas's 11th congressional district election County resultsPfluger: 100%
The 11th district is based in midwestern Texas, including Lamesa , Midland , Odessa , San Angelo , Granbury , and Brownwood . The incumbent was Republican August Pfluger , who was elected with 79.7% of the vote in 2020. [ 17]
Republican primary Endorsements August Pfluger
Executive branch officials
District 12 2022 Texas's 12th congressional district election County results Precinct results Granger: 50–60% 60–70% 70–80% 80–90% ≥90%Hunt: 50–60% 60–70% 70–80% 80–90% ≥90%Tie: 50%
No vote:
The 12th district is in the Dallas–Fort Worth metroplex , and takes in Parker County and western Tarrant County , including parts of Fort Worth and its inner suburbs of North Richland Hills , Saginaw , and Haltom City . The incumbent was Republican Kay Granger , who was reelected with 63.7% of the vote in 2020. [ 17]
Republican primary Candidates Eliminated in primary Ryan Catala, public school administrator [ 25] Alysia Rieg, EMT [ 25] Endorsements Kay Granger
Executive branch officials
Organizations
Democratic primary Candidates Nominee Trey Hunt, social worker [ 25] District 13 2022 Texas's 13th congressional district election County resultsJackson: 70–80% 80–90% ≥90%Brown: 50–60%
The 13th district encompasses most of the Texas Panhandle , containing the cities of Amarillo , Gainesville and Wichita Falls , as well as northern Denton County . The incumbent was Republican Ronny Jackson , who was elected with 79.4% of the vote in 2020. [ 17]
Republican primary Endorsements Ronny Jackson
Executive branch officials
Democratic primary Candidates Nominee Kathleen Brown, attorney [ 108] District 14 2022 Texas's 14th congressional district election County resultsWeber: 60–70% 70–80% 80–90%No vote:
The 14th district takes in the southern and southeastern region of Greater Houston , including Galveston , Jefferson County and southern Brazoria County . The incumbent was Republican Randy Weber , who was reelected with 61.6% of the vote in 2020. [ 17]
Republican primary Candidates Eliminated in primary Keith Casey, accountant and perennial candidate [ 25] [ 51] Ruben Landon Dante, actor [ 110] [ 25] Endorsements Randy Weber
Executive branch officials
Organizations
Democratic primary Candidates Nominee Mikal Williams, attorney [ 25] Eliminated in primary Eugene Howard, educator [ 25] General election Results Official sources list Williams as having received 63,606 votes, but a reporting error from Galveston County undercounted his vote total by 5,000 votes. [ 111]
District 15 2022 Texas's 15th congressional district election County resultsDe La Cruz: 50–60% 70–80% 80–90%Vallejo: 50–60% 60–70%
The 15th district stretches from western Hidalgo County in the Rio Grande Valley , northward into rural counties in the Greater San Antonio area. The incumbent was Democrat Vicente Gonzalez , who was reelected with 50.5% of the vote in 2020. [ 17] On October 26, 2021, Gonzalez announced that he would run for election in the neighboring 34th district , while still serving District 15 until 2023. [ 112] The district was also significant as, despite its historical Democratic lean, Donald Trump came within two points of winning it in 2020 , and the newly drawn 15th is even more Republican than its predecessor.
This district was included on the list of Democratic-held seats that the National Republican Congressional Committee was targeting in 2022. [ 113]
Democratic primary Candidates Nominee Michelle Vallejo, flea market owner [ 25] Eliminated in runoff Ruben Ramirez, U.S. Army veteran, trial attorney, and candidate for this seat in 2016 [ 112] [ 51] Endorsements Ruben Ramirez
U.S. representatives
Organizations
Michelle Vallejo
U.S. senators
U.S. representatives
Colin Allred , U.S. representative for TX-32 [ 116] Joaquin Castro , U.S. representative for TX-20 [ 118] Henry Cuellar , U.S. representative for TX-28 [ 116] Lloyd Doggett , former U.S. representative for TX-35 [ 116] Veronica Escobar , U.S. representative for TX-16 [ 115] Lizzie Fletcher , U.S. representative for TX-7 [ 116] Sylvia Garcia , U.S. representative for TX-29 [ 115] Vicente Gonzalez , U.S. representative for TX-15 [ 116] Ruben Hinojosa , former U.S. representative for TX-15 [ 118] Pramila Jayapal , U.S. representative for WA-07 [ 130] Beto O'Rourke , former U.S. representative for TX-16 and nominee for governor in 2022 [ 116] Lucille Roybal-Allard , U.S. representative for CA-40 [ 118] Marc Veasey , U.S. representative for TX-33 [ 116] Filemon Vela , former U.S. representative for TX-34 [ 116] State legislators
Diego Bernal , state representative [ 116] Terry Canales , state representative [ 118] Jasmine Crockett , state representative and nominee for TX-30 in 2022 [ 116] Wendy Davis , former state senator, nominee for governor of Texas in 2014 , and nominee for TX-21 in 2020 [ 115] Sarah Eckhardt , state senator [ 116] Oscar Longoria , state representative [ 116] Ray Lopez , state representative [ 116] Armando Martinez , state representative [ 118] [ 116] Sergio Muñoz, Jr. , state representative [ 116] Victoria Neave , state representative [ 116] Ron Reynolds , state representative [ 116] Erin Zwiener , state representative [ 116] Local officials
Labor unions
Organizations
Individuals
Primary runoff Polling Poll source Date(s) Sample [ a] Margin Ruben Michelle Undecided GBAO (D) [ 138] [ A] April 13–18, 2022 500 (LV) ± 4.4% 37% 49% 15% Lake Research Partners (D) [ 139] [ B] March 23–27, 2022 400 (LV) ± 4.9% 29% 39% 25%
Results Runoff results by county Endorsements Monica de la Cruz
Executive branch officials
U.S. representatives
Organizations
Results Cartogram of Texas's 15th congressional district District 16 2022 Texas's 16th congressional district election Results by county Results by precinct Escobar: 50–60% 60–70% 70–80% 80–90%Armendariz-Jackson: 50–60%Tie: 50%
No vote:
The 16th district is entirely within El Paso County , taking in El Paso , Horizon City , and Anthony . The incumbent was Democrat Veronica Escobar , who was reelected with 64.7% of the vote in 2020. [ 17]
Democratic primary Candidates Eliminated in primary Deliris Montanez Berrios, retired medical worker [ 25] [ 51] Endorsements Veronica Escobar
Labor unions
Organizations
Republican primary Candidates Nominee Irene Armendariz-Jackson, realtor and nominee for this seat in 2020 [ 25] [ 51] Withdrew Samuel Williams Jr, candidate for this seat in 2020 General election Post-primary endorsements District 17 2022 Texas's 17th congressional district election County resultsSessions: 60–70% 70–80% 80–90%Woods: 50–60% 60–70%
The 17th district covers parts of suburban north Austin stretching to rural central and eastern Texas, including Waco and Lufkin . The incumbent was Republican Pete Sessions , who was reelected with 55.9% of the vote in 2020. [ 17]
Republican primary Candidates Eliminated in primary Paulette Carson, retired Bible studies publisher [ 25] [ 51] Jason "Stormchaser" Nelson, U.S. Army veteran [ 25] Rob Rosenberger, businessman [ 25] District 18 2022 Texas's 18th congressional district election Results by county Results by precinct Jackson Lee: 40–50% 50–60% 60–70% 70–80% 80–90% ≥90%Montiel: 40–50% 50–60% 70–80%Tie: 40–50%
No vote:
The 18th district is based in Downtown Houston and takes in the heavily black areas of Central Houston. The incumbent was Democrat Sheila Jackson Lee , who was reelected with 73.3% of the vote in 2020. [ 17]
Endorsements Sheila Jackson Lee
Labor unions
Organizations
District 19 2022 Texas's 19th congressional district election County resultsArrington: 70–80% 80–90% ≥90%
The 19th district encompasses rural West Texas , taking in Lubbock and Abilene . The incumbent was Republican Jodey Arrington , who was reelected with 74.8% of the vote in 2020. [ 17] He ran for reelection against Independent Nathan Lewis of Lubbock.
Republican primary Endorsements Jodey Arrington
Executive branch officials
District 20 2022 Texas's 20th congressional district election Results by county Results by precinct Castro: 50–60% 60–70% 70–80% 80–90% ≥90%Sinclair: 50–60% 60–70% ≥90%
No vote:
The 20th district encompasses downtown San Antonio . The incumbent was Democrat Joaquin Castro , who was reelected with 64.7% of the vote in 2020. [ 17]
Democratic primary Endorsements Joaquin Castro
Organizations
Labor unions
District 21 2022 Texas's 21st congressional district election County resultsRoy: 50–60% 70–80% 80–90%Zapata: 50–60%
The 21st district extends from north San Antonio to central and south Austin , taking in rural parts of the Texas Hill Country . The incumbent was Republican Chip Roy , who was elected with 52.0% of the vote in 2020. [ 17]
Democratic primary Endorsements Claudia Zapata
Newspapers and other media
Organizations
Labor unions
Coy Branscum
Newspapers and other media
District 22 2022 Texas's 22nd congressional district election County resultsNehls: 60–70% 70–80%
The 22nd district encompasses the south-central Greater Houston metropolitan area, including the southern Houston suburbs of Sugar Land , Pearland , and Webster . The incumbent was Republican Troy Nehls , who was elected with 51.5% of the vote in 2020. [ 17]
Republican primary Candidates Eliminated in primary Gregory Thorne, accountant [ 25] Endorsements Troy Nehls
Executive branch officials
Organizations
Democratic primary Candidates Nominee Jamie Kaye Jordan, attorney [ 25] District 23 2022 Texas's 23rd congressional district election County resultsGonzales: 40–50% 50–60% 60–70% 70–80% 80–90%Lira: 50–60% 60–70%
The 23rd district covers southwestern Texas, including the Big Bend , the southern and western San Antonio suburbs, and the southwestern El Paso suburbs. The incumbent was Republican Tony Gonzales , who was elected with 50.6% of the vote in 2020. [ 17]
This district was included on the list of Republican-held seats the Democratic Congressional Campaign Committee was targeting in 2022. [ 163]
Republican primary Candidates Eliminated in primary Alma Arredondo-Lynch, dentist and rancher [ 25] Alia Garcia, motel owner [ 25] [ 51] Results 2022 GOP primary results by county: 50–60% Gonzales
60–70% Gonzales
70–80% Gonzales
80–90% Gonzales
Democratic primary Candidates Eliminated in primary Priscilla Golden, social worker [ 25] Endorsements John Lira
U.S. representatives
State legislators
Labor unions
Organizations
General election Polling Poll source Date(s) Sample [ a] Margin Tony John Frank Other Undecided Public Policy Polling (D) [ 171] [ D] July 28–29, 2022 452 (V) ± 4.6% 42% 26% 6% 1% [ c] 25%
District 24 2022 Texas's 24th congressional district election County results Precinct results Van Duyne: 50–60% 60–70% 70–80% 80–90% ≥90%McDowell: 50–60% 60–70% ≥90%
No vote:
The 24th district encompasses the suburbs north of Fort Worth and Dallas , including Grapevine , Bedford , and the Park Cities . The incumbent was Republican Beth Van Duyne , who was elected with 48.8% of the vote in 2020. [ 17]
This district was included on the list of Republican-held seats the Democratic Congressional Campaign Committee was targeting in 2022. [ 163]
Republican primary Candidates Eliminated in primary Nate Weymouth, scientist [ 25] Endorsements Beth Van Duyne
Executive branch officials
Organizations
Democratic primary Candidates Nominee Jan McDowell, public accountant and perennial candidate [ 25] [ 51] Eliminated in primary Kathy Fragnoli, attorney and mediator [ 25] Endorsements Derrik Gay
Labor unions
Organizations
General election Results Cartogram of Texas's 24th congressional district District 25 2022 Texas's 25th congressional district election County resultsWilliams: 100%
The 25th district runs from Arlington out to rural exurbs of southern Fort Worth such as Granbury . The incumbent was Republican Roger Williams , who was reelected with 55.9% of the vote in 2020. [ 17]
Republican primary Endorsements Roger Williams
Executive branch officials
District 26 2022 Texas's 26th congressional district election County resultsBurgess: 60–70% 80–90%No vote:
The 26th district is based in the northern portion of the Dallas–Fort Worth metroplex , centering on eastern Denton County . Before redistricting, the district comprised almost all of Denton County and part of Tarrant . In the newly approved map, Denton , the county seat of Denton County, was removed from the district as well as parts of Frisco , to the 13th and 4th congressional district, respectively. Additionally, Cooke County and parts of Wise County were added to the district. With Denton's removal from the district, Lewisville is the district's largest city. The incumbent was Republican Michael C. Burgess , who was reelected with 60.6% of the vote in 2020. [ 17]
Republican primary Candidates Eliminated in primary Brian Brazeal, independent investor [ 25] Vincent Gallo, construction contractor [ 25] [ 51] Raven Harrison, businesswoman [ 25] Isaac Smith, licensed home inspector [ 25] [ 51] Endorsements Michael Burgess
Executive branch officials
Organizations
District 27 2022 Texas's 27th congressional district election County resultsCloud: 50–60% 60–70% 70–80% 80–90% ≥90%
The 27th district stretches across the Coastal Bend , from Corpus Christi up to Bay City . The incumbent was Republican Michael Cloud , who was reelected with 63.1% of the vote in 2020. [ 17]
Republican primary Candidates Eliminated in primary Andrew Alvarez, auto dealership consultant [ 25] A.J. Louderback, Jackson County sheriff [ 25] [ 51] Chris Mapp, retail worker [ 25] Eric Mireles, oil and gas consultant [ 25] Endorsements Michael Cloud
Executive branch officials
Organizations
Democratic primary Candidates Nominee Maclovio Perez, broadcaster [ 25] Eliminated in primary Victor Melgoza, doctor [ 25] Anthony Tristan, financial consultant [ 25] [ 51] District 28 2022 Texas's 28th congressional district election County resultsCuellar: 50–60% 60–70% 70–80%Garcia: 60–70% 70–80%
The 28th district is based in the Laredo area and stretches north of the Rio Grande Valley into east San Antonio . The incumbent was Democrat Henry Cuellar , who was reelected with 58.3% of the vote in 2020. [ 17]
This district was included on the list of Democratic-held seats the National Republican Congressional Committee was targeting in 2022. [ 113]
Democratic primary Candidates Eliminated in primary Tannya Benavides, teacher [ 182] (endorsed Cisneros in runoff) [ 183] Endorsements Jessica Cisneros
U.S. senators
U.S. representatives
State legislators
Labor unions
Organizations
Newspapers and publications
Individuals
Henry Cuellar
U.S. representatives
Organizations
Names in bold are endorsements made before the run-off but after the primary
Polling Poll source Date(s) Sample [ a] Margin Jessica Henry Other Undecided RMG Research [ 228] November 14–21, 2021 400 (LV) ± 4.9% 36% 35% 7% 17%
Results Primary results by county: Primary runoff results Primary runoff results by county: 50–60%
60–70%
80–90%
90–100%
On the evening of the runoff election, the count had Cuellar leading Cisneros by 177 votes (0.4%). Cuellar's lead increased to 281 votes (0.6%) after provisional and cured ballots were counted. Cisneros filed for a recount on June 7, 2022. [ 229] The recount confirmed Cuellar's victory by an increased margin of 289 votes. [ 230]
Republican primary Candidates Nominee Cassy Garcia, former congressional aide [ 25] [ 51] Eliminated in runoff Sandra Whitten, Sunday school teacher and nominee for this seat in 2020 [ 231] Eliminated in primary Ed Cabrera, businessman and rancher [ 232] Steven Fowler, combat veteran [ 233] Eric Hohman, management analyst [ 25] Willie Vasquez Ng, former police detective [ 234] Rolando Rodriguez, activist [ 25] [ 51] Endorsements Cassy Garcia
Federal officials
Labor unions
Willie Vasquez Ng
Newspapers and publications
Results Primary results by county: 20–30%
30–40%
50–60%
60–70%
Results Primary runoff results by county: District 29 2022 Texas's 29th congressional district election Results by county Results by precinct Garcia: 50–60% 60–70% 70–80% 80–90% ≥90%Schafranek: 50–60% 60–70% 70–80%Tie: 50%
No vote:
The 29th district encompasses parts of northern and southeastern Houston , taking in the heavily Latino areas of the city. The incumbent was Democrat Sylvia Garcia , who was elected with 71.1% of the vote in 2020. [ 17]
Democratic primary Endorsements Sylvia Garcia
Labor unions
Organizations
Republican primary Candidates Nominee Robert Schafranek, sales associate and perennial candidate [ 25] [ 51] Eliminated in runoff Julio Garza, insurance executive [ 25] Eliminated in primary Jaimy Blanco, real estate investor [ 25] Lulite Ejigu, financial executive [ 25] District 30 2022 Texas's 30th congressional district election Results by county Results by precinct Crockett: 40–50% 50–60% 60–70% 70–80% 80–90% ≥90%Rodgers: 40–50% 50–60% 70–80% ≥90%Tie: 40–50% 50%
No vote:
The 30th district encompasses Downtown Dallas as well as South Dallas . The incumbent was Democrat Eddie Bernice Johnson , who was reelected with 77.5% of the vote in 2020. [ 17] In 2019, Johnson announced that she would not seek reelection after her next term. [ 237]
Democratic primary Candidates Eliminated in runoff Jane Hope Hamilton, former chief of staff for U.S. Representative Marc Veasey [ 239] Endorsements Jasmine Crockett
U.S. senators
U.S. representatives
Organizations
Newspapers and publications
Jane Hope Hamilton
Executive branch officials
U.S. representatives
State officials
Local politicians
Organizations
Jessica Mason
U.S. representatives
State officials
Individuals
Organizations
Polling Poll source Date(s) Sample [ a] Margin Barbara Jasmine Jane Jessica Abel Undecided Lester & Associates (D) [ 256] [ E] January 9–12, 2022 400 (LV) ± 4.9% 11% 35% 3% 1% 1% 49%
Republican primary Candidates Nominee James Rodgers, job recruiter [ 25] Eliminated in runoff James Harris, retiree [ 25] Eliminated in primary Lizbeth Diaz, paralegal [ 25] Kelvin Goodwin-Castillo, mechanic [ 25] [ 51] Kinya Jefferson, self-employed [ 25] Angeigh Roc'ellerpitts, minister [ 25] District 31 2022 Texas's 31st congressional district election County resultsCarter: 100%
The 31st district encompasses the exurbs of Austin to Temple , including parts of Williamson and Bell counties. The incumbent was Republican John Carter , who was reelected with 53.4% of the vote in 2020. [ 17]
Republican primary Candidates Eliminated in primary Abhiram Garapati, small business owner and candidate for this seat in 2020 [ 25] Mike Williams, retired firefighter and candidate for this seat in 2020 [ 25] Endorsements John Carter
Executive branch officials
Organizations
District 32 2022 Texas's 32nd congressional district election County results Precinct results Allred: 50–60% 60–70% 70–80% 80–90% ≥90%Swad: 50–60% 80–90% ≥90%
The 32nd district covers northern and eastern Dallas and its inner northern suburbs. The incumbent was Democrat Colin Allred , who was reelected with 51.9% of the vote in 2020. [ 17]
This district was included on the list of Democratic-held seats the National Republican Congressional Committee was targeting in 2022. [ 113] However, due to redistricting, the seat became much safer, so it was unlikely that it would be targeted to the same degree.
Democratic primary Endorsements Colin Allred
Labor unions
Organizations
Republican primary Candidates Nominee Antonio Swad, restaurant chain founder [ 25] [ 51] Eliminated in runoff Justin Webb, financial executive [ 25] [ 51] Eliminated in primary Nathan Davis, consultant [ 25] Darrell Day, businessman [ 25] Brad Namdar, businessman [ 25] E. E. Okpa, realtor and perennial candidate [ 25] [ 51] Endorsements Brad Namdar
Elected officials
Organizations
District 33 2022 Texas's 33rd congressional district election Results by county Results by precinct Veasey: 40–50% 50–60% 60–70% 70–80% 80–90% ≥90%Gillespie: 50–60% 60–70% 70–80% ≥90%Tie: 40–50%
No vote:
The 33rd district is in the Dallas–Fort Worth metroplex , encompassing Downtown Fort Worth , western Dallas , and parts of Grand Prairie , Irving , Carrollton , and Farmers Branch . The incumbent was Democrat Marc Veasey , who was reelected with 66.8% of the vote in 2018. [ 17]
Democratic primary Candidates Eliminated in primary Carlos Quintanilla, businessman [ 25] [ 51] Endorsements Marc Veasey
Labor unions
Organizations
Republican primary Candidates Nominee Patrick Gillespie, writer [ 25] Eliminated in primary Robert Glafin, business consultant [ 25] District 34 2022 Texas's 34th congressional district election County resultsGonzalez: 50–60%Flores: 50–60% 70–80%
The 34th district stretches from McAllen and Brownsville in the Rio Grande Valley , northward along the Gulf Coast . The incumbent was Republican Mayra Flores , who was first elected with 50.9% of the vote in 2022. [ 17] On March 22, 2021, former incumbent Filemon Vela announced that he would not seek reelection in 2022. [ 262] On October 26, 2021, Vicente Gonzalez , the representative for Texas's 15th congressional district , announced that he intended to run in the new 34th district after the 15th became more Republican and his residence was put into the 34th. [ 112]
Republican primary Candidates Eliminated in primary Juana Cantu-Cabrera, nurse practitioner [ 25] Gregory Kunkle, musician [ 25] [ 51] Frank McCaffrey, former broadcast journalist [ 141] Democratic primary Candidates Eliminated in primary Laura Cisneros, oncologist [ 25] Filemon Meza, teacher [ 25] Beatriz Reynoso, graphic designer [ 25] Osbert Rodriguez Haro, farmer [ 25] William Thompson, investor [ 25] Diego Zavala, vice principal [ 25] Endorsements Vicente Gonzalez
U.S. representatives
Labor unions
Organizations
Mayra Flores
Executive branch officials
Texas officials
US senators
General election Polling Poll source Date(s) Sample [ a] Margin Mayra Vicente Other Undecided RMG Research [ 270] July 23 – August 1, 2022 400 (LV) ± 4.9% 43% 47% 3% 8%
District 35 2022 Texas's 35th congressional district election County resultsCasar: 60–70% 80–90%McQueen: 60–70%
The 35th district connects eastern San Antonio to southeastern Austin , through the I-35 corridor. The incumbent was Democrat Lloyd Doggett , who was reelected with 65.4% of the vote in 2020. [ 17] On October 18, 2021, Doggett announced that he would run for reelection in the new 37th district , leaving the 35th open. [ 271]
Democratic primary Endorsements Greg Casar
U.S. senators
U.S. representatives
State legislators
Municipal officials
Individuals
Labor unions
Organizations
Newspapers and other media
Eddie Rodriguez
Federal officials
State legislators
Sheryl Cole , state representative for District 46 (2019–present) [ 296] Philip Cortez , state representative for District 117 (2013-2015, 2017–present) [ 295] Barbara Gervin-Hawkins , state representative for District 120 (2017–present) [ 295] Vikki Goodwin , state representative for District 47 (2019–present) [ 296] Gina Hinojosa , state representative for District 49 (2017–present) [ 296] Donna Howard , state representative for District 48 (2006–present) [ 296] Celia Israel , state representative for District 50 (2014–present) [ 296] Ray Lopez , state representative for District 125 (2019–present) [ 295] Trey Martinez Fischer , state representative for District 116 (2001–2017; 2019–present) [ 297] Organizations
Newspapers and other media
Rebecca Viagran
Executive officials
State officials
Local officials
Republican primary Candidates Eliminated in runoff Michael Rogriguez, household manager [ 25] Eliminated in primary Jenai Aragona, realtor [ 25] Bill Condict, program scheduler [ 25] Marilyn Jackson, insurance agent [ 25] Alejandro Ledezma, construction laborer [ 25] Sam Montoya, reporter [ 25] Asa Palagi, entrepreneur [ 25] Dan Sawatzki, U.S. Air Force veteran [ 25] Jennifer Sundt, attorney [ 25] District 36 2022 Texas's 36th congressional district election County results Precinct results Babin: 50–60% 60–70% 70–80% 80–90% >90%Haire: 50–60% 60–70% 70–80% 80–90% >90% No votes
The 36th district encompasses parts of Southeast Texas , including the Clear Lake region . The incumbent was Republican Brian Babin , who was reelected with 73.6% of the vote in 2020. [ 17]
Republican primary Endorsements Brian Babin
Executive branch officials
Democratic primary Candidates Nominee Marvin Jonathan "Jon" Haire, scientist [ 303] District 37 2022 Texas's 37th congressional district election County results Precinct results Doggett: 50–60% 60–70% 70–80% 80–90% ≥90%Sharon: 50–60%
The new 37th congressional district is centered on Austin . Incumbent Democrat Lloyd Doggett , who previously represented the 35th district , will run here. [ 271] He was reelected with 65.4% of the vote in 2020.
Democratic primary Candidates Declined Julie Oliver, Democratic nominee for TX-25 in 2018 and 2020 [ 305] Endorsements Lloyd Doggett
Federal officials
State legislators
Municipal officials
Labor unions
Organizations
Newspapers and other media
Republican primary Candidates Nominee Jenny Sharon, caregiver [ 25] Eliminated in primary Jeremiah Diacogiannis, business manager [ 25] District 38 2022 Texas's 38th congressional district election Results by county Results by precinct Hunt: 40–50% 50–60% 60–70% 70–80% 80–90% ≥90%Klussmann: 40–50% 50–60% 60–70% ≥90%
Tie: 40–50%
The new 38th district is based in the north and northwest Harris County Houston suburbs such as Jersey Village , Cypress , Tomball , Katy , and Klein . This was a new district; there was no incumbent.
Republican primary Polling Poll source Date(s) Sample [ a] Margin Phil John JerryFord Sr. Brett Wesley Roland Damien Mark Richard Undecided Moore Information Group (R) [ 308] [ H] January 24–25, 2022 400 (LV) ± 4.9% <1% 1% 2% 1% 54% 2% 1% 3% <1% 36%
Endorsements Wesley Hunt
Executive branch officials
Organizations
Democratic primary Candidates Eliminated in runoff Diana Martinez Alexander, educator [ 25] Eliminated in primary Centrell Reed, media company owner [ 25] [ 51] Independent Declared Joel Dejean, former electronics design engineer [ 310] Notes 1 2 3 4 5 6 7 8 Key: ↑ Leone with 4%; "Someone else" with 1% ↑ Hart with 1% ↑ After weighting (regional oversample of 50 voters in targeted precincts in Hays County) Partisan clients
↑ This poll was sponsored by 314 Action , which supported Ruben Ramirez. ↑ This poll was sponsored by Vallejo's campaign. ↑ This poll was sponsored by Way to Win, which supported Vallejo. ↑ This poll was sponsored by Lira's campaign. ↑ This poll was sponsored by Crockett's campaign. ↑ This poll was sponsored by the Working Families Party and the Justice Democrats, both of which endorsed Casar. 1 2 This poll was sponsored by Casar's campaign. ↑ This poll was sponsored by Hunt's campaign. References ↑ Martinez, Marissa (June 14, 2022). "Republican Mayra Flores flips Dem House seat in South Texas" . POLITICO . Retrieved February 8, 2023 . ↑ Medina, Jennifer (June 15, 2022). "Republicans flip a Democratic-held House seat in South Texas, at least for now" . The New York Times . ISSN 0362-4331 . Retrieved February 8, 2023 . ↑ Bludau, Janelle (November 8, 2022). "Republican Wesley Hunt claims victory in Texas' newly created 38th Congressional District" . khou.com . Retrieved February 8, 2023 . ↑ "Texas election: Lloyd Doggett wins newly-created U.S. House District 37" . KXAN Austin . November 8, 2022. Retrieved February 8, 2023 . ↑ Alvey, Rebekah (November 9, 2022). "Dashing GOP hopes of South Texas red wave, Dems Gonzalez and Cuellar survive 2022 midterms" . The Dallas Morning News . Retrieved February 8, 2023 . ↑ Ura, Alexa (April 26, 2021). "Texas will gain two seats in Congress as residents of color drive population gains" . The Texas Tribune . Retrieved February 8, 2023 . ↑ Kao, Alexa Ura and Jason (September 20, 2021). "Texas Republicans have the redistricting tools to preserve their power. Here's how they can do it" . The Texas Tribune . Retrieved February 8, 2023 . ↑ Li, Michael; Boland, Julia (December 7, 2021). "Anatomy of the Texas Gerrymander" . www.brennancenter.org . Brennan Center for Justice . Retrieved February 8, 2023 . ↑ Rodriguez, Jessica (July 25, 2022). "SMU team generated 1.5M district maps, but none were as gerrymandered as Texas' pick" . The Dallas Morning News . Retrieved February 8, 2023 . ↑ Ura, Alexa (October 19, 2021). "Texas Republicans send Gov. Greg Abbott a new congressional map that protects GOP power, reduces influence of voters of color" . The Texas Tribune . Retrieved February 8, 2023 . ↑ Limón, Elvia (October 25, 2021). "Gov. Greg Abbott signs off on Texas' new political maps, which protect GOP majorities while diluting voices of voters of color" . The Texas Tribune . Retrieved February 8, 2023 . ↑ Rakich, Nathaniel (February 28, 2022). "Texas May Have The Worst Gerrymander In The Country" . FiveThirtyEight . Retrieved February 8, 2023 . ↑ Dallas Morning News Editorial Board (October 12, 2021). "Texas redistricting needs to go back to the drawing board" . The Dallas Morning News . Retrieved February 8, 2023 . ↑ Ura, Alexa (September 17, 2021). "In a changing Texas, Republicans will begin redistricting with more freedom to draw their maps" . The Texas Tribune . Retrieved February 8, 2023 . ↑ Liptak, Adam (June 25, 2013). "Supreme Court Invalidates Key Part of Voting Rights Act" . The New York Times . ISSN 0362-4331 . Retrieved February 8, 2023 . ↑ "Justice Department Files Lawsuit Against the State of Texas to Challenge Statewide Redistricting Plans" . www.justice.gov . December 6, 2021. Retrieved February 8, 2023 . 1 2 3 4 5 6 7 8 9 10 11 12 13 14 15 16 17 18 19 20 21 22 23 24 25 26 27 28 29 30 31 32 Wasserman, David; et al. "2020 House Tracker" . The Cook Political Report . Archived from the original on November 4, 2020. Retrieved July 20, 2021 . ↑ Roy, Reagan (November 22, 2021). "IT'S OFFICIAL: US Rep. Louie Gohmert announces he's running for Texas Attorney General" . CBS. Retrieved November 22, 2021 . ↑ "Smith County Judge Nathaniel Moran officially announces congressional candidacy" . www.kltv.com . KLTV . December 2, 2021. Retrieved December 2, 2021 . 1 2 Morris, Allie; Caldwell, Emily (November 9, 2021). "Louie Gohmert considers joining crowded 2022 Republican primary race against Texas AG Ken Paxton" . The Dallas Morning News . Archived from the original on November 9, 2021. Retrieved November 9, 2021 . 1 2 3 Wellerman, Zak (December 8, 2021). "Kilgore businessman enters race to represent East Texas in Congress" . Tyler Morning Telegraph . Archived from the original on December 8, 2021. Retrieved December 11, 2021 . ↑ Atholi, Aditya [@Atholi4Congress] (February 12, 2022). "NEW ENDORSEMENT: Conservative Leadership PAC #txlege #tx01 @MortonBlackwell https://t.co/AmwhfQHkP0" (Tweet ). Archived from the original on March 3, 2022. Retrieved December 28, 2022 – via Twitter . ↑ Atholi, Aditya [@Atholi4Congress] (February 4, 2022). "I am proud to have the endorsement of my former commanding officer Stuart Scheller. A patriot who spoke out against the Afghanistan withdrawal debacle. Join our movement as we run for this open seat in Congress Texas district one. https://t.co/KUmN6652Sy #hereistheplan https://t.co/vSuqyGBkom" (Tweet ). Archived from the original on March 1, 2022. Retrieved December 28, 2022 – via Twitter . ↑ Atholi, Aditya [@Atholi4Congress] (February 10, 2022). "It is GREAT to get to get the endorsement of Dr. @kelliwardaz Chairwoman of the @AmericaFirstPAC. #NoMorePoliticians. #hereistheplan #RoughneckforCongress #partyoflocalgovernment https://t.co/NCXjLFEfL7" (Tweet ). Archived from the original on December 2, 2022. Retrieved December 28, 2022 – via Twitter . 1 2 3 4 5 6 7 8 9 10 11 12 13 14 15 16 17 18 19 20 21 22 23 24 25 26 27 28 29 30 31 32 33 34 35 36 37 38 39 40 41 42 43 44 45 46 47 48 49 50 51 52 53 54 55 56 57 58 59 60 61 62 63 64 65 66 67 68 69 70 71 72 73 74 75 76 77 78 79 80 81 82 83 84 85 86 87 88 89 90 91 92 93 94 95 96 97 98 99 100 101 102 103 104 105 106 107 108 109 110 111 112 113 114 115 116 117 118 119 120 121 122 123 124 125 126 127 128 129 130 131 132 133 134 135 136 137 138 139 140 141 142 143 144 145 146 147 148 149 150 151 152 153 154 155 156 157 158 159 160 161 162 163 164 165 166 167 "Qualified Candidates" . Texas Secretary of State . Retrieved December 14, 2021 . 1 2 3 4 5 6 7 8 9 10 11 12 13 14 15 16 17 18 19 20 21 22 "2022 Endorsements" . www.texasaflcio.org . Texas AFL-CIO. January 21, 2022. Retrieved April 25, 2022 . 1 2 3 4 5 6 7 8 9 10 11 12 13 14 15 16 17 18 "Texas - UAW Endorsements" . United Auto Workers . 1 2 3 4 5 6 7 8 9 10 11 12 13 14 15 16 17 18 19 20 21 22 23 24 25 26 27 28 29 30 31 32 33 34 35 36 37 38 "2022 House Race Ratings" . The Cook Political Report . Retrieved October 26, 2021 . 1 2 3 4 5 6 7 8 9 10 11 12 13 14 15 16 17 18 19 20 21 22 23 24 25 26 27 28 29 30 31 32 33 34 35 36 37 38 "House Ratings" . The Rothenberg Political Report. Retrieved November 15, 2021 . 1 2 3 4 5 6 7 8 9 10 11 12 13 14 15 16 17 18 19 20 21 22 23 24 25 26 27 28 29 30 31 32 33 34 35 36 37 38 "2022 House Ratings" . Sabato's Crystal Ball . November 11, 2021. Retrieved November 11, 2021 . 1 2 3 4 5 6 7 8 9 10 11 12 13 14 15 16 17 18 19 20 21 22 23 24 25 26 27 28 29 30 31 32 33 34 35 36 37 38 "2022 Election Forecast" . Politico . April 5, 2022. 1 2 3 4 5 6 7 8 9 10 11 12 13 14 15 16 17 18 19 20 21 22 23 24 25 26 27 28 29 30 31 32 33 34 35 36 37 38 "Battle for the House 2022" . RCP . June 9, 2022. 1 2 3 4 5 6 7 8 9 10 11 12 13 14 15 16 17 18 19 20 21 22 23 24 25 26 27 28 29 30 31 32 33 34 35 36 37 38 "2022 Election Forecast" . Fox News . July 11, 2022. Retrieved July 11, 2022 . 1 2 3 4 5 6 7 8 9 10 11 12 13 14 15 16 17 18 19 20 21 22 23 24 25 26 27 28 29 30 31 32 33 34 35 36 37 38 "2022 Election Forecast" . DDHQ . July 20, 2022. Retrieved July 20, 2022 . 1 2 3 4 5 6 7 8 9 10 11 12 13 14 15 16 17 18 19 20 21 22 23 24 25 26 27 28 29 30 31 32 33 34 35 36 37 38 "2022 Election Forecast" . FiveThirtyEight . June 30, 2022. Archived from the original on June 30, 2022. Retrieved June 30, 2022 . 1 2 3 4 5 6 7 8 9 10 11 12 13 14 15 16 17 18 19 20 21 22 23 24 25 26 27 28 29 30 31 32 33 34 35 36 37 38 "The Economist's 2022 House Election forecast" . The Economist . Retrieved September 28, 2022 . 1 2 3 The Editorial Board (February 8, 2022). "Editorial: We recommend Dan Crenshaw in GOP primary for 2nd Congressional District" . Houston Chronicle . Retrieved April 9, 2022 . ↑ "America First Candidate Jameson Ellis Seeks to Unseat Rep. Dan Crenshaw in TX-2" . EIN News . November 3, 2021. Retrieved December 16, 2021 . 1 2 Candidate, Online. "Etwop For Congress | Home" . martinetwop.com . ↑ "Mike Billand" . Ballotpedia . 1 2 "Brett Guillory" . Ballotpedia . ↑ Chen, Shawna (April 14, 2021). "GOP Rep. Kevin Brady won't run for re-election" . Axios. Retrieved April 14, 2021 . 1 2 "Citizens for Responsible Energy Solutions Announces Second Round of Congressional Endorsements for the 2022 Election Cycle" . cresenergy.com . Citizens for Responsible Energy Solutions . May 4, 2022. Archived from the original on August 21, 2022. Retrieved June 7, 2022 . 1 2 3 4 5 6 7 8 9 10 11 12 13 14 "NRA-PVF: Grades" . NRA-PVF . Archived from the original on February 19, 2022. Retrieved February 19, 2022 . ↑ National Right to Life [@nrlc] (February 28, 2022). "National Right to Life endorses @DanCrenshawTX for reelection! Strong allies like @DanCrenshawTX are essential if we're going to enact policies and laws that protect life. #VoteProLife #TXPrimary https://t.co/d6Lgef4xGi" (Tweet ). Archived from the original on March 1, 2022. Retrieved December 28, 2022 – via Twitter . 1 2 3 Kassel, Matthew (July 1, 2021). "Pro-Israel America announces new batch of 2022 congressional endorsements" . Jewish Insider . Retrieved January 21, 2022 . ↑ U. S. REPRESENTATIVE DISTRICT 2 , Texas Secretary of State , November 8, 2022. 1 2 Svitek, Patrick (March 2, 2022). "U.S. Rep. Van Taylor ends reelection campaign after allegation of affair" . The Texas Tribune . Retrieved March 2, 2022 . ↑ Gillman, Todd J. (March 2, 2022). "Rep. Van Taylor apologizes for affair with 'ISIS bride,' abruptly drops reelection bid" . The Dallas Morning News . Retrieved March 2, 2022 . 1 2 "Keith Self, ex-Collin County judge, now GOP nominee for Rep. Van Taylor's seat after incumbent exits" . Dallas News . March 11, 2022. Retrieved March 19, 2022 . 1 2 3 4 5 6 7 8 9 10 11 12 13 14 15 16 17 18 19 20 21 22 23 24 25 26 27 28 29 30 31 32 33 34 35 36 37 38 39 40 41 "Politics1 - Online Guide to Texas Elections, Candidates & Politics" . ↑ "Eagle Forum PAC endorses Keith Self for Congress" . Eagle Forum . ↑ "As Collin County trends purple, Republicans draw U.S. House boundaries that bolster GOP power" . Dallas News . October 19, 2021. ↑ "Sandeep Srivastava" . Ballotpedia . 1 2 "Filing ends for 2022 primary elections" . December 16, 2021. 1 2 Doc Shelby For Congress TX-3 [@docshelby2022] (September 29, 2021). "Hi. I'm Doc Shelby & I'm a Democrat running for Congress in #TX4. My priorities include economic security, sensible immigration solutions, and strengthening our rural healthcare system. The people want change NOW, please RT & follow" (Tweet ). Archived from the original on May 21, 2022. Retrieved December 28, 2022 – via Twitter . {{cite web }}: CS1 maint: numeric names: authors list (link ) ↑ "2022 Endorsed Candidates" (PDF) . vantaylor.com . Retrieved January 25, 2022 . 1 2 3 "Trump endorses Texas rep who said he 'very well may have' committed impeachable offenses" . November 12, 2021. ↑ "Earl Davis" . Ballotpedia . 1 2 3 4 5 6 7 8 9 10 Gillman, Todd J. (March 2, 2022). "Donald Trump, in flurry of Texas endorsements, snubs 4 Republicans who affirmed Joe Biden win Jan. 6" . The Dallas Morning News (published February 24, 2022). Archived from the original on March 6, 2022. Retrieved March 6, 2022 . ↑ Tang, Lisa (August 19, 2021). "Bailey announces District 5 bid in 2022" . Palestine Herald-Press . Retrieved August 24, 2021 . ↑ Ramirez, Fernando (June 24, 2021). "North Texas attorney makes bid against Rep. Lance Gooden" . www.texassignal.com . The Texas Signal. Retrieved July 28, 2021 . ↑ Gearing, Charlie [@GearingforTexas] (October 14, 2021). "Exciting news! I'm running for Texas House District 114 - my home district! https://t.co/7FmHlRYxPH" (Tweet ). Archived from the original on January 29, 2022. Retrieved December 28, 2022 – via Twitter . ↑ "EMILY's List Endorses 17 Congresswomen for Reelection" . www.emilyslist.org . EMILY's List. March 26, 2021. Archived from the original on April 24, 2021. 1 2 3 4 5 "2022 Feminist Majority PAC Endorsements" . feministmajoritypac.org . Retrieved April 9, 2022 . ↑ "Giffords Endorses Slate of Gun Safety Champions" . www.giffords.org . Giffords . March 23, 2022. 1 2 "NWPC 2022 Endorsed Candidates" . National Women's Political Caucus . ↑ "Planned Parenthood Action Fund 2022 Endorsements" . www.plannedparenthoodaction.org . ↑ "Our Recommended Candidates" . educationvotes.nea.org . National Education Association . ↑ "An evangelical GOP House candidate in Texas wrote a novel about Anne Frank finding Jesus" . October 31, 2022. ↑ Jennings, David (July 26, 2021). "CD-7 Candidate Tim Stroud visits Downtown Houston Pachyderm Club" . Big Jolly Politics. Retrieved September 14, 2021 . 1 2 Manjarres, Javier (July 11, 2021). "Business Consultant Roland Lopez Challenges Democrat Rep. Lizzie Fletcher" . www.texaspolitics.com . Texas Politics. Retrieved July 28, 2021 . ↑ "Texans For Lopez" . texansforlopez.com . 1 2 3 "Damien Mockus" . Ballotpedia . 1 2 "Richard Welch (Texas)" . Ballotpedia . ↑ "Former House Majority Leader of the U.S. Congress, Tom Delay" . Archived from the original on May 19, 2022. Retrieved June 28, 2022 . ↑ Roy, Reagan (June 3, 2021). "Retired Navy Seal Morgan Luttrell announces bid for congress" . KYTX . Archived from the original on June 3, 2021. Retrieved July 1, 2021 . ↑ "Christian Collins For Congress Campaign Kickoff at Honor Cafe" . Eventbrite . 1 2 Hansen, Holly (October 1, 2021). "GOP Candidates for Congressional District 8 Agree on Impeaching Biden, Removing General Milley" . The Texan. Retrieved October 26, 2021 . ↑ Forward, Jeff (April 19, 2021). "Bunch says not considered possibly seeking Brady's seat" . Houston Chronicle . Archived from the original on April 19, 2021. Retrieved May 2, 2021 . One person has announced a bid for Brady's seat. Rudy Atencio, who briefly ran for Congress in Washington State before quitting, posted on his Twitter page a note that he was seeking Brady's seat in 2022. 1 2 "Jerry Ford Sr" . Ballotpedia . ↑ "Chief Ford is exploring a run for the newly created Texas 38th Congressional District" . Facebook . ↑ "Salvador Gallegos" . Ballotpedia . ↑ "Ryan Jarchow" . Ballotpedia . ↑ "A Note From Ryan" . Archived from the original on January 13, 2022. Retrieved January 13, 2022 . ↑ "Adrian Kaiser" . Ballotpedia . ↑ "Christopher Revis" . Ballotpedia . ↑ Chen, Shawna (April 14, 2021). "GOP Rep. Kevin Brady won't run for re-election" . Axios. Retrieved April 14, 2021 . 1 2 3 Scherer, Jasper (December 7, 2021). "Houston-area congressional race draws 9 GOP primary candidates, endorsements from top Republicans" . Houston Chronicle . Retrieved December 15, 2021 . 1 2 3 4 5 6 Scherer, Jasper (February 14, 2022). "Marjorie Taylor Greene headlines weekend rally for Houston congressional candidate" . Houston Chronicle . 1 2 3 4 5 6 7 Akin, Stephanie (February 17, 2022). "GOP primary in Texas tests how far Trump loyalty should extend" . Roll Call . ↑ Wall, Noah (February 11, 2022). "FreedomWorks for America Endorses Christian Collins in Texas' Eighth Congressional District" . FreedomWorks for America . Retrieved February 27, 2022 . ↑ "ENDORSEMENTS" . www.housefreedomfund.com . Retrieved January 28, 2022 . ↑ Nikki Haley (February 10, 2022). "I'm proud to endorse Morgan Luttrell. ..." Facebook . Retrieved February 26, 2022 . ↑ "Trump war with GOP seeps into midterms" . December 8, 2021. 1 2 3 Axelrod, Tal (January 5, 2022). "GOP-aligned Congressional Leadership Fund unveils first midterm endorsements" . The Hill . Retrieved January 5, 2022 . ↑ "Candidates" . ↑ "Editorial: We recommend Jessica Wellington in GOP primary for 8th Congressional District" . Houston Chronicle . February 5, 2022. ↑ Item, The Huntsville (January 6, 2020). "Jones announces candidacy for U.S. Congress, District 8" . Itemonline.com . ↑ U. S. REPRESENTATIVE DISTRICT 8 , Texas Secretary of State , November 8, 2022. 1 2 3 4 5 6 7 8 9 10 "Sierra Club Endorsements" . March 19, 2021. 1 2 3 "Endorsed Candidates" . proisraelamerica.org . Archived from the original on December 20, 2021. Retrieved January 23, 2022 . ↑ Wallace, Larry [@DrLarryWallace1] (October 15, 2021). "After considerable deliberation, I am suspending my congressional campaign. https://t.co/SKUSsBeksp" (Tweet ). Archived from the original on March 3, 2022. Retrieved December 28, 2022 – via Twitter . 1 2 Smith, James (November 10, 2021). "August Pfluger launches re-election campaign for TX-11, receives endorsement from Donald Trump" . www.conchovalleyhomepage.com . Retrieved November 10, 2021 . ↑ "Chris Putnam" . Ballotpedia . ↑ "Chris Rector (Texas)" . Ballotpedia . 1 2 3 "2022 Candidates" . www.maggieslist.org . Archived from the original on April 14, 2021. Retrieved January 2, 2021 . ↑ "Wichita Falls attorney announces bid for 13th district congressional seat" . May 3, 2021. Retrieved May 8, 2021 . ↑ Watkins, Matthew (September 3, 2021). "Trujillo announces intent not to run for office in 2022" . www.abc7amarillo.com . KVII-TV . Retrieved November 28, 2021 . ↑ Gilbert, David (July 15, 2021). "Great, QAnon Candidates Are Trying to Take Over Congress" . Vice.com . Vice. Retrieved September 5, 2021 . ↑ "Canvass Results Report" . Galveston Votes . November 21, 2022. Retrieved January 8, 2023 . 1 2 3 4 5 6 7 8 Svitek, Patrick (October 26, 2021). "U.S. Rep. Vicente Gonzalez will run for a different House seat in 2022 after redistricting made his more competitive" . The Texas Tribune . Archived from the original on October 26, 2021. Retrieved October 26, 2021 . 1 2 3 Stephanie Akin (February 10, 2021). "These 47 House Democrats are on the GOP's target list for 2022" . Roll Call . ↑ Reyes, Dayna (October 22, 2021). "Alvarado announces candidacy for 'open' Congressional District 15" . Rio Grande Guardian . Archived from the original on October 22, 2021. Retrieved October 23, 2021 . 1 2 3 4 5 6 7 "Alvarado endorses Vallejo in Congressional District 15 runoff" . March 11, 2022. 1 2 3 4 5 6 7 8 9 10 11 12 13 14 15 16 17 18 19 20 21 22 23 24 "Alvarado endorses Vallejo in Congressional District 15 runoff" . March 11, 2022. ↑ Svitek, Patrick [@PatrickSvitek] (April 22, 2022). "In #TX15 Democratic primary runoff, @MichelleVforTX gets endorsement of former opponent @RigneyTeam, who finished third in six-way March primary with 19% https://t.co/p1plSe2XvW" (Tweet ). Archived from the original on May 21, 2022. Retrieved December 28, 2022 – via Twitter . 1 2 3 4 5 6 7 8 9 10 11 Montoya, Luis (September 4, 2022). "Over 100 Texas leaders endorse Vallejo for Congressional District 15" . Rio Grande Guardian . ↑ "ruben_ramirez_for_congress Rep. Barragán and I are cut from the same cloth, and I am thrilled to have her endorsement!" . www.instagram.com . ↑ "ruben_ramirez_for_congress As someone who has spent his life serving his community and his country, I am truly excited to have Congressman Carbajal joining our team!" . www.instagram.com . ↑ "Congressman Lou Correa has been a fighter for access to a quality education at all levels of government. He knows the power of an education to allow everyone in our communities to grow and thrive, to keep our economy growing, and to ensure that everyone has access to the American Dream" . www.instagram.com . ↑ "ruben_ramirez_for_congress I am honored to have the endorsement of Congressman Vicente Gonzalez, a fighter of South Texas values, who helped bring over $5.8 billion dollars in funding for District 15 and over $800 million for our schools" . www.instagram.com . ↑ "ruben_ramirez_for_congress Trailblazing Congresswoman Linda Sanchez, a fighter for Latino communities and the first Latina ever elected to House Leadership today endorsed our campaign!" . www.instagram.com . ↑ "314 Action Fund Endorses Ruben Ramirez, Former Science Teacher, in TX-15 Race" . 314 Action . February 17, 2022. ↑ "Dem moderates get choosy in midterm recruits as GOP headwinds grow" . Politico . April 6, 2022. ↑ "DMFI PAC releases second slate of endorsements of pro-Israel Democrats" . Jewish News Syndicate . March 14, 2022. ↑ "Our Candidates" . www.newpolitics.org . New Politics. Retrieved May 31, 2022 . ↑ "VoteVets PAC Endorses Ruben Ramirez for Congress" . www.votevets.org . January 24, 2022. ↑ "Bernie Sanders hits the campaign trail with days left before US midterms" . the Guardian . November 4, 2022. Retrieved November 15, 2022 . ↑ Schnell, Mychael (May 11, 2022). "Jayapal endorses six progressive House candidates" . Politico. Retrieved May 11, 2022 . 1 2 3 4 "Meet The Candidates" . Archived from the original on December 23, 2022. Retrieved October 26, 2021 . ↑ "Hispanic Caucus endorses Michelle Vallejo in Texas toss-up" . The Hill . July 11, 2022. Retrieved August 8, 2022 . 1 2 3 "Democracy for America : Our Candidates" . Democracy for America . Retrieved July 16, 2022 . 1 2 3 "End Citizens United - Candidates" . End Citizens United . Retrieved January 28, 2022 . ↑ "LCV Action Fund and Latino Victory Fund Endorse Michelle Vallejo for Congress" . www.lcv.org . August 30, 2022. 1 2 "NARAL Pro-Choice America Endorses Champions and Future Leaders for Reproductive Freedom in Key U.S. House Races in Ohio and Texas" . www.prochoiceamerica.org . NARAL Pro-Choice America . April 26, 2022. Retrieved April 27, 2022 . 1 2 3 4 5 "Our endorsed candidates - Texas College Democrats" . TX College Democrats . ↑ GBAO (D) Archived April 28, 2022, at the Wayback Machine ↑ Lake Research Partners (D) ↑ "Republican challenger to run again after narrow loss in Texas border congressional district" . Fox 8 . February 1, 2021. Retrieved February 27, 2021 . 1 2 Alvarez, Xavier (August 30, 2021). "Former broadcast journalist announces congressional run" . www.myrgv.com . Retrieved September 5, 2021 . ↑ Singman, Brooke (November 10, 2021). "Stefanik rolls out first round of 2022 endorsements to Republican women, says they will be 'majority makers' . www.foxnews.com . Fox News . Retrieved November 10, 2021 . 1 2 Steinhauser, Paul (March 16, 2022). "Sen. Ron Johnson tops list of Republicans endorsed by top Jewish GOP organization" . www.foxnews.com . Fox News . Retrieved March 22, 2022 . ↑ Bendixen & Amandi International ↑ RMG Research ↑ Jackson, Anthony (June 10, 2021). "El Paso Democratic US Rep. Veronica Escobar seeks reelection in 3rd run for Congress" . El Paso Times . Retrieved August 11, 2021 . ↑ "LCV Action Fund Announces First Round of Incumbent House Endorsements" . www.lcv.org . February 10, 2022. 1 2 "We're proud to endorse these reproductive freedom champions and leaders!" . www.prochoiceamerica.org . Retrieved January 22, 2022 . 1 2 "Join the Bold Progressive Movement!" . Progressive Change Campaign Committee (BoldProgressives.org) . ↑ Armendariz-Jackson, Irene [@ArmendarizDis16] (August 22, 2022). "I am INCREDIBLY honored to be endorsed by @MayraFlores2022. We saw what she accomplished with her incredible victory and now I'm going to do the same thing in my district. Help me win today: https://t.co/J7LGaqrIvP https://t.co/h2D6WciSQh" (Tweet ). Archived from the original on August 23, 2022. Retrieved December 28, 2022 – via Twitter . ↑ "Jodey Arrington announces 2022 re-election bid for 19th Congressional District" . www.fox34.com . KJTV-TV . December 2, 2021. Retrieved December 2, 2021 . 1 2 3 4 "Stonewall Democrats announce endorsements for March primary election" . January 25, 2022. Retrieved February 8, 2022 . ↑ Wright, Will (November 19, 2021). "GOP dominates early candidate filings in Comal County" . herald-zeitung.com/ . New Braunfels Herald-Zeitung. Retrieved December 26, 2021 . 1 2 3 4 Wallace, Jeremy (June 23, 2021). "Ted Cruz defends Texas Rep. Chip Roy as Donald Trump attacks him" . www.houstonchronicle.com . Houston Chronicle. Retrieved July 28, 2021 . ↑ "Club for Growth - PAC Endorsed Candidates" . Club for Growth - PAC Endorsed Candidates . Retrieved January 28, 2022 . ↑ "FRC Action PAC Endorses Chip Roy for U.S. House of Representatives in Texas" . February 17, 2022. Retrieved August 13, 2022 . ↑ "FreedomWorks for America Endorses Chip Roy in Texas' 21st Congressional District" . www.freedomworksforamerica.org . September 2, 2021. Retrieved January 10, 2022 . 1 2 Cobb, Timia (July 24, 2021). "Fight for accountability continues with community protest for Jennifer Miller" . www.universitystar.com . Archived from the original on July 28, 2021. Retrieved July 28, 2021 . 1 2 3 Lindell, Chuck (November 4, 2021). "Greg Casar to leave Austin City Council, run for Congress" . Austin American-Statesman . Gannett . Archived from the original on November 5, 2021. Retrieved November 5, 2021 . ↑ "Coy Branscum" . Ballotpedia . ↑ "Cherif Gacis" . Ballotpedia . 1 2 3 4 "March 1 Democratic Primary Endorsements (No Filler)" . The Austin Chronicle . February 10, 2022. 1 2 "DCCC Announces 2021-2022 Districts In Play" . dccc.org . DCCC. April 6, 2021. Retrieved April 7, 2021 . ↑ "First Democrat jumps into key Texas House race to challenge Gonzales" . May 19, 2021. Retrieved May 19, 2021 . ↑ "Beto O'Rourke endorses John Lira, Democratic nominee for Texas House of Representatives District 23" . August 24, 2022. Retrieved September 7, 2022 . 1 2 3 "Candidates competing to represent San Antonio's Southside in November" . April 4, 2022. Retrieved May 27, 2022 . ↑ Akin, Stephanie (November 30, 2021). "Latino Democratic PAC looks to Oregon, Nebraska for 2022 pickup opportunities" . www.rollcall.com . Roll Call . Retrieved November 30, 2021 . ↑ "LATINO VICTORY ENDORSES VETERAN JOHN LIRA IN TX-23" . September 29, 2021. Retrieved May 27, 2022 . ↑ "Endorsement: John Lira for Congress, Texas' 23rd District" . www.newpolitics.org . June 17, 2021. Retrieved November 28, 2021 . ↑ "VoteVets PAC Endorses John Lira for Congress" . www.votevets.org . June 29, 2021. Retrieved November 24, 2021 . ↑ Public Policy Polling (D) 1 2 3 4 Jeffers, Gromer Jr. (December 10, 2021). "Donald Trump endorses four Texas GOP incumbents for Congress" . www.dallasnews.com . The Dallas Morning News . Retrieved December 10, 2021 . ↑ "Turning Point Action" . Turning Point Action - Endorsements . Retrieved January 28, 2022 . ↑ Svitek, Patrick (July 20, 2021). "Texas House Democrat Michelle Beckley announces run against Republican U.S. Rep. Beth Van Duyne" . The Texas Tribune . Archived from the original on July 20, 2021. Retrieved July 21, 2021 . ↑ "Michelle Beckley" . Ballotpedia . 1 2 "May 2022 Primary Runoff Election Endorsements" . Retrieved August 21, 2022 . ↑ "ARA Endorses Jan McDowell" . July 24, 2022. ↑ "Texas Election Night Results" . Texas Department of State. Retrieved November 17, 2022 . ↑ Garcia, Berenice (November 28, 2021). "Eight candidates eyeing District 28 seat in 2022" . www.myrgv.com . The Monitor . Retrieved November 28, 2021 . ↑ Navarro, Aaron (June 7, 2022). "Jessica Cisneros files for recount in race against Rep. Henry Cuellar in Texas' 28th District" . CBS News . Retrieved June 8, 2022 . ↑ Ramirez, Fernando (August 4, 2021). "Jessica Cisneros files for a second congressional run" . www.texassignal.com . The Texas Signal. Retrieved August 5, 2021 . ↑ Reyes, Justin (June 11, 2021). "Laredo educator announces run for Texas' 28th Congressional District seat" . KGNS . Retrieved June 14, 2021 . ↑ Cisneros, Jessica [@JCisnerosTX] (May 10, 2022). "Our coalition is getting bigger! Grateful to team up w/ @TannyaForTexas & have her support. Tannya ran as a pro-choice progressive candidate to meet the challenges working folks face in #TX28. Over 50% voted for change in the primary, and I know we will defeat Cuellar on May 24. https://t.co/aAhsRrlIT2" (Tweet ). Archived from the original on May 14, 2022. Retrieved December 28, 2022 – via Twitter . ↑ "The Idiotic "Sex Scandal" in Texas Is Further Proof That Henry Cuellar Needs to Go" . Jacobin . March 12, 2022. Retrieved March 30, 2022 . ↑ Sanches, Carlos (January 31, 2022). "Texas Democrat tied to Azerbaijan inquiry faces tough primary election contest" . The Guardian . Retrieved January 31, 2022 . ↑ Ackley, Kate; Akin, Stephanie (December 9, 2021). "At the Races: Blurred lines" . Roll Call . Archived from the original on December 10, 2021. Retrieved December 10, 2021 . ↑ Markey, Ed [@EdMarkey] (March 10, 2022). "I proudly endorse @JCisnerosTX, a strong progressive, an immigration rights lawyer, and a Green New Deal and Build Back Better champion fighting to deliver clean water, clean air, and good jobs to South Texas. We need Jessica Cisneros in Congress. https://t.co/63BTozLnsC" (Tweet ). Archived from the original on November 15, 2022. Retrieved December 28, 2022 – via Twitter . ↑ Chávez, Aída (December 7, 2021). "Jessica Cisneros Is the Future of the Democratic Party" . The Nation . Retrieved December 7, 2021 . ↑ Wu, Nicholas (May 19, 2022). "Pramila Jayapal endorses Jessica Cisneros in Texas runoff" . POLITICO . Retrieved May 19, 2022 . ↑ Vaillancourt, William (January 21, 2022). "Feds Raided a House Democrat's Home Over an Investigation Involving Azerbaijan: Report" . Rolling Stone . Retrieved January 21, 2022 . ↑ Kennedy, Kaitlyn (February 14, 2022). "Bernie Sanders Endorses Jessica Cisneros in Texas Primary Race" . Tag24 . Retrieved April 15, 2022 . 1 2 3 4 5 6 7 Perano, Ursula (January 18, 2022). "Texas Primary Will Be Progressives' 2022 'Testing Ground' . The Daily Beast . Retrieved January 18, 2022 . ↑ Cisneros, Jessica [@JCisnerosTX] (January 10, 2022). "I am so proud to have the endorsement of former #TX28 Congressman Ciro Rodirguez. He knows what's at stake with this election and, like me, believes it's time for South Texas families to have the representation they deserve in Congress. https://t.co/TP8uD8diIY" (Tweet ). Archived from the original on May 24, 2022. Retrieved December 28, 2022 – via Twitter . 1 2 Ramirez, Fernando (September 30, 2021). "Working Families Party Endorses Jessica Cisneros" . The Texas Signal . Retrieved October 5, 2021 . ↑ "TEXAS PRIMARY ELECTION RESULTS" . March 3, 2022. Archived from the original on May 20, 2022. Retrieved May 23, 2022 . ↑ "List of 2022 Texas candidates endorsed by the CWA" . Retrieved May 23, 2022 . ↑ "SEIU Phonebank event link for Jessica Cisneros" . Retrieved May 23, 2022 . ↑ "Endorsements" . UFW . Retrieved May 19, 2022 . ↑ "Common Defense Endorses Jessica Cisneros" . May 6, 2022. Archived from the original on May 26, 2022. Retrieved May 23, 2022 . ↑ "DFA Backs Jessica Cisneros in TX-28 rematch" . Democracy for America . September 22, 2021. Retrieved November 16, 2021 . ↑ Scherer, Jasper (December 7, 2021). "EMILY's List endorses Jessica Cisneros in Democratic primary against U.S. Rep. Henry Cuellar of Laredo" . San Antonio Express-News . Retrieved December 7, 2021 . ↑ Corbett, Jessica (November 9, 2021). "Indivisible Announces First 2022 Endorsements to Boost Power of Democrats' Left Flank" . Common Dreams . Retrieved November 11, 2021 . ↑ Kassel, Matthew (December 23, 2021). "J Street endorses Jessica Cisneros in TX-28 House primary" . Jewish Insider . Retrieved December 23, 2021 . ↑ King, Maya (August 5, 2021). "Jessica Cisneros launches primary rematch against Rep. Henry Cuellar" . Politico . Retrieved October 5, 2021 . ↑ "LCV Action Fund Endorses Jessica Cisneros for Congress" . www.lcv.org . March 16, 2022. ↑ "Let's send Jessica Cisneros and Michelle Vallejo to congress, and win the representation and democracy we deserve in South Texas" . Facebook . February 18, 2022. Retrieved May 23, 2022 . ↑ "2022 candidates endorsed by MoveOn" . Retrieved May 23, 2022 . ↑ Corbett, Jessica (September 15, 2021). "With Texas at Center of Abortion Fight, NARAL Backs Cisneros Over Cuellar for 2022" . Common Dreams . Retrieved October 5, 2021 . ↑ "NNU National Endorsements" . March 9, 2018. Retrieved May 23, 2022 . 1 2 3 "Endorsements" . ↑ Schwartz, Brian (January 27, 2022). "Progressive millionaires back primary challenges against centrist House Democrats Cuellar and Bourdeaux" . CNBC . Retrieved January 27, 2022 . ↑ "2022 candidates endorsed by Peace Action" . Archived from the original on March 20, 2020. Retrieved May 23, 2022 . ↑ McGill Johnson, Alexis [@alexismcgill] (November 23, 2021). "With abortion access under attack across the country, it's essential we strengthen our sexual and reproductive health majority in the House in 2022. That's why @PPact is proud to endorse @JCisnerosTX for #TX28 once again — she's the voice that people in South Texas need. https://t.co/GrII6Uj9D9" (Tweet ). Archived from the original on November 30, 2021. Retrieved December 28, 2022 – via Twitter . ↑ "PDA Endorses Jessica Cisneros for Congress in TX-28" . www.pdamerica.org . January 13, 2022. Retrieved January 23, 2022 . ↑ "2022 candidates endorse by the Progressive Turnout Project" . Retrieved May 23, 2022 . ↑ Manchester, Julia (November 18, 2021). "Sunrise Movement endorses Jessica Cisneros in primary against Cuellar" . The Hill . Retrieved November 18, 2021 . ↑ "TOP PAC Endorses Jessica Cisneros (TX-28) For Congress" . January 24, 2022. Retrieved May 23, 2022 . ↑ "We endorse the best" . Retrieved May 23, 2022 . ↑ "Daily Kos congratulates Jessica Cisneros on progressing to runoff in TX-28 primary" . dailykos.com . March 2, 2022. Retrieved May 23, 2022 . 1 2 Express-News Editorial Board (January 24, 2022). "Editorial: Cisneros and Vasquez Ng best in CD 28" . San Antonio Express-News . Retrieved January 24, 2022 . ↑ Aguirre, Priscilla (May 24, 2022). " . mySA . Retrieved May 25, 2022 . ↑ "House leaders stick with Rep. Cuellar despite abortion stand" . Associated Press . May 4, 2022. ↑ Sammon, Alexander (January 27, 2022). "Will the Establishment Try to Save Henry Cuellar in Texas?" . Retrieved February 15, 2022 . ↑ Brooks, Emily (March 23, 2022). "Pelosi backs Cuellar, says 'I don't know what it is' of FBI raid" . The Hill . Retrieved April 15, 2022 . ↑ Democrats for Life [@demsforlife] (May 23, 2022). "These four pro-life Democrats are the voices we need in Alabama, Arkansas, and Congress. GO OUT AND VOTE TOMORROW!!! https://t.co/EajjT9mOhN" (Tweet ). Archived from the original on May 23, 2022. Retrieved December 28, 2022 – via Twitter . ↑ "International Franchise Association Announces 2022 Congressional Endorsements" . www.franchise.org . International Franchise Association . April 28, 2022. Retrieved April 30, 2022 . ↑ Cuellar, Henry [@CuellarCampaign] (December 30, 2021). "I am proud to announce my endorsement from the Texas Farm Bureau AGFUND! I'm committed to protecting and fighting for Texas farmers, ranchers, and property owners - while ensuring that Americans receive safe, domestically grown sources of food. https://t.co/gnxzaHq9tS" (Tweet ). Archived from the original on March 2, 2022. Retrieved December 28, 2022 – via Twitter . ↑ RMG Research ↑ Jessica Cisneros files for recount in race against Rep. Henry Cuellar in Texas' 28th District , CBS News , Aaron Navarro, June 7, 2022. Retrieved June 8, 2022. ↑ "Texas Democratic Party Announces Unofficial Results of Recount in CD-28 Primary" . June 21, 2022. Archived from the original on June 21, 2022. Retrieved June 22, 2022 . ↑ Vela, Jorge (August 16, 2021). "Whitten announces candidacy against Cuellar" . www.lmtonline.com . LMT online. Retrieved September 2, 2021 . ↑ Vela, Jorge A. (October 25, 2021). "2nd Republican in Cabrera enters race for Congress" . Laredo Morning Times . Retrieved October 25, 2021 . ↑ "Lt Col Steven Fowler, Decorated Combat Veteran, Announces Republican Candidacy in TX-28" . www.durangoherald.com . The Durango Herald . Retrieved October 19, 2021 . ↑ Murray, Stephanie (November 15, 2021). "The 3 senators still on retirement watch" . Politico . Retrieved November 15, 2021 . 1 2 Livingston, Abby; Svitek, Patrick (January 22, 2022). "FBI raid portends political and legal challenges for U.S. Rep. Henry Cuellar" . The Texas Tribune . Retrieved January 22, 2022 . 1 2 @newsmax (October 23, 2022). "Donald Trump praises the Latino community in Texas & honors their leaders, including Cassy Garcia (@CasandraLGarcia..." (Tweet ) – via Twitter . 1 2 Bowman, Bridget (October 9, 2019). "Texas Democrat Eddie Bernice Johnson says she'll run for one final term" . Roll Call . 1 2 Svitek, Patrick (November 24, 2021). "Freshman state Rep. Jasmine Crockett is running for Dallas congressional seat, with Eddie Bernice Johnson's backing" . Texas Tribune . Retrieved November 24, 2021 . 1 2 3 Jeffers, Gromer Jr. (November 22, 2021). "Dallas Mayor Eric Johnson won't run for Congress to replace Eddie Bernice Johnson" . The Dallas Morning News . Retrieved November 22, 2021 . 1 2 3 Jeffers, Gromer Jr. (December 10, 2021). "Filing ends today for March 1 primary that will test Texas GOP, local Democratic Party incumbents" . Dallas Morning News . Retrieved December 13, 2021 . ↑ Nash, Tammye (December 13, 2021). " . www.dallasvoice.com . Dallas Voice . Retrieved December 13, 2021 . ↑ Monacelli, Steven (April 5, 2021). "Jessica Mason Offers a New Deal for Dallas" . Dallas Weekly . Archived from the original on April 14, 2021. Retrieved April 14, 2021 . ↑ Caldwell, Emily (October 26, 2021). "Dallas-based attorney Abel Mulugheta announces candidacy for Eddie Bernice Johnson's District 30" . The Dallas Morning News . Retrieved October 26, 2021 . ↑ Jeffers, Gregory Jr. (March 1, 2022). "Jasmine Crockett leading in race to replace Eddie Bernice Johnson in Congress" . The Dallas Morning News . Retrieved March 2, 2022 . ↑ "Giffords PAC Endorses Slate of Gun Safety House Challengers" . Giffords . August 12, 2022. Retrieved August 19, 2022 . ↑ Ramirez, Fernando (January 19, 2022). "Working Families Party endorses Jasmine Crockett for Texas' 30th Congressional District" . Texas Signal . Retrieved January 31, 2022 . 1 2 "Our recommendation in the Democratic primary for U.S. House District 30" . The Dallas Morning News . January 30, 2022. Retrieved January 31, 2022 . 1 2 3 Livingston, Abby (January 25, 2022). "Retiring U.S. Rep. Eddie Bernice Johnson looms large in crowded race to replace her" . Texas Tribune . Retrieved January 31, 2022 . ↑ Kassel, Matthew (January 31, 2022). "DMFI PAC announces first slate of House endorsements" . Jewish Insider . Retrieved January 31, 2022 . ↑ Jessica Mason, MPA [@JessicaMasonTX] (February 17, 2022). "I am proud to receive the endorsement of Congressman @sethmoulton and @serve_america. Congressman Moulton is a leader in the fight for a more just and fairer America,& it would be an honor to work alongside him to move the needle on the issues that matter to everyday Americans. https://t.co/4s8C0zXXdW" (Tweet ). Archived from the original on February 20, 2022. Retrieved December 28, 2022 – via Twitter . ↑ Kennedy, Kaitlyn (December 26, 2021). "Texas Primaries: Progressive Candidates to watch out for" . TAG 24 . Retrieved December 29, 2021 . ↑ "Marianne Williamson's Candidate Summit" . Candidate Summit . Retrieved October 28, 2021 . ↑ DSA North Texas [@DSA_NorthTexas] (June 2, 2021). "We are happy to announce our first endorsement as a chapter! @JessicaMasonTX! https://t.co/OeyWmM9u8p" (Tweet ). Archived from the original on March 3, 2022. Retrieved December 28, 2022 – via Twitter . ↑ "Endorsement: Jessica Mason for Congress (TX-30)" . New Politics . December 14, 2021. Retrieved January 19, 2022 . ↑ VoteVets [@votevets] (December 16, 2021). "VoteVets Endorses @JessicaMasonTX For Congress #TX30 Read more: https://t.co/bCCSwMMwII https://t.co/PJaOsvJH8z" (Tweet ). Archived from the original on December 18, 2021. Retrieved December 28, 2022 – via Twitter . ↑ Lester & Associates (D) ↑ Aleman, Christian (November 13, 2021). "John Carter files for reelection in Texas' new 31st Congressional District" . KVUE . Retrieved November 20, 2021 . ↑ "Giffords Endorses Slate of Majority Makers Running for the US House" . www.giffords.org . Giffords . April 21, 2022. ↑ "U.S. Chamber Endorses Congressman Colin Allred for Texas' 32nd Congressional District" . United States Chamber of Commerce . October 4, 2022. Retrieved June 28, 2023 . ↑ "Endorsements ⋆ Brad Namdar for Congress" . ↑ "Endorsement by Former Texas Governor Rick Perry!" . February 23, 2022. 1 2 Nichols, Hans (March 22, 2021). "Rep. Filemon Vela to retire from House ahead of Texas redistricting" . Axios . Retrieved March 22, 2021 . ↑ "South Texas emerges as political hotbed after Democrats underperformed there in 2020" . The Texas Tribune . March 26, 2021. Retrieved April 6, 2021 . ↑ "House Dems head off retirement crisis - for now" . Politico . June 26, 2021. Retrieved June 29, 2021 . ↑ Gonzalez, Valerie (July 12, 2021). "Civil rights lawyer, Brownsville native announces Democratic congressional bid" . The Monitor . Archived from the original on July 12, 2021. Retrieved July 14, 2021 . ↑ Svitek, Patrick (November 1, 2021). "Former ACLU lawyer Rochelle Garza decides to run for attorney general after redistricting upends congressional campaign" . The Texas Tribune . Archived from the original on November 1, 2021. Retrieved November 1, 2021 . 1 2 Montoya, Luis (October 27, 2021). "Vela endorses Gonzalez as his successor in CD 34" . Rio Grande Guardian . Retrieved January 21, 2022 . ↑ "Governor Greg Abbott Endorses Mayra Flores for Congressional District 34" . April 8, 2022. ↑ Cruz, Ted [@tedcruz] (August 4, 2022). "I'm proud to support rockstars like @casandralgarcia, @MayraFlores2022, @monica4congress, & @yestoyesli! The Hispanic community is fed up with Biden's out of control open borders & the train wreck the Democrats' socialist agenda has been— food & gas prices are through the roof! https://t.co/zkV4kPNgD0" (Tweet ). Archived from the original on August 14, 2022. Retrieved December 28, 2022 – via Twitter . ↑ RMG Research 1 2 3 4 Cobler, Nicole (October 18, 2021). "U.S. Rep. Lloyd Doggett poised to run in proposed Austin district" . Axios . 1 2 3 4 5 6 7 Gates, Billy (October 19, 2021). "Austin City Council Member Greg Casar gathers multi-county committee to decide on run for Congress" . KXAN-TV . Retrieved October 30, 2021 . ↑ Becerra, Stephanie (November 10, 2021). "State Rep. Eddie Rodriguez running for Congress District 35, joins race against Casar" . CBS Austin . Retrieved November 11, 2021 . ↑ Girgis, Lauren (November 10, 2021). "State Rep. Eddie Rodriguez throws hat in race for Texas' 35th Congressional District" . Austin American-Statesman . Retrieved November 11, 2021 . ↑ Brnger, Garrett; Moreno, Julie (December 10, 2021). "Former San Antonio councilwoman makes it official — she's running for Congress" . KSAT . Retrieved December 24, 2021 . ↑ Nowlin, Sanford (February 14, 2022). "Bernie Sanders backs progressives Casar and Cisneros in their bids for San Antonio House seats" . San Antonio Current . Archived from the original on February 14, 2022. Retrieved February 14, 2022 . ↑ DuPree, Will (January 26, 2022). "Greg Casar scores Elizabeth Warren endorsement for Congressional run" . KXAN . Retrieved January 31, 2022 . ↑ Digital Team (January 4, 2022). "Texas U.S. Rep. Sylvia Garcia endorses Greg Casar for Congress" . Fox 7 Austin . ↑ Chavez, Aida (February 23, 2022). "Progressive Democrats Are Gaining Ground in Texas" . The Nation . ↑ Marans, Daniel (February 23, 2022). "Why Texas Progressive Greg Casar Gives Hope To The Embattled Left" . Huffington Post . Retrieved February 25, 2022 . ↑ DuPree, Will (January 31, 2022). "Rep. Alexandria Ocasio-Cortez announces she's endorsing Greg Casar for Congress" . KXAN . Retrieved January 31, 2022 . 1 2 Rod, Marc (December 22, 2021). "Democratic Socialist claims early lead in Texas' 35th Congressional District" . Jewish Insider . Retrieved December 24, 2021 . 1 2 3 Salinas, Benjamin (December 8, 2021). "San Antonio and Austin Labor Unions Back Casar in TX-35" . Texas Signal . Retrieved December 21, 2021 . ↑ Austin DSA [@austin_DSA] (January 6, 2022). "Our opponents have big money and corporate PACs, but we've got people power. Make a small donation now to support our democratic socialist slate! https://t.co/aUItIgbETT https://t.co/vJwWxcRND3" (Tweet ). Archived from the original on January 16, 2022. Retrieved December 28, 2022 – via Twitter . ↑ Ramirez, Fernando (February 17, 2022). "End Citizens United/Let America Vote Backs Casar for Congress" . Texas Signal . Retrieved February 18, 2022 . ↑ "Endorsed Candidates" . indivisible.org . Indivisible . September 21, 2018. Retrieved May 20, 2022 . ↑ "Our Candidates Are Pledging to Fight" . Justice Democrats . 2021. Retrieved December 22, 2021 . ↑ Ramirez, Fernando (February 11, 2022). "Latino Victory Fund endorses Jessica Cisneros, Greg Casar" . Texas Signal . Retrieved February 14, 2022 . ↑ "Greg Casar Earns LCV Action Fund Endorsement for Texas' 35th Congressional District" . www.lcv.org . League of Conservation Voters . May 11, 2022. Retrieved May 31, 2022 . 1 2 "ENDORSEMENTS" . Progressive Democrats of America. February 21, 2021. Archived from the original on November 27, 2022. Retrieved June 25, 2022 . ↑ "Sunrise Endorses Greg Casar for TX-35" (Press release) . Common Dreams . The Progressive Newswire. January 18, 2022. Retrieved January 18, 2022 . ↑ Nichols, John (November 5, 2021). "Texas Progressive Greg Casar Is Organizing to Win in 2022" . The Nation . Retrieved November 11, 2021 . ↑ San Antonio Express-News Editorial Board (January 31, 2022). "Editorial: Casar best for Democratic CD 35 primary" . San Antonio Express-News . Retrieved February 27, 2022 . 1 2 3 4 5 6 Sanders, Austin (February 4, 2022). "Greg Casar and Eddie Rodriguez Fight for the Progressive Mantle in TX-35" . Austin Chronicle . Retrieved February 4, 2022 . 1 2 3 4 5 Mekelburg, Madlin. "Greg Casar, Eddie Rodriguez vying for progressive vote in 35th Congressional District" . Austin American-Statesman . 1 2 3 4 5 Johnson, Brad (November 10, 2021). "State Rep. Eddie Rodriguez to Run for Congress, Not Seek Re-Election to Texas House" . The Texan . Retrieved November 11, 2021 . ↑ Partain, Claire (November 11, 2021). "State Rep. Eddie Rodriguez challenges Casar in District 35 congressional race" . Austonia . Archived from the original on November 10, 2021. Retrieved November 11, 2021 . ↑ American-Statesman Editorial Board (February 24, 2022). "Editorial: In House District 35, we recommend Rodriguez for Dems, Sundt for GOP" . Austin American-Statesman . Retrieved February 27, 2022 . ↑ Public Policy Polling (D) ↑ Lake Research Partners (D) ↑ Lake Research Partners (D) [ permanent dead link ] ↑ Stewart, Steve W (November 18, 2021). "Babin seeking re-election" . KJAS . Retrieved November 18, 2021 . ↑ "Haire announces run for Texas U.S. Congressional District 36" . December 16, 2021. Retrieved December 17, 2021 . ↑ Ramirez, Fernando (November 29, 2021). "Donna Imam announces run against Rep. Lloyd Doggett" . www.texassignal.com . Texas Signal. Retrieved November 29, 2021 . 1 2 3 4 5 6 Svitek, Patrick (January 26, 2022). "Frontrunners for Texas' new congressional seats look to send message with decisive primary wins" . Texas Tribune . Retrieved January 31, 2022 . 1 2 Svitek, Patrick; Livingstonn, Abby (October 18, 2021). "Longtime U.S. Rep. Lloyd Doggett will run in the Austin area's new congressional district" . Texas Tribune . Retrieved November 30, 2021 . ↑ Svitek, Patrick (September 28, 2021). "Proposed new congressional seat in Houston gets prominent GOP candidate" . Texas Tribune . ↑ Moore Information Group (R) ↑ "Accomplished Veterans Endorsed by SEAL PAC" . SEAL PAC . Retrieved May 5, 2022 . ↑ "Joel Dejean: Independent for Congress 38th District of Texas" . Joel Dejean for Congress . Archived from the original on March 2, 2022. Retrieved March 2, 2022 . External links Official campaign websites for 1st district candidates
Official campaign websites for 2nd district candidates
Official campaign websites for 3rd district candidates
Official campaign websites for 4th district candidates
Official campaign websites for 5th district candidates
Official campaign websites for 6th district candidates
Official campaign websites for 7th district candidates
Official campaign websites for 8th district candidates
Official campaign websites for 9th district candidates
Official campaign websites for 10th district candidates
Official campaign websites for 11th district candidates
Official campaign websites for 12th district candidates
Official campaign websites for 13th district candidates
Official campaign websites for 14th district candidates
Official campaign websites for 15th district candidates
Official campaign websites for 16th district candidates
Official campaign websites for 17th district candidates
Official campaign websites for 18th district candidates
Official campaign websites for 19th district candidates
Official campaign websites for 20th district candidates
Official campaign websites for 21st district candidates
Official campaign websites for 22nd district candidates
Official campaign websites for 23rd district candidates
Official campaign websites for 24th district candidates
Official campaign websites for 26th district candidates
Official campaign websites for 27th district candidates
Official campaign websites for 28th district candidates
Official campaign websites for 29th district candidates
Official campaign websites for 30th district candidates
Official campaign websites for 32nd district candidates
Official campaign websites for 34th district candidates
Official campaign websites for 35th district candidates
Official campaign websites for 37th district candidates
Official campaign websites for 38th district candidates
U.S. U.S. (election ) Governors Attorneys Secretaries State Other Alabama Arizona Arkansas California Colorado Connecticut Florida Georgia Illinois Indiana Massachusetts Minnesota Missouri Nevada New Hampshire New Mexico North Carolina Ohio Oklahoma Oregon Texas Vermont State Alabama Alaska Arizona Arkansas California Colorado Connecticut Delaware Florida Georgia Hawaii Idaho Illinois Indiana Iowa Kansas Kentucky Maine Maryland Massachusetts Michigan Minnesota Missouri Montana Nebraska Nevada New Hampshire New Mexico New York North Carolina North Dakota Ohio Oklahoma Oregon Pennsylvania Rhode Island South Carolina South Dakota Tennessee Texas Utah Vermont Washington West Virginia Wisconsin Wyoming Mayors Anaheim, CA Auburn, AL Augusta, GA Austin, TX Belleveue, NE Charlotte, NC Columbia, MO Denton, TX Flint, MI Gainesville, FL Grand Island, NE Greensboro, NC Henderson, NV Irvine, CA Laredo, TX Lexington, KY Little Rock, AR Long Beach, CA Los Angeles, CA Louisville, KY Lubbock, TX Milwaukee, WI (special) Newark, NJ Newport News, VA North Las Vegas, NV Oakland, CA Oklahoma City, OK Pensacola, FL Providence, RI Raleigh, NC Reno, NV San Bernardino, CA San Jose, CA Santa Ana, CA Sioux Falls, SD Shreveport, LA Tallahassee, FL Washington, DC Local Anne Arundel County, MD Baltimore County, MD Champaign County, IL Cook County, IL Cuyahoga County, OH District of Columbia, DC Frederick County, MD Harford County, MD Hennepin County, MN Howard County, MD Jackson County, MO Jefferson County, MO Kenosha County, WI Los Angeles, CA Los Angeles County, CA Macomb County, MI Maricopa County, AZ Montgomery County, MD Navajo Nation Orange County, CA Orange County, FL Philadelphia, PA Portland, OR Prince George's County, MD San Diego, CA San Francisco, CA St. Charles County, MO St. Louis County, MO Shelby County, TN Tulsa, OK Wayne County, MI Wicomico County, MD Statewide Other
This page is based on this
Wikipedia article Text is available under the
CC BY-SA 4.0 license; additional terms may apply.
Images, videos and audio are available under their respective licenses.


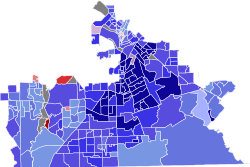


