| ||||||||||||||||||||||||||||||||||
All 150 seats in the Texas House of Representatives 76 seats needed for a majority | ||||||||||||||||||||||||||||||||||
---|---|---|---|---|---|---|---|---|---|---|---|---|---|---|---|---|---|---|---|---|---|---|---|---|---|---|---|---|---|---|---|---|---|---|
| ||||||||||||||||||||||||||||||||||
Republican hold Republican gain Democratic hold Republican: 50–60% 60–70% 70–80% 80–90% ≥90% ContentsDemocratic: 50–60% 60–70% 70–80% 80–90% ≥90% | ||||||||||||||||||||||||||||||||||
|
Elections in Texas |
---|
Government |
The 2014 Texas House of Representatives elections took place as part of the biennial United States elections. Texas voters elected state representatives in all 150 State House of Representatives districts. The winners of this election served in the 84th Texas Legislature. State representatives serve for two-year terms.
At the beginning of the Eighty-third Texas Legislature following the 2012 Texas State House of Representatives elections, the Democrats held 55 seats to the Republicans' 95.
This election marks the first time Republicans have ever won a state house race in Chambers County. [1]
Party | Candi- dates | Votes | % | Seats | +/– | |||||||||
---|---|---|---|---|---|---|---|---|---|---|---|---|---|---|
Republican Party | 107 | 2,589,656 | 63.70% | 98 | 3 | |||||||||
Democratic Party | 90 | 1,305,080 | 32.10% | 52 | 3 | |||||||||
Libertarian Party | 39 | 153,750 | 3.78% | 0 | – | |||||||||
Green Party | 6 | 13,536 | 0.33% | 0 | – | |||||||||
Independent | 1 | 3,166 | 0.07% | 0 | – | |||||||||
Write-in | 1 | 165 | 0.00% | 0 | – | |||||||||
Total | 4,065,262 | 100.00% | 150 | – |
This election marked a low point in seat competitiveness for the Texas House of Representatives. 69% of seats only drew candidates from only one major political party, and 45% of seats hosted unopposed races. Only 8% of seats featured more than two political parties, and only 4 races were decided by margins under 10%.
District | Democratic | Republican | Others | Total | Result | ||||
---|---|---|---|---|---|---|---|---|---|
Votes | % | Votes | % | Votes | % | Votes | % | ||
District 1 | - | - | 29,585 | 100.00% | - | - | 29,585 | 100.00% | Republican Hold |
District 2 | - | - | 28,847 | 100.00% | - | - | 28,847 | 100.00% | Republican Hold |
District 3 | - | - | 28,760 | 91.08% | 2,818 | 8.92% | 31,578 | 100.00% | Republican Hold |
District 4 | - | - | 26,660 | 89.13% | 3,253 | 10.87% | 29,913 | 100.00% | Republican Hold |
District 5 | - | - | 30,779 | 92.34% | 2,552 | 7.66% | 33,331 | 100.00% | Republican Hold |
District 6 | - | - | 26,684 | 87.84% | 3,695 | 12.16% | 30,379 | 100.00% | Republican Hold |
District 7 | - | - | 25,342 | 100.00% | - | - | 25,342 | 100.00% | Republican Hold |
District 8 | - | - | 25,897 | 87.85% | 3,581 | 12.15% | 29,478 | 100.00% | Republican Hold |
District 9 | - | - | 29,412 | 100.00% | - | - | 29,412 | 100.00% | Republican Hold |
District 10 | - | - | 27,319 | 100.00% | - | - | 27,319 | 100.00% | Republican Hold |
District 11 | - | - | 25,980 | 100.00% | - | - | 25,980 | 100.00% | Republican Hold |
District 12 | - | - | 22,617 | 100.00% | - | - | 22,617 | 100.00% | Republican Hold |
District 13 | - | - | 35,589 | 100.00% | - | - | 35,589 | 100.00% | Republican Hold |
District 14 | 6,358 | 28.49% | 15,193 | 68.08% | 765 | 3.43% | 22,316 | 100.00% | Republican Hold |
District 15 | - | - | 36,260 | 100.00% | - | - | 36,260 | 100.00% | Republican Hold |
District 16 | 4,748 | 13.66% | 29,132 | 83.79% | 887 | 2.55% | 34,767 | 100.00% | Republican Hold |
District 17 | 12,459 | 35.40% | 22,737 | 64.60% | - | - | 35,196 | 100.00% | Republican Hold |
District 18 | - | - | 23,808 | 100.00% | - | - | 23,808 | 100.00% | Republican Hold |
District 19 | - | - | 30,543 | 100.00% | - | - | 30,543 | 100.00% | Republican Hold |
District 20 | 10,883 | 22.73% | 35,110 | 73.33% | 1,884 | 3.94% | 47,877 | 100.00% | Republican Hold |
District 21 | 9,739 | 25.61% | 28,283 | 74.39% | 38,022 | 100.00% | Republican Hold | ||
District 22 | 24,203 | 100.00% | - | - | - | - | 24,203 | 100.00% | Democratic Hold |
District 23 | 14,763 | 45.36% | 17,184 | 54.64% | - | - | 32,547 | 100.00% | Republican GAIN |
District 24 | - | - | 31,757 | 100.00% | - | - | 31,757 | 100.00% | Republican Hold |
District 25 | - | - | 25,927 | 100.00% | - | - | 25,927 | 100.00% | Republican Hold |
District 26 | 11,080 | 30.32% | 25,458 | 69.68% | - | - | 36,538 | 100.00% | Republican Hold |
District 27 | 24,326 | 66.98% | 11,990 | 33.02% | - | - | 36,316 | 100.00% | Democratic Hold |
District 28 | - | - | 30,122 | 100.00% | - | - | 30,122 | 100.00% | Republican Hold |
District 29 | - | - | 25,777 | 100.00% | - | - | 25,777 | 100.00% | Republican Hold |
District 30 | - | - | 28,224 | 100.00% | - | - | 28,224 | 100.00% | Republican Hold |
District 31 | 16,396 | 100.00% | - | - | - | - | 16,396 | 100.00% | Democratic Hold |
District 32 | - | - | 23,348 | 100.00% | - | - | 23,348 | 100.00% | Republican Hold |
District 33 | - | - | 32,013 | 100.00% | - | - | 32,013 | 100.00% | Republican Hold |
District 34 | 16,241 | 100.00% | - | - | - | - | 16,241 | 100.00% | Democratic Hold |
District 35 | 11,431 | 100.00% | - | - | - | - | 11,431 | 100.00% | Democratic Hold |
District 36 | 12,055 | 100.00% | - | - | - | - | 12,055 | 100.00% | Democratic Hold |
District 37 | 10,504 | 100.00% | - | - | - | - | 10,504 | 100.00% | Democratic Hold |
District 38 | 11,718 | 100.00% | - | - | - | - | 11,718 | 100.00% | Democratic Hold |
District 39 | 14,409 | 100.00% | - | - | - | - | 14,409 | 100.00% | Democratic Hold |
District 40 | 11,998 | 100.00% | - | - | - | - | 11,998 | 100.00% | Democratic Hold |
District 41 | 11,532 | 57.46% | 8,539 | 42.54% | - | - | 20,071 | 100.00% | Democratic Hold |
District 42 | 16,103 | 88.44% | - | - | 2,104 | 11.56% | 18,207 | 100.00% | Democratic Hold |
District 43 | 10,869 | 38.59% | 17,294 | 61.41% | - | - | 28,163 | 100.00% | Republican Hold |
District 44 | 9,821 | 24.32% | 30,558 | 75.68% | - | - | 40,379 | 100.00% | Republican Hold |
District 45 | - | - | 25,739 | 72.64% | 9,696 | 27.36% | 35,435 | 100.00% | Republican Hold |
District 46 | 23,959 | 84.03% | - | - | 4,552 | 15.97% | 28,511 | 100.00% | Democratic Hold |
District 47 | - | - | 37,455 | 73.04% | 13,822 | 26.96% | 51,277 | 100.00% | Republican Hold |
District 48 | 39,668 | 78.10% | - | - | 11,126 | 21.90% | 50,794 | 100.00% | Democratic Hold |
District 49 | 38,548 | 85.08% | - | - | 6,759 | 14.92% | 45,307 | 100.00% | Democratic Hold |
District 50 | 22,690 | 58.68% | 14,359 | 37.13% | 1,620 | 4.19% | 38,669 | 100.00% | Democratic Hold |
District 51 | 21,467 | 87.36% | - | - | 3,105 | 12.64% | 24,572 | 100.00% | Democratic Hold |
District 52 | 12,452 | 38.53% | 18,235 | 56.42% | 1,633 | 5.05% | 32,320 | 100.00% | Republican Hold |
District 53 | - | - | 36,878 | 89.91% | 4,139 | 10.09% | 41,017 | 100.00% | Republican Hold |
District 54 | - | - | 17,190 | 100.00% | - | - | 17,190 | 100.00% | Republican Hold |
District 55 | - | - | 18,278 | 100.00% | - | - | 18,278 | 100.00% | Republican Hold |
District 56 | - | - | 25,654 | 83.35% | 5,125 | 16.65% | 30,779 | 100.00% | Republican Hold |
District 57 | - | - | 28,174 | 100.00% | - | - | 28,174 | 100.00% | Republican Hold |
District 58 | 6,532 | 19.56% | 26,866 | 80.44% | - | - | 33,398 | 100.00% | Republican Hold |
District 59 | - | - | 22,586 | 100.00% | - | - | 22,586 | 100.00% | Republican Hold |
District 60 | - | - | 33,878 | 100.00% | - | - | 33,878 | 100.00% | Republican Hold |
District 61 | 7,458 | 16.96% | 36,504 | 83.04% | - | - | 43,962 | 100.00% | Republican Hold |
District 62 | - | - | 24,501 | 100.00% | - | - | 24,501 | 100.00% | Republican Hold |
District 63 | 9,026 | 22.66% | 30,809 | 77.34% | - | - | 39,835 | 100.00% | Republican Hold |
District 64 | 12,611 | 33.77% | 23,674 | 63.39% | 1,059 | 2.84% | 37,344 | 100.00% | Republican Hold |
District 65 | 10,440 | 35.69% | 18,812 | 64.31% | - | - | 29,252 | 100.00% | Republican Hold |
District 66 | - | - | 24,751 | 100.00% | - | - | 24,751 | 100.00% | Republican Hold |
District 67 | - | - | 25,432 | 78.56% | 6,941 | 21.44% | 32,373 | 100.00% | Republican Hold |
District 68 | - | - | 30,979 | 100.00% | - | - | 30,979 | 100.00% | Republican Hold |
District 69 | - | - | 22,822 | 100.00% | - | - | 22,822 | 100.00% | Republican Hold |
District 70 | - | - | 29,534 | 100.00% | - | - | 29,534 | 100.00% | Republican Hold |
District 71 | - | - | 22,950 | 100.00% | - | - | 22,950 | 100.00% | Republican Hold |
District 72 | - | - | 24,364 | 100.00% | - | - | 24,364 | 100.00% | Republican Hold |
District 73 | - | - | 46,194 | 100.00% | - | - | 46,194 | 100.00% | Republican Hold |
District 74 | 15,968 | 100.00% | - | - | - | - | 15,968 | 100.00% | Democratic Hold |
District 75 | 8,453 | 100.00% | - | - | - | - | 8,453 | 100.00% | Democratic Hold |
District 76 | 11,923 | 87.09% | - | - | 1,767 | 12.91% | 13,690 | 100.00% | Democratic Hold |
District 77 | 11,324 | 78.15% | - | - | 3,166 | 21.85% | 14,490 | 100.00% | Democratic Hold |
District 78 | 12,880 | 100.00% | - | - | - | - | 12,880 | 100.00% | Democratic Hold |
District 79 | 12,001 | 100.00% | - | - | - | - | 12,001 | 100.00% | Democratic Hold |
District 80 | 14,981 | 89.61% | - | - | 1,737 | 10.39% | 16,718 | 100.00% | Democratic Hold |
District 81 | - | - | 17,006 | 99.04% | 165 | 0.96% | 17,171 | 100.00% | Republican Hold |
District 82 | - | - | 24,262 | 100.00% | - | - | 24,262 | 100.00% | Republican Hold |
District 83 | 6,231 | 18.78% | 26,950 | 81.22% | - | - | 33,181 | 100.00% | Republican Hold |
District 84 | 6,347 | 27.29% | 16,913 | 72.71% | - | - | 23,260 | 100.00% | Republican Hold |
District 85 | 9,630 | 33.39% | 19,215 | 66.61% | - | - | 28,845 | 100.00% | Republican Hold |
District 86 | - | - | 31,589 | 100.00% | - | - | 31,589 | 100.00% | Republican Hold |
District 87 | 3,664 | 15.67% | 19,714 | 84.33% | - | - | 23,378 | 100.00% | Republican Hold |
District 88 | - | - | 22,578 | 93.17% | 1,654 | 6.83% | 24,232 | 100.00% | Republican Hold |
District 89 | 11,154 | 28.39% | 28,135 | 71.61% | - | - | 39,289 | 100.00% | Republican Hold |
District 90 | 9,909 | 100.00% | - | - | - | - | 9,909 | 100.00% | Democratic Hold |
District 91 | 9,349 | 28.18% | 22,802 | 68.74% | 1,021 | 3.08% | 33,172 | 100.00% | Republican Hold |
District 92 | 12,567 | 36.38% | 21,976 | 63.62% | - | - | 34,543 | 100.00% | Republican Hold |
District 93 | - | - | 20,433 | 100.00% | - | - | 20,433 | 100.00% | Republican Hold |
District 94 | 16,481 | 40.49% | 23,046 | 56.63% | 1,172 | 2.88% | 40,699 | 100.00% | Republican Hold |
District 95 | 21,908 | 75.78% | 7,002 | 24.22% | - | - | 28,910 | 100.00% | Democratic Hold |
District 96 | - | - | 22,822 | 80.75% | 5,442 | 19.25% | 28,264 | 100.00% | Republican Hold |
District 97 | - | - | 27,977 | 81.63% | 6,295 | 18.37% | 24,272 | 100.00% | Republican Hold |
District 98 | - | - | 39,407 | 100.00% | - | - | 39,407 | 100.00% | Republican Hold |
District 99 | - | - | 26,144 | 100.00% | - | - | 26,144 | 100.00% | Republican Hold |
District 100 | 17,209 | 89.97% | - | - | 1,919 | 10.03% | 19,128 | 100.00% | Democratic Hold |
District 101 | 14,926 | 84.59% | - | - | 2,270 | 15.41% | 17,646 | 100.00% | Democratic Hold |
District 102 | 12,243 | 37.51% | 20,394 | 62.49% | - | - | 32,637 | 100.00% | Republican Hold |
District 103 | 12,190 | 100.00% | - | - | - | - | 12,190 | 100.00% | Democratic Hold |
District 104 | 9,765 | 100.00% | - | - | - | - | 9,765 | 100.00% | Democratic Hold |
District 105 | 10,478 | 42.72% | 13,600 | 55.45% | 449 | 1.83% | 24,527 | 100.00% | Republican Hold |
District 106 | 9,614 | 27.53% | 24,419 | 69.93% | 886 | 2.54% | 34,919 | 100.00% | Republican Hold |
District 107 | 13,807 | 44.98% | 16,891 | 55.02% | - | - | 30,683 | 100.00% | Republican Hold |
District 108 | 16,182 | 39.32% | 24,973 | 60.68% | - | - | 41,155 | 100.00% | Republican Hold |
District 109 | 31,504 | 100.00% | - | - | - | - | 31,504 | 100.00% | Democratic Hold |
District 110 | 15,505 | 100.00% | - | - | - | - | 15,505 | 100.00% | Democratic Hold |
District 111 | 26,681 | 100.00% | - | - | - | - | 26,681 | 100.00% | Democratic Hold |
District 112 | - | - | 19,131 | 81.63% | 4,305 | 18.37% | 23,436 | 100.00% | Republican Hold |
District 113 | 12,047 | 40.57% | 17,644 | 59.43% | - | - | 29,691 | 100.00% | Republican Hold |
District 114 | - | - | 25,334 | 81.07% | 5,915 | 81.07% | 31,249 | 100.00% | Republican Hold |
District 115 | 11,767 | 39.53% | 16,999 | 57.11% | 999 | 3.36% | 29,765 | 100.00% | Republican Hold |
District 116 | 16,639 | 100.00% | - | - | - | - | 16,639 | 100.00% | Democratic Hold |
District 117 | 11,521 | 47.30% | 12,835 | 52.70% | - | - | 24,356 | 100.00% | Republican GAIN |
District 118 | 14,531 | 100.00% | - | - | - | - | 14,531 | 100.00% | Democratic Hold |
District 119 | 15,361 | 100.00% | - | - | - | - | 15,361 | 100.00% | Democratic Hold |
District 120 | 16,892 | 82.28% | - | - | 3,637 | 17.72% | 20,529 | 100.00% | Democratic Hold |
District 121 | - | - | 33,845 | 82.10% | 7,381 | 17.90% | 41,226 | 100.00% | Republican Hold |
District 122 | - | - | 42,473 | 85.01% | 7,489 | 14.99% | 49,962 | 100.00% | Republican Hold |
District 123 | 20,178 | 86.28% | - | - | 3,210 | 13.72% | 23,388 | 100.00% | Democratic Hold |
District 124 | 16,236 | 100.00% | - | - | - | - | 16,236 | 100.00% | Democratic Hold |
District 125 | 17,143 | 76.92% | - | - | 5,144 | 23.08% | 22,287 | 100.00% | Democratic Hold |
District 126 | - | - | 23,899 | 86.31% | 3,791 | 13.69% | 27,690 | 100.00% | Republican Hold |
District 127 | - | - | 31,214 | 100.00% | - | - | 31,214 | 100.00% | Republican Hold |
District 128 | - | - | 23,887 | 90.70% | 2,450 | 9.30% | 26,337 | 100.00% | Republican Hold |
District 129 | 12,540 | 32.19% | 26,415 | 67.81% | - | - | 38,955 | 100.00% | Republican Hold |
District 130 | - | - | 34,489 | 90.77% | 3,506 | 9.23% | 37,995 | 100.00% | Republican Hold |
District 131 | 20,408 | 100.00% | - | - | - | - | 20,408 | 100.00% | Democratic Hold |
District 132 | 10,523 | 33.88% | 20,535 | 66.12% | - | - | 31,058 | 100.00% | Republican Hold |
District 133 | 11,754 | 25.40% | 34,530 | 74.60% | - | - | 46,284 | 100.00% | Republican Hold |
District 134 | 20,364 | 38.82% | 32,092 | 61.18% | - | - | 52,456 | 100.00% | Republican Hold |
District 135 | 10,175 | 34.14% | 19,630 | 65.86% | - | - | 29,805 | 100.00% | Republican Hold |
District 136 | 15,821 | 41.10% | 20,862 | 54.20% | 1,811 | 4.70% | 38,494 | 100.00% | Republican Hold |
District 137 | 7,155 | 57.86% | 5,211 | 42.14% | - | - | 12,366 | 100.00% | Democratic Hold |
District 138 | 8,766 | 33.22% | 17,622 | 66.78% | - | - | 26,388 | 100.00% | Republican Hold |
District 139 | 21,802 | 100.00% | - | - | - | - | 21,802 | 100.00% | Democratic Hold |
District 140 | 8,125 | 100.00% | - | - | - | - | 8,125 | 100.00% | Democratic Hold |
District 141 | 16,162 | 100.00% | - | - | - | - | 16,162 | 100.00% | Democratic Hold |
District 142 | 17,602 | 100.00% | - | - | - | - | 17,602 | 100.00% | Democratic Hold |
District 143 | 10,610 | 100.00% | - | - | - | - | 10,610 | 100.00% | Democratic Hold |
District 144 | 5,863 | 49.36% | 6,015 | 50.64% | - | - | 11,878 | 100.00% | Republican GAIN |
District 145 | 10,255 | 100.00% | - | - | - | - | 10,255 | 100.00% | Democratic Hold |
District 146 | 21,702 | 91.87% | - | - | 1,920 | 8.13% | 23,622 | 100.00% | Democratic Hold |
District 147 | 25,288 | 100.00% | - | - | - | - | 25,288 | 100.00% | Democratic Hold |
District 148 | 14,207 | 60.29% | 9,356 | 39.71% | - | - | 23,563 | 100.00% | Democratic Hold |
District 149 | 11,954 | 54.90% | 9,820 | 45.10% | - | - | 21,774 | 100.00% | Democratic Hold |
District 150 | 10,328 | 26.85% | 28,133 | 73.15% | - | - | 38,461 | 100.00% | Republican Hold |
Total | 1,305,080 | 32.10% | 2,589,565 | 63.70% | 170,617 | 4.20% | 4,065,262 | 100.00% | Source: [2] |
The 2003 Texas redistricting was a controversial intercensus state plan that defined new congressional districts. In the 2004 elections, this redistricting supported the Republicans taking a majority of Texas's federal House seats for the first time since Reconstruction. Democrats in both houses of the Texas Legislature staged walkouts, unsuccessfully trying to prevent the changes. Opponents challenged the plan in three suits, combined when the case went to the United States Supreme Court in League of United Latin American Citizens v. Perry (2006).
Thomas Russell Craddick is a Republican member of the Texas House of Representatives representing the 82nd district. Craddick was Speaker of the Texas House of Representatives from January 2003 to January 2009. He was the first Republican to serve as Speaker since Reconstruction.
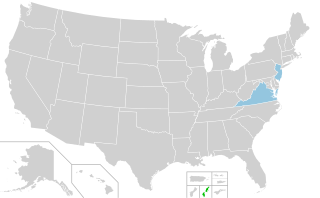
The 2005 United States elections were held on Tuesday, November 8. During this off-year election, the only seats up for election in the United States Congress were special elections held throughout the year. None of these congressional seats changed party hands. There were also two gubernatorial races, state legislative elections in two states, numerous citizen initiatives, mayoral races in several major cities, and a variety of local offices on the ballot.
The 2006 Texas Legislature election was held on Tuesday, November 7, 2006, in the U.S. state of Texas. The Texas Legislature election was conducted as a part of the 2006 Texas general election, which also included the 2006 United States Senate election in Texas, the 2006 United States House of Representatives elections in Texas, and the 2006 Texas gubernatorial election.
The politics of Oklahoma exists in a framework of a presidential republic modeled after the United States. The governor of Oklahoma is both head of state and head of government, and of a pluriform two-party system. Executive power is exercised by the governor and the government. Legislative power is vested in the governor and the bicameral Oklahoma Legislature. Judicial power is vested in the judiciary of Oklahoma. The political system is laid out in the 1907 Oklahoma Constitution.
2008 elections for the Texas Legislature were held on Tuesday, November 4, 2008, in the U.S. state of Texas. The Texas Legislature election was conducted concurrently with the election for the 2008 United States presidential race, the United States Senate seat of Republican John Cornyn, and the state's 32 congressional representatives.
The 2012 United States House of Representatives elections were held on November 6, 2012. It coincided with the reelection of President Barack Obama. Elections were held for all 435 seats representing the 50 U.S. states and also for the delegates from the District of Columbia and five major U.S. territories. The winners of this election cycle served in the 113th United States Congress. This was the first congressional election using districts drawn up based on the 2010 United States census.
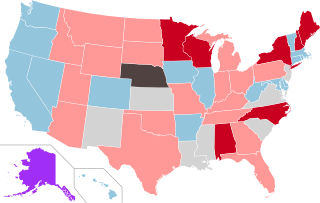
The 2010 United States state legislative elections were held on November 2, 2010, halfway through President Barack Obama's first term in office. Elections were held for 88 legislative chambers, with all states but Louisiana, Mississippi, New Jersey, and Virginia holding elections in at least one house. Kansas and New Mexico held elections for their lower, but not upper houses. Four territorial chambers in three territories and the District of Columbia were up as well.
Joshua Chad Brecheen is an American politician from the U.S. state of Oklahoma who has served as the U.S. representative for Oklahoma's 2nd congressional district since 2023. A member of the Republican Party, he represented the 6th district in the Oklahoma Senate from 2010 to 2018. He is a citizen of the Choctaw Nation.
This is a list of persons who have served as members of U.S. state legislatures while enrolled in third parties. For purposes of this list, a third party is defined as any party other than the Democratic Party or the Republican Party. This list spans the period from 1856 to the present. The time period listed beside each elected official's name is the time period when that elected official has served as a state legislator while enrolled as a member of a third party. State legislators who are independent are not included in this list.
The 1992 United States House of Representatives elections in Texas occurred on November 3, 1992, to elect the members of the state of Texas's delegation to the United States House of Representatives. Texas had thirty seats in the House, apportioned according to the 1990 United States Census.
The 2014 United States elections were held on Tuesday, November 4, 2014, in the middle of Democratic President Barack Obama's second term. Republicans retained control of the House of Representatives and won control of the Senate.
The 2018 Texas House of Representatives elections took place as part of the biennial United States elections. Texas voters elected state representatives in all 150 of the state house's districts. The winners of this election served in the 86th Texas Legislature. State representatives serve two-year terms in the Texas State House. A statewide map of Texas' state House districts can be obtained from the Texas Legislative Council here, and individual district maps can be obtained from the U.S. Census here.
The 2020 Texas Senate elections took place as part of the biennial United States elections. Texas voters elected state senators in 16 of the 31 state senate districts. The winners of this election served in the 87th Texas Legislature. State senators serve four-year terms in the Texas State Senate. Those elected in 2020 will only be elected for two years, however, as part of the 2-4-4 term system. A statewide map of Texas's state Senate districts can be obtained from the Texas Legislative Council. and individual district maps can be obtained from the U.S. Census.
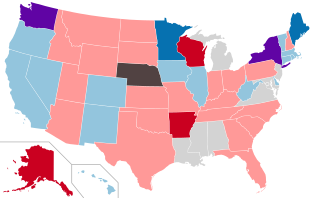
The 2020 United States state legislative elections were held on November 3, 2020, for 86 state legislative chambers in 44 states. Across the fifty states, approximately 65 percent of all upper house seats and 85 percent of all lower house seats were up for election. Nine legislative chambers in the five permanently-inhabited U.S. territories and the federal district of Washington, D.C. also held elections. The elections took place concurrently with several other federal, state, and local elections, including the presidential election, U.S. Senate elections, U.S. House elections, and gubernatorial elections.
The 2020 Massachusetts House of Representatives election took place on November 3, 2020. It elected members of the Massachusetts House of Representatives. Democrats achieved a net gain of 1 seat. One independent Susannah Whipps was also elected. Incumbent Speaker Robert DeLeo won re-election but resigned before the new session to take a position at Northeastern University; Ronald Mariano replaced him as Speaker.
The 2012 Texas Senate elections took place as part of the biennial United States elections. Texas voters elected state senators in all 31 State Senate districts. The winners of this election served in the 83rd Texas Legislature, with seats apportioned among the 2010 United States census.
The 2022 elections for the Florida State Senate took place on Tuesday, November 8, 2022, to elect state senators from all 40 districts. Although on ordinary years, 20 senators are elected at a time on a staggered basis, races following redistricting elect all 40 members to ensure that each member represents an equal number of constituents. The Republican Party expanded their Senate majority from 24 to 28, gaining a supermajority in the Senate. The concurrently held House elections also resulted in a supermajority, giving Republicans supermajority control of the legislature.
The 2010 Texas House of Representatives elections took place as part of the biennial United States elections. Texas voters elected state senators in all 150 State House of Representatives districts. The winners of this election served in the 82nd Texas Legislature. State representatives serve for two-year terms.
The 2012 Texas House of Representatives elections took place as part of the biennial United States elections. Texas voters elected state senators in all 150 State House of Representatives districts. The winners of this election served in the 83rd Texas Legislature, with seats apportioned according to the 2010 United States census. State representatives serve for two-year terms.