1944 United States presidential election in Texas

Last updated

1944 United States presidential election in Texas
Flag of Texas.svg
  1940 November 7, 1944 1948  
  1944 portrait of FDR (1)(small).jpg Dewey circa 1946 (cropped).jpg 3x4.svg
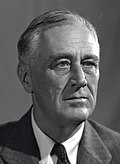
Nominee Franklin D. Roosevelt Thomas E. Dewey Unpledged electors
Party Democratic Republican Texas Regulars
Home state New York New York Texas
Running mate Harry S. Truman John W. Bricker
Electoral vote2300
Popular vote821,605191,425135,439
Percentage71.42%16.64%11.77%

Texas Presidential Election Results 1944.svg
County Results

President before election

Franklin D. Roosevelt
Democratic

Elected President

Franklin D. Roosevelt
Democratic

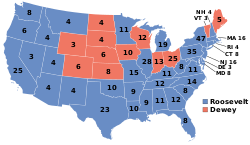
The 1944 United States presidential election in Texas took place on November 7, 1944, as part of the 1944 United States presidential election. State voters chose 23 electors [1] to represent the state in the Electoral College, which chose the president and vice president.

Contents

Incumbent Democratic President Franklin D. Roosevelt won Texas in a landslide, taking 71.42% of the state's vote to Republican Thomas E. Dewey's 16.64%. The Texas Regulars, a group of conservative Democrats who opposed Roosevelt's New Deal and ran a ticket of unpledged electors, took 11.77% of the vote.

As a former Confederate state, Texas had a history of Jim Crow laws, disenfranchisement of African-American and Mexican-American populations, and single-party Democratic rule. The only exceptions to this were a few local governments in Unionist German-American counties (chiefly Gillespie and Kendall) in Central Texas. Since 1930, no Republicans had served in either house of the Texas Legislature, and Democratic candidates for federal office routinely won the state by an overwhelming margin (Franklin Roosevelt won more than 87% of Texas' ballots in both 1932 and 1936). Many of Texas' officeholders were highly critical of Roosevelt's decision in 1940 to replace the segregationist, pro-Jim Crow, conservative Texan John Nance Garner with the anti-segregationist, anti-Jim Crow, liberal Northerner Henry A. Wallace as his running mate. [2] This antipathy grew far worse when, in March 1944, the landmark case of Smith v. Allwright ruled unconstitutional the white primaries upon which the politics of Texas and most other Southern states were based. [a] The result was that Texas' oil and natural gas industries became powerfully opposed to the re-nomination of President Roosevelt, [3] and called for the reversal of New Deal policies alongside the "return of states' rights" and "restoration of white supremacy". [4]

At first, these anti-New Deal Democrats attempted to take over the state Democratic organization, send anti-Roosevelt delegates to the national convention, [5] and prevent the seating of Black delegates at that convention. [6] When this failed, and Roosevelt loyalists maintained control of the state Democratic delegation, [2] the anti-New Deal groups formed the "Texas Regulars", led by Merritt Gibson, who would later join Strom Thurmond's Dixiecrat movement. [6]

Although their electors were not pledged to any candidate, the Regulars were able to gain access to the ballot [7] in September. [8] Support from Governor Pappy O'Daniel, however, failed to obscure that the Regulars' support was largely confined to affluent urban areas and a few traditional plantation districts, plus the fact that some of their support came from the state's small traditional Republican presidential vote. [9] Consequently, Texas again voted overwhelming for incumbent President Roosevelt and his new running mate, Missouri Senator Harry S. Truman. Washington County nonetheless gave the Regulars 52 percent of its ballots and thus became the first county in the nation to go for a third party since 1924, when Robert La Follette won over 16% of the national vote and more than a sixth of the nation's counties, Roosevelt remains the most recent Democratic presidential candidate to carry Texas more than once. [10]

Houston dentist Lonnie E. Smith, plaintiff in the landmark Supreme Court case Smith v. Allwright, casts his ballot in the 1944 Texas Democratic primary (July 22, 1944). Lonnie-Smith-1944.jpg
Houston dentist Lonnie E. Smith, plaintiff in the landmark Supreme Court case Smith v. Allwright , casts his ballot in the 1944 Texas Democratic primary (July 22, 1944).

Results

1944 United States presidential election in Texas [11]
PartyCandidateVotes%
Democratic Franklin D. Roosevelt (inc.) 821,605 71.42%
Republican Thomas E. Dewey 191,42516.64%
Texas Regulars Unpledged electors 135,43911.77%
Prohibition Claude Watson 1,0170.09%
Socialist Norman Thomas 5940.05%
America First Gerald Smith 2510.02%
Total votes1,150,331 100%

Results by county

1944 United States presidential election in Texas by county [12]
CountyFranklin D. Roosevelt
Democratic
Thomas E. Dewey
Republican
Unpledged electors
Texas Regulars
Various candidates
Other parties
MarginTotal votes cast
# %# %# %# %# %
Anderson 4,34279.32%4678.53%66012.06%50.09%3,682 [b] 67.26%5,474
Andrews 32981.44%4811.88%215.20%61.49%28169.55%404
Angelina 4,38774.38%1,00116.97%5088.61%20.03%3,38657.41%5,898
Aransas 45673.43%15024.15%121.93%30.48%30649.28%621
Archer 1,67479.83%1949.25%22710.82%20.10%1,447 [b] 69.00%2,097
Armstrong 62377.88%13216.50%445.50%10.13%49161.38%800
Atascosa 1,75766.40%68525.89%2027.63%20.08%1,07240.51%2,646
Austin 1,31641.33%61919.44%1,24839.20%10.03%68 [b] 2.14%3,184
Bailey 94364.68%35824.55%15310.49%40.27%58540.12%1,458
Bandera 53242.29%63450.40%927.31%00.00%-102-8.11%1,258
Bastrop 2,60479.17%38511.71%2999.09%10.03%2,21967.47%3,289
Baylor 1,56887.65%1025.70%1186.60%10.06%1,450 [b] 81.05%1,789
Bee 1,30654.17%84835.17%24610.20%110.46%45819.00%2,411
Bell 6,96077.72%7638.52%1,21613.58%160.18%5,744 [b] 64.14%8,955
Bexar 35,02457.96%23,58839.04%1,6972.81%1180.20%11,43618.93%60,427
Blanco 84655.95%53335.25%1338.80%00.00%31320.70%1,512
Borden 23776.95%3411.04%3611.69%10.32%201 [b] 65.26%308
Bosque 2,50275.02%50415.11%3249.72%50.15%1,99859.91%3,335
Bowie 7,04579.14%7908.87%1,06311.94%40.04%5,982 [b] 67.20%8,902
Brazoria 5,54372.07%85011.05%1,28616.72%120.16%4,257 [b] 55.35%7,691
Brazos 3,35876.75%46410.61%54812.53%50.11%2,810 [b] 64.23%4,375
Brewster 86472.85%23719.98%837.00%20.17%62752.87%1,186
Briscoe 61574.28%809.66%13115.82%20.24%484 [b] 58.45%828
Brooks 40363.46%14222.36%8613.54%40.63%26141.10%635
Brown 2,42668.45%43012.13%67519.05%130.37%1,751 [b] 49.41%3,544
Burleson 1,99282.76%1586.56%25610.64%10.04%1,736 [b] 72.12%2,407
Burnet 1,69780.35%22810.80%1838.66%40.19%1,46969.55%2,112
Caldwell 2,91675.00%70418.11%2666.84%20.05%2,21256.89%3,888
Calhoun 73268.22%15814.73%17616.40%70.65%556 [b] 51.82%1,073
Callahan 1,96279.66%2249.09%27611.21%10.04%1,686 [b] 68.45%2,463
Cameron 5,99850.63%5,30944.82%5104.31%290.24%6895.82%11,846
Camp 97771.42%18013.16%21015.35%10.07%767 [b] 56.07%1,368
Carson 1,21668.97%44625.30%975.50%40.23%77043.68%1,763
Cass 2,86676.59%54114.46%3318.85%40.11%2,32562.13%3,742
Castro 83869.66%22218.45%14311.89%00.00%61651.21%1,203
Chambers 1,03878.10%17913.47%1108.28%20.15%85964.64%1,329
Cherokee 3,91876.14%59811.62%62012.05%100.19%3,298 [b] 64.09%5,146
Childress 2,29582.05%29910.69%1997.11%40.14%1,99671.36%2,797
Clay 2,30777.42%31110.44%35812.01%40.13%1,949 [b] 65.40%2,980
Cochran 71671.60%12312.30%15715.70%40.40%559 [b] 55.90%1,000
Coke 82485.92%656.78%697.19%10.10%755 [b] 78.73%959
Coleman 2,88777.94%49813.44%3128.42%70.19%2,38964.50%3,704
Collin 6,57478.79%97411.67%7849.40%120.14%5,60067.11%8,344
Collingsworth 1,72579.79%26112.07%1687.77%80.37%1,46467.72%2,162
Colorado 1,51748.97%63820.59%93130.05%120.39%586 [b] 18.92%3,098
Comal 78726.33%2,02167.61%1785.96%30.10%-1,234-41.28%2,989
Comanche 2,94177.66%3569.40%48412.78%60.16%2,457 [b] 64.88%3,787
Concho 1,09079.91%15111.07%1239.02%00.00%93968.84%1,364
Cooke 3,27066.22%91918.61%73014.78%190.38%2,35147.61%4,938
Coryell 2,51879.71%41313.07%2287.22%00.00%2,10566.64%3,159
Cottle 2,55191.89%1304.68%943.39%10.04%2,42187.21%2,776
Crane 55286.38%589.08%253.91%40.63%49477.31%639
Crockett 32365.65%11222.76%5711.59%00.00%21142.89%492
Crosby 1,69179.50%2019.45%23010.81%50.24%1,461 [b] 68.69%2,127
Culberson 20079.68%176.77%3413.55%00.00%166 [b] 66.14%251
Dallam 1,11869.44%32320.06%16710.37%20.12%79549.38%1,610
Dallas 60,90964.77%21,09922.44%11,78112.53%2470.26%39,81042.33%94,036
Dawson 2,14974.83%47216.43%2448.50%70.24%1,67758.39%2,872
Deaf Smith 1,11761.88%50828.14%1769.75%40.22%60933.74%1,805
Delta 1,70685.86%1336.69%1487.45%00.00%1,558 [b] 78.41%1,987
Denton 5,58478.54%77110.84%73910.39%160.23%4,81367.69%7,110
De Witt 1,88445.00%1,87944.88%41910.01%50.12%50.12%4,187
Dickens 1,61786.06%1417.50%1176.23%40.21%1,47678.55%1,879
Dimmit 55456.70%32833.57%959.72%00.00%22623.13%977
Donley 1,17074.90%28017.93%1086.91%40.26%89056.98%1,562
Duval 3,35395.31%1363.87%280.80%10.03%3,21791.44%3,518
Eastland 4,60775.87%64310.59%80913.32%130.21%3,798 [b] 62.55%6,072
Ector 2,26573.28%43213.98%38412.42%100.32%1,83359.30%3,091
Edwards 34859.39%18731.91%488.19%30.51%16127.47%586
Ellis 7,06585.08%6668.02%5646.79%90.11%6,39977.06%8,304
El Paso 11,42672.69%2,07213.18%2,20214.01%180.11%9,224 [b] 58.68%15,718
Erath 3,33079.84%4119.85%4159.95%150.36%2,915 [b] 69.89%4,171
Falls 3,19175.63%3778.94%64815.36%30.07%2,543 [b] 60.27%4,219
Fannin 5,98483.54%6779.45%4966.92%60.08%5,30774.09%7,163
Fayette 3,15652.34%1,61126.72%1,25120.75%120.20%1,54525.62%6,030
Fisher 2,04187.52%1546.60%1355.79%20.09%1,88780.92%2,332
Floyd 1,75671.73%37015.11%32013.07%20.08%1,38656.62%2,448
Foard 92585.65%847.78%696.39%20.19%84177.87%1,080
Fort Bend 2,78169.87%44211.11%75218.89%50.13%2,029 [b] 50.98%3,980
Franklin 1,33683.45%1479.18%1106.87%80.50%1,18974.27%1,601
Freestone 2,42780.31%2779.17%31210.32%60.20%2,115 [b] 69.99%3,022
Frio 95169.47%29321.40%1249.06%10.07%65848.06%1,369
Gaines 1,17379.74%17311.76%1188.02%70.48%1,00067.98%1,471
Galveston 11,74877.94%1,54210.23%1,75711.66%270.18%9,991 [b] 66.28%15,074
Garza 84272.65%14412.42%16914.58%40.35%673 [b] 58.07%1,159
Gillespie 3339.32%2,95082.56%2878.03%30.08%-2,617-73.24%3,573
Glasscock 18568.77%3412.64%4817.84%20.74%137 [b] 50.93%269
Goliad 64147.55%60945.18%957.05%30.22%322.37%1,348
Gonzales 2,80470.33%84121.09%3388.48%40.10%1,96349.24%3,987
Gray 3,06761.48%1,73934.86%1723.45%110.22%1,32826.62%4,989
Grayson 11,63682.70%1,3729.75%1,0447.42%180.13%10,26472.95%14,070
Gregg 6,40170.52%1,41215.56%1,24913.76%150.17%4,98954.96%9,077
Grimes 1,55979.14%1376.95%27413.91%00.00%1,285 [b] 65.23%1,970
Guadalupe 1,58336.45%2,55658.85%2004.61%40.09%-973-22.40%4,343
Hale 3,06670.02%71216.26%59413.56%70.16%2,35453.76%4,379
Hall 1,81285.96%1647.78%1265.98%60.28%1,64878.18%2,108
Hamilton 1,79071.63%34413.77%36314.53%20.08%1,427 [b] 57.10%2,499
Hansford 59070.07%20324.11%495.82%00.00%38745.96%842
Hardeman 1,75680.81%22310.26%1928.84%20.09%1,53370.55%2,173
Hardin 2,63284.20%2437.77%2347.49%170.54%2,38976.42%3,126
Harris 71,07768.27%11,84311.37%21,09520.26%1040.10%49,982 [b] 48.00%104,119
Harrison 3,58871.63%61912.36%78215.61%200.40%2,806 [b] 56.02%5,009
Hartley 48493.08%265.00%101.92%00.00%45888.08%520
Haskell 2,57383.46%2618.47%2498.08%00.00%2,31274.99%3,083
Hays 1,69069.60%49520.39%2419.93%20.08%1,19549.22%2,428
Hemphill 79269.29%27423.97%706.12%70.61%51845.32%1,143
Henderson 3,21976.28%42710.12%56613.41%80.19%2,653 [b] 62.87%4,220
Hidalgo 7,25059.26%4,08033.35%8657.07%390.32%3,17025.91%12,234
Hill 4,87681.48%5168.62%5829.73%100.17%4,294 [b] 71.76%5,984
Hockley 2,64178.44%3199.47%40011.88%70.21%2,241 [b] 66.56%3,367
Hood 1,20381.73%1469.92%1208.15%30.20%1,05771.81%1,472
Hopkins 3,98181.64%53310.93%3487.14%140.29%3,44870.71%4,876
Houston 2,32974.03%2337.41%58418.56%00.00%1,745 [b] 55.47%3,146
Howard 3,58882.79%3347.71%4049.32%80.18%3,184 [b] 73.47%4,334
Hudspeth 33384.09%358.84%287.07%00.00%29875.25%396
Hunt 6,20077.14%7148.88%1,10513.75%180.22%5,095 [b] 63.39%8,037
Hutchinson 2,76072.14%86422.58%1965.12%60.16%1,89649.56%3,826
Irion 36380.13%5411.92%357.73%10.22%30968.21%453
Jack 1,48475.52%21711.04%26413.44%00.00%1,220 [b] 62.09%1,965
Jackson 1,70874.39%34414.98%24410.63%00.00%1,36459.41%2,296
Jasper 1,85076.23%34114.05%2359.68%10.04%1,50962.18%2,427
Jeff Davis 33179.38%5112.23%358.39%00.00%28067.15%417
Jefferson 22,06675.88%4,52515.56%2,4458.41%440.15%17,54160.32%29,080
Jim Hogg 62086.96%7710.80%162.24%00.00%54376.16%713
Jim Wells 1,90859.79%1,11334.88%1675.23%30.09%79524.91%3,191
Johnson 4,75780.68%5469.26%5829.87%110.19%4,175 [b] 70.81%5,896
Jones 3,41783.00%3618.77%3368.16%30.07%3,05674.23%4,117
Karnes 1,92067.23%69224.23%2418.44%30.11%1,22843.00%2,856
Kaufman 4,25182.77%4308.37%4418.59%140.27%3,810 [b] 74.18%5,136
Kendall 30917.54%1,33775.88%1146.47%20.11%-1,028-58.34%1,762
Kenedy 1619.51%6073.17%56.10%11.22%-44-53.66%82
Kent 57286.93%314.71%558.36%00.00%517 [b] 78.57%658
Kerr 1,37746.79%1,35846.14%2046.93%40.14%190.65%2,943
Kimble 88070.57%22518.04%14211.39%00.00%65552.53%1,247
King 22889.06%135.08%155.86%00.00%213 [b] 83.20%256
Kinney 40166.61%20033.22%10.17%00.00%20133.39%602
Kleberg 1,47375.27%42121.51%593.01%40.20%1,05253.76%1,957
Knox 1,78583.33%1567.28%1999.29%20.09%1,586 [b] 74.04%2,142
Lamar 6,28381.10%7259.36%7329.45%70.09%5,551 [b] 71.65%7,747
Lamb 2,40769.89%61617.89%41512.05%60.17%1,79152.00%3,444
Lampasas 1,69381.95%21210.26%1607.74%10.05%1,48171.68%2,066
La Salle 69280.47%12714.77%414.77%00.00%56565.70%860
Lavaca 3,40668.74%96019.37%58011.71%90.18%2,44649.36%4,955
Lee 95343.40%77135.11%46321.08%90.41%1828.29%2,196
Leon 1,56982.67%1407.38%1899.96%00.00%1,380 [b] 72.71%1,898
Liberty 2,56174.12%3369.73%55115.95%70.20%2,010 [b] 58.18%3,455
Limestone 4,29984.99%2394.73%51410.16%60.12%3,785 [b] 74.83%5,058
Lipscomb 55153.39%39638.37%767.36%90.87%15515.02%1,032
Live Oak 64245.69%54839.00%21215.09%30.21%946.69%1,405
Llano 1,19977.96%19812.87%1409.10%10.07%1,00165.08%1,538
Loving 6071.43%1821.43%67.14%00.00%4250.00%84
Lubbock 7,65470.50%1,16910.77%2,02118.62%120.11%5,633 [b] 51.89%10,856
Lynn 1,96878.94%26310.55%25610.27%60.24%1,70568.39%2,493
Madison 1,11585.31%654.97%1259.56%20.15%990 [b] 75.75%1,307
Marion 1,05776.54%21915.86%1047.53%10.07%83860.68%1,381
Martin 75876.88%13113.29%979.84%00.00%62763.59%986
Mason 82254.95%42028.07%24816.58%60.40%40226.87%1,496
Matagorda 1,85460.45%41213.43%79826.02%30.10%1,056 [b] 34.43%3,067
Maverick 78770.14%30226.92%302.67%30.27%48543.23%1,122
McCulloch 2,08874.47%46316.51%2518.95%20.07%1,62557.95%2,804
McLennan 15,33682.31%1,6688.95%1,5918.54%360.19%13,66873.36%18,631
McMullen 22359.47%10628.27%4512.00%10.27%11731.20%375
Medina 1,46943.35%1,60747.42%3119.18%20.06%-138-4.07%3,389
Menard 77669.16%968.56%25022.28%00.00%526 [b] 46.88%1,122
Midland 1,68857.63%30210.31%93832.02%10.03%750 [b] 25.61%2,929
Milam 3,53771.11%62312.53%80316.14%110.22%2,734 [b] 54.97%4,974
Mills 1,42878.59%1729.47%21611.89%10.06%1,212 [b] 66.70%1,817
Mitchell 2,21586.09%2188.47%1385.36%20.08%1,99777.61%2,573
Montague 2,90078.17%42911.56%37510.11%60.16%2,47166.60%3,710
Montgomery 2,90280.17%2196.05%49313.62%60.17%2,409 [b] 66.55%3,620
Moore 99971.66%31322.45%805.74%20.14%68649.21%1,394
Morris 1,26985.98%1228.27%855.76%00.00%1,14777.71%1,476
Motley 74479.57%10711.44%798.45%50.53%63768.13%935
Nacogdoches 3,22677.14%3197.63%61914.80%180.43%2,607 [b] 62.34%4,182
Navarro 6,29885.10%4496.07%6398.63%150.20%5,659 [b] 76.46%7,401
Newton 91074.35%18715.28%12410.13%30.25%72359.07%1,224
Nolan 3,07181.96%3228.59%3499.31%50.13%2,722 [b] 72.64%3,747
Nueces 11,09170.32%3,81924.21%8355.29%280.18%7,27246.10%15,773
Ochiltree 86365.93%30723.45%13610.39%30.23%55642.48%1,309
Oldham 27767.73%9322.74%368.80%30.73%18444.99%409
Orange 4,50077.05%91015.58%4217.21%90.15%3,59061.47%5,840
Palo Pinto 3,29179.76%41610.08%4109.94%90.22%2,87569.68%4,126
Panola 2,10684.17%2218.83%1646.55%110.44%1,88575.34%2,502
Parker 3,50376.90%55912.27%47610.45%170.37%2,94464.63%4,555
Parmer 81058.53%41529.99%15711.34%20.14%39528.54%1,384
Pecos 1,22674.17%30518.45%1207.26%20.12%92155.72%1,653
Polk 1,81780.61%1546.83%28012.42%30.13%1,537 [b] 68.19%2,254
Potter 6,51964.65%2,75927.36%7837.76%230.23%3,76037.29%10,084
Presidio 64863.28%21120.61%16516.11%00.00%43742.68%1,024
Rains 62868.56%13714.96%14916.27%20.22%479 [b] 52.29%916
Randall 1,43968.04%40919.34%26312.43%40.19%1,03048.70%2,115
Reagan 42681.92%5310.19%407.69%10.19%37371.73%520
Real 32659.38%16329.69%5910.75%10.18%16329.69%549
Red River 2,99178.24%46612.19%3619.44%50.13%2,52566.05%3,823
Reeves 1,15776.62%20113.31%1499.87%30.20%95663.31%1,510
Refugio 99167.51%37625.61%966.54%50.34%61541.89%1,468
Roberts 28969.14%8921.29%378.85%30.72%20047.85%418
Robertson 2,68188.13%1264.14%2317.59%40.13%2,450 [b] 80.54%3,042
Rockwall 1,15384.90%987.22%987.22%90.66%1,05577.69%1,358
Runnels 2,65770.16%68518.09%43811.57%70.18%1,97252.07%3,787
Rusk 5,23276.45%6379.31%97314.22%20.03%4,259 [b] 62.23%6,844
Sabine 1,16980.68%20314.01%755.18%20.14%96666.67%1,449
San Augustine 1,17692.02%1027.98%00.00%00.00%1,07484.04%1,278
San Jacinto 52272.50%537.36%14520.14%00.00%377 [b] 52.36%720
San Patricio 2,71270.61%87822.86%2426.30%90.23%1,83447.75%3,841
San Saba 2,10988.13%1777.40%1044.35%30.13%1,93280.74%2,393
Schleicher 52074.82%8412.09%8912.81%20.29%431 [b] 62.01%695
Scurry 1,76180.93%28513.10%1305.97%00.00%1,47667.83%2,176
Shackelford 1,00775.21%13510.08%19414.49%30.22%813 [b] 60.72%1,339
Shelby 2,92782.13%42812.01%2055.75%40.11%2,49970.12%3,564
Sherman 45477.74%9716.61%325.48%10.17%35761.13%584
Smith 6,67169.94%9369.81%1,92120.14%100.10%4,750 [b] 49.80%9,538
Somervell 40665.38%8714.01%12720.45%10.16%279 [b] 44.93%621
Starr 1,31294.05%684.87%151.08%00.00%1,24489.18%1,395
Stephens 2,10475.04%2177.74%47917.08%40.14%1,625 [b] 57.95%2,804
Sterling 33092.18%185.03%102.79%00.00%31287.15%358
Stonewall 90283.52%898.24%898.24%00.00%81375.28%1,080
Sutton 44970.60%11818.55%6910.85%00.00%33152.04%636
Swisher 1,27570.09%33118.20%20811.43%50.27%94451.90%1,819
Tarrant 36,79172.05%4,1138.05%10,16119.90%00.00%26,630 [b] 52.15%51,065
Taylor 7,97581.86%6026.18%1,14911.79%160.16%6,826 [b] 70.07%9,742
Terrell 32965.28%15630.95%173.37%20.40%17334.33%504
Terry 2,30482.88%2739.82%2037.30%00.00%2,03173.06%2,780
Throckmorton 97081.93%766.42%13511.40%30.25%835 [b] 70.52%1,184
Titus 2,61284.07%2658.53%2267.27%40.13%2,34775.54%3,107
Tom Green 6,27275.51%1,12513.54%89110.73%180.22%5,14761.97%8,306
Travis 14,38474.80%2,32412.09%2,49612.98%260.14%11,888 [b] 61.82%19,230
Trinity 1,13273.13%1278.20%28718.54%20.13%845 [b] 54.59%1,548
Tyler 1,03772.98%21915.41%16211.40%30.21%81857.57%1,421
Upshur 2,36970.32%44613.24%54816.27%60.18%1,821 [b] 54.05%3,369
Upton 74281.09%10511.48%667.21%20.22%63769.62%915
Uvalde 1,32256.11%85636.33%1667.05%120.51%46619.78%2,356
Val Verde 1,21060.96%67634.06%984.94%10.05%53426.90%1,985
Van Zandt 3,13974.65%50311.96%54012.84%230.55%2,599 [b] 61.81%4,205
Victoria 2,33163.27%93625.41%41511.26%20.05%1,39537.87%3,684
Walker 1,63880.41%1457.12%25412.47%00.00%1,384 [b] 67.94%2,037
Waller 1,00770.13%19013.23%23416.30%50.35%773 [b] 53.83%1,436
Ward 1,44879.60%26814.73%975.33%60.33%1,18064.87%1,819
Washington 1,38734.46%53413.27%2,10152.20%30.07%-714 [c] -17.74%4,025
Webb 4,74285.12%77613.93%470.84%60.11%3,96671.19%5,571
Wharton 3,75474.45%52910.49%75414.95%50.10%3,000 [b] 59.50%5,042
Wheeler 1,86971.47%51119.54%2288.72%70.27%1,35851.93%2,615
Wichita 11,39277.94%1,59710.93%1,60911.01%180.12%9,783 [b] 66.93%14,616
Wilbarger 3,38276.53%51711.70%51311.61%70.16%2,86564.83%4,419
Willacy 84648.70%75443.41%1337.66%40.23%925.30%1,737
Williamson 5,28471.11%1,23916.67%88511.91%230.31%4,04554.43%7,431
Wilson 2,66675.46%67619.13%1855.24%60.17%1,99056.33%3,533
Winkler 1,00484.16%12010.06%685.70%10.08%88474.10%1,193
Wise 3,11478.26%44411.16%41310.38%80.20%2,67067.10%3,979
Wood 3,04575.35%48512.00%50312.45%80.20%2,542 [b] 62.91%4,041
Yoakum 64677.00%10612.63%8610.25%10.12%54064.36%839
Young 3,18377.37%3277.95%59614.49%80.19%2,587 [b] 62.88%4,114
Zapata 50191.59%437.86%30.55%00.00%45883.73%547
Zavala 69661.65%34230.29%907.97%10.09%35431.36%1,129
Totals821,60571.42%191,42316.64%135,41111.77%1,8960.16%630,18254.78%1,150,335

Counties that flipped from Democratic to Republican

Counties that flipped from Republican to Democratic

Counties that flipped from Republican to Unpledged

See also

Notes

  1. Oklahoma, Tennessee, North Carolina and Virginia lacked statewide white primaries due to the presence of viable Republican opposition in the northwestern Plains or Appalachia, although many counties in these states did use white primaries (Fayette County, Tennessee was to conduct white primaries as late as 1959, fifteen years after Smith v. Allright).
  2. 1 2 3 4 5 6 7 8 9 10 11 12 13 14 15 16 17 18 19 20 21 22 23 24 25 26 27 28 29 30 31 32 33 34 35 36 37 38 39 40 41 42 43 44 45 46 47 48 49 50 51 52 53 54 55 56 57 58 59 60 61 62 63 64 65 66 67 68 69 70 71 72 73 74 75 76 77 78 79 80 81 82 83 84 85 86 87 In this county where the unpledged "Texas Regulars" ran second ahead of Dewey, margin given is Roosevelt vote minus Texas Regulars vote and percentage margin Roosevelt percentage minus Texas Regulars percentage.
  3. In this county where the unpledged "Texas Regulars" ran ahead of both Roosevelt and Dewey, margin given is Roosevelt vote minus Texas Regulars vote and percentage margin Roosevelt percentage minus Texas Regulars percentage.

Related Research Articles

<span class="mw-page-title-main">1944 United States presidential election</span>

Presidential elections were held in the United States on November 7, 1944, during World War II. Incumbent Democratic President Franklin D. Roosevelt defeated Republican Thomas E. Dewey to win an unprecedented fourth term. It was also the fifth presidential election in which both major party candidates were registered in the same home state; the others have been in 1860, 1904, 1920, 1940, and 2016.

In United States presidential elections, an unpledged elector is a person nominated to stand as an elector but who has not pledged to support any particular presidential or vice presidential candidate, and is free to vote for any candidate when elected a member of the Electoral College. Presidential elections are indirect, with voters in each state choosing electors on Election Day in November, and these electors choosing the president and vice president of the United States in December. Electors in practice have since the 19th century almost always agreed in advance to vote for a particular candidate — that is, they are said to have been pledged to that candidate. In several elections in the 20th century, however, competitive campaigns were mounted by candidates who made no pledge to any presidential nominee before the election. These anomalies largely arose from fissures within the Democratic Party over the issues of civil rights and segregation. No serious general election campaign has been mounted to elect unpledged electors in any state since 1964.

<span class="mw-page-title-main">1992 United States presidential election in South Dakota</span>

The 1992 United States presidential election in South Dakota took place on November 3, 1992, as part of the 1992 United States presidential election. Voters chose three representatives, or electors to the Electoral College, who voted for president and vice president.

<span class="mw-page-title-main">1912 United States presidential election in Montana</span>

The 1912 United States presidential election in Montana took place on November 5, 1912 as part of the 1912 United States presidential election. Voters chose four representatives, or electors to the Electoral College, who voted for president and vice president.

<span class="mw-page-title-main">1948 United States presidential election in Texas</span>

The 1948 United States presidential election in Texas was held on November 2, 1948. Texas voters chose 23 electors to represent the state in the Electoral College, which chose the president and vice president.

<span class="mw-page-title-main">1948 United States presidential election in Mississippi</span>

The 1948 United States presidential election in Mississippi took place on November 2, 1948, in Mississippi as part of the wider United States presidential election of 1948.

<span class="mw-page-title-main">1948 United States presidential election in Alabama</span>

The 1948 United States presidential election in Alabama was held on November 2, 1948. Alabama voters sent eleven electors to the Electoral College who voted for President and Vice-President. In Alabama, voters voted for electors individually instead of as a slate.

<span class="mw-page-title-main">1960 United States presidential election in Mississippi</span>

The 1960 United States presidential election in Mississippi took place on November 8, 1960, as part of the 1960 United States presidential election. Voters chose eight representatives, or electors to the Electoral College, who voted for president and vice president. This was the last election in which Mississippi had eight electoral votes: the Great Migration of Black Americans caused the state to lose congressional districts for the third time in four censuses before the next election.

<span class="mw-page-title-main">1968 United States presidential election in Florida</span>

The 1968 United States presidential election in Florida was held on November 5, 1968. Florida voters chose fourteen electors, or representatives to the Electoral College, who voted for president and vice president.

<span class="mw-page-title-main">1956 United States presidential election in Mississippi</span>

The 1956 United States presidential election in Mississippi was held on November 6, 1956. Mississippi voters chose eight representatives, or electors to the Electoral College, who voted for president and vice president.

<span class="mw-page-title-main">1956 United States presidential election in South Carolina</span>

The 1956 United States presidential election in South Carolina took place on November 6, 1956, as part of the 1956 United States presidential election. South Carolina voters chose eight representatives, or electors, to the Electoral College, who voted for president and vice president.

<span class="mw-page-title-main">1944 United States presidential election in South Carolina</span>

The 1944 United States presidential election in South Carolina took place on November 7, 1944, as part of the 1944 United States presidential election. State voters chose 8 electors to the Electoral College, which selected the president and vice president.

<span class="mw-page-title-main">1912 United States presidential election in Tennessee</span>

The 1912 United States presidential election in Tennessee took place on November 5, 1912, as part of the 1912 United States presidential election. Tennessee voters chose twelve representatives, or electors, to the Electoral College, who voted for president and vice president.

<span class="mw-page-title-main">1912 United States presidential election in North Carolina</span>

The 1912 United States presidential election in North Carolina took place on November 5, 1912, as part of the 1912 United States presidential election. North Carolina voters chose 12 representatives, or electors, to the Electoral College, who voted for president and vice president. Like all former Confederate states, North Carolina would during its “Redemption” develop a politics based upon Jim Crow laws, disfranchisement of its African-American population and dominance of the Democratic Party. However, unlike the Deep South, the Republican Party possessed sufficient historic Unionist white support from the mountains and northwestern Piedmont to gain a stable one-third of the statewide vote total in general elections even after blacks lost the right to vote.

<span class="mw-page-title-main">1912 United States presidential election in Michigan</span>

The 1912 United States presidential election in Michigan took place on November 5, 1912, as part of the 1912 United States presidential election. Voters chose 15 representatives, or electors, to the Electoral College, who voted for president and vice president.

<span class="mw-page-title-main">1948 United States presidential election in North Carolina</span>

The 1948 United States presidential election in North Carolina took place on November 2, 1948, as part of the 1948 United States presidential election. North Carolina voters chose 14 representatives, or electors, to the Electoral College, who voted for president and vice president.

<span class="mw-page-title-main">1948 United States presidential election in Tennessee</span>

The 1948 United States presidential election in Tennessee took place on November 2, 1948, as part of the 1948 United States presidential election. Tennessee voters chose 12 representatives, or electors, to the Electoral College, who voted for president and vice president.

<span class="mw-page-title-main">1932 United States presidential election in Georgia</span>

The 1932 United States presidential election in Georgia took place on November 8, 1932, as part of the 1932 United States presidential election. Voters chose 12 representatives, or electors, to the Electoral College, who voted for president and vice president.

<span class="mw-page-title-main">1900 United States presidential election in Georgia</span>

The 1900 United States presidential election in Georgia took place on November 6, 1900, as part of the wider United States presidential election. Voters chose 13 representatives, or electors, to the Electoral College, who voted for president and vice president.

<span class="mw-page-title-main">1936 United States presidential election in North Dakota</span>

The 1936 United States presidential election in North Dakota took place on November 3, 1936, as part of the 1936 United States presidential election. Voters chose four representatives, or electors to the Electoral College, who voted for president and vice president.

References

  1. "1944 Election for the Fortieth Term (1945-1949)" . Retrieved April 3, 2018.
  2. 1 2 Campbell, Randolph B.; Gone to Texas: A History of the Lone Star State, p. 406 ISBN   0190642394
  3. McArthur, Judith N. and Smith, Harold L.; Minnie Fisher Cunningham: A Suffragist's Life in Politics, p. 168 ISBN   9780195304862
  4. Cunningham, Sean; Cowboy Conservatism: Texas and the Rise of the Modern Right, pp. 25–26
  5. Calvert, Robert A.; The History of Texas, p. 334 ISBN   1118617738
  6. 1 2 Walton, Hanes; Ford, Pearl K. and Allen, Josephine; Remaking the Democratic Party: Lyndon B. Johnson as a Native-Son Presidential Candidate, p. 48 ISBN   9780472119943
  7. Jones, Eugene W. (1977); Practicing Texas Politics, p. 118
  8. ‘Texas Regulars File Democratic Electors’; New York Times , September 26, 1944, p. 14
  9. Heard, Alexander (1952); A Two-Party South?, p. 260
  10. "The American Presidency Project - Election of 1944" . Retrieved April 3, 2018.
  11. Dave Leip's U.S. Election Atlas; 1944 Presidential General Election Results – Texas
  12. "1944 Presidential Election Popular Vote". Géoelections. (.xlsx file for €15)