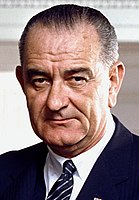
Presidential elections were held in the United States on November 3, 1964, less than a year following the assassination of John F. Kennedy, who won the previous presidential election. Incumbent Democratic President Lyndon B. Johnson defeated Republican Senator Barry Goldwater in a landslide victory. Johnson was the fourth and most recent vice president to succeed the presidency following the death of his predecessor and win a full term in his own right. Johnson won the largest share of the popular vote for the Democratic Party in history at 61.1%. As of 2024, this remains the highest popular vote percentage of any candidate since the advent of widespread popular elections in 1824.

The 2004 United States presidential election in Texas took place on November 2, 2004, and was part of the 2004 United States presidential election. State voters chose 34 representatives, or electors to the Electoral College, who voted for president and vice president.

The 1964 United States presidential election in Arizona took place on November 3, 1964, as part of the 1964 United States presidential election, which was held throughout all 50 states and D.C. Voters chose five representatives, or electors to the Electoral College, who voted for president and vice president.

The 1964 United States presidential election in Rhode Island took place on November 3, 1964, as part of the 1964 United States presidential election, which was held throughout all 50 states and D.C. Voters chose four representatives, or electors to the Electoral College, who voted for president and vice president.
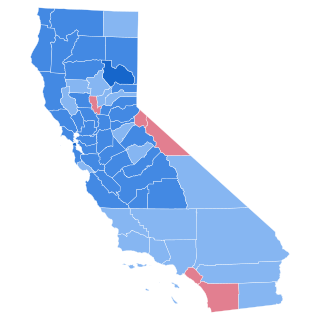
The 1964 United States presidential election in California took place on November 3, 1964, as part of the 1964 United States presidential election. State voters chose 40 representatives, or electors, to the Electoral College, who voted for president and vice president.

The 1964 United States presidential election in Georgia took place on November 3, 1964, as part of the 1964 United States presidential election, which was held on that day throughout all 50 states and The District of Columbia. Voters chose 12 representatives, or electors to the Electoral College, who voted for president and vice president.

The 2012 United States presidential election in Texas took place on November 6, 2012, as part of the 2012 United States presidential election in which all 50 states plus the District of Columbia participated. Texas voters chose 38 electors to represent them in the Electoral College via a popular vote pitting incumbent Democratic President Barack Obama and his running mate, Vice President Joe Biden, against Republican challenger and former Massachusetts Governor Mitt Romney and his running mate, Congressman Paul Ryan.

The 1964 United States presidential election in New York took place on November 3, 1964, as part of the 1964 United States presidential election in which all 50 states plus the District of Columbia participated. New York voters chose 43 electors to represent them in the Electoral College via a popular vote pitting incumbent Democratic President Lyndon B. Johnson and his running mate, President pro tempore of the Senate Hubert Humphrey, against Republican challenger and Senator Barry Goldwater from Arizona and his running mate and Chair of the Republican National Committee, William E. Miller.

The 1964 United States presidential election in Massachusetts took place on November 3, 1964, as part of the 1964 United States presidential election, which was held throughout all 50 states and D.C. Voters chose 14 representatives, or electors to the Electoral College, who voted for president and vice president.

The 1964 United States presidential election in Vermont took place on November 3, 1964, as part of the 1964 United States presidential election in which all 50 states plus the District of Columbia participated. Vermont voters chose 3 electors to represent them in the Electoral College via a popular vote pitting incumbent Democratic President Lyndon B. Johnson and his running mate, Senate Majority Whip Hubert Humphrey, against Republican challenger and Senator Barry Goldwater from Arizona and his running mate and Chair of the Republican National Committee, William E. Miller. It was the first time in Vermont's history that the state voted for the Democratic candidate, and the first time since the Republican Party's foundation that the state voted against its candidate.

The 1964 United States presidential election in Alaska took place on November 3, 1964, as part of the nationwide presidential election. Voters chose three representatives, or electors to the Electoral College, who voted for president and vice president.

The 1964 United States presidential election in New Jersey took place on November 3, 1964. All 50 states and the District of Columbia, were part of the 1964 United States presidential election. Voters chose 17 electors to the Electoral College, which selected the president and vice president.

The 1968 United States presidential election in New Hampshire took place on November 5, 1968, as part of the 1968 United States presidential election, which was held throughout all 50 states and the District of Columbia. Voters chose four representatives, or electors to the Electoral College, who voted for president and vice president.

The 1964 United States presidential election in New Hampshire took place on November 5, 1964, as part of the 1964 United States presidential election, which was held throughout all 50 states and D.C. Voters chose four representatives, or electors to the Electoral College, who voted for president and vice president.

The 1964 United States presidential election in Virginia took place on November 3, 1964. All 50 states and the District of Columbia were part of the 1964 United States presidential election. Virginia voters chose 12 electors to the Electoral College, which selected the president and vice president of the United States.

The 1960 United States presidential election in Texas was held on November 8, 1960, as part of the 1960 United States presidential election. The Democratic Party candidate John F. Kennedy, narrowly won the state of Texas with 50.52 percent of the vote to the Republican candidate Vice President Richard Nixon's 48.52%, a margin of two percent, giving him the state's 24 electoral votes. Despite the presence of U.S. Senator Lyndon B. Johnson on the Democratic ticket, the result made Texas the tenth closest state in the election. Nixon's strong performance in the Dallas–Fort Worth Metroplex, Harris County, the Panhandle, and the Hill Country kept the race close.

The 1948 United States presidential election in Texas was held on November 2, 1948. Texas voters chose 23 electors to represent the state in the Electoral College, which chose the president and vice president.
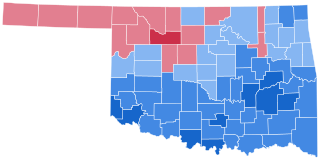
The 1964 United States presidential election in Oklahoma took place on November 3, 1964. All fifty states and The District of Columbia were part of the 1964 United States presidential election. Voters chose eight electors to the Electoral College, who voted for president and vice president.
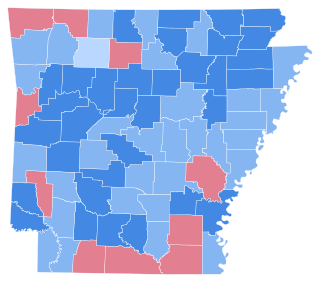
The 1964 presidential election in Arkansas was held on November 3, 1964 as part of the 1964 United States presidential election. State voters chose six electors, or representatives to the Electoral College, who voted for president and vice president. Incumbent President Lyndon B. Johnson won the state of Arkansas with 56.06% of the popular vote, which was a substantial increase upon John F. Kennedy's 50.19% from the preceding election, although the Republican vote remained virtually unchanged at 43.41%. Johnson won all but ten of Arkansas' seventy-five counties, and all four congressional districts. As of the 2020 presidential election, this is the last election in which Arkansas voted for a different candidate than neighboring Louisiana. Furthermore, with Mississippi, Alabama, Georgia, and South Carolina voting for Goldwater, Arkansas became the last Southern state to have never voted for a Republican candidate since the end of Reconstruction.

The 1964 United States presidential election in Maine took place on November 3, 1964, as part of the 1964 United States presidential election, which was held throughout all fifty states and D.C. Voters chose four representatives, or electors to the Electoral College, who voted for president and vice president.