| |||||||||||||||||||||||||
All 27 Texas seats to the United States House of Representatives | |||||||||||||||||||||||||
---|---|---|---|---|---|---|---|---|---|---|---|---|---|---|---|---|---|---|---|---|---|---|---|---|---|
| |||||||||||||||||||||||||
|
Elections in Texas |
---|
Government |
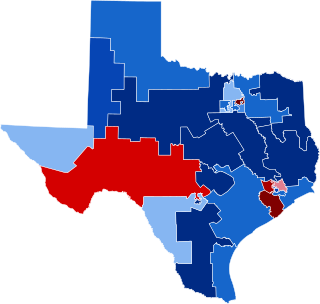
The 1988 United States House of Representatives elections in Texas occurred on November 8, 1988, to elect the members of the state of Texas's delegation to the United States House of Representatives. Texas had twenty-seven seats in the House, apportioned according to the 1980 United States census. [1]
These elections occurred simultaneously with the United States Senate elections of 1988, the United States House elections in other states, the presidential election, and various state and local elections.
Democrats maintained their majority of U.S. House seats from Texas, flipping two seats from the Republicans, increasing their majority to nineteen out of twenty seven seats. [2]
1988 United States House of Representatives elections in Texas [3] | ||||||
---|---|---|---|---|---|---|
Party | Votes | Percentage | Seats before | Seats after | +/– | |
Democratic | 2,735,940 | 58.59% | 17 | 19 | +2 | |
Republican | 1,834,135 | 39.28% | 10 | 8 | -2 | |
Libertarian | 98,602 | 2.11% | 0 | 0 | - | |
Independent | 1,013 | 0.02% | 0 | 0 | - | |
Totals | 4,669,690 | 100.00% | 27 | 27 | - |
Incumbent Democrat Jim Chapman ran for re-election.
Party | Candidate | Votes | % | |
---|---|---|---|---|
Democratic | Jim Chapman (incumbent) | 122,566 | 62.24 | |
Republican | Horace McQueen | 74,357 | 37.76 | |
Total votes | 196,923 | 100 | ||
Democratic hold | ||||
Incumbent Democrat Charlie Wilson ran for re-election.
Party | Candidate | Votes | % | |
---|---|---|---|---|
Democratic | Charlie Wilson (incumbent) | 145,614 | 87.67 | |
Libertarian | Gary Nelson | 20,475 | 12.33 | |
Total votes | 166,089 | 100 | ||
Democratic hold | ||||
Incumbent Republican Steve Bartlett ran for re-election.
Party | Candidate | Votes | % | |
---|---|---|---|---|
Republican | Steve Bartlett (incumbent) | 227,882 | 81.82 | |
Democratic | Blake Cowden | 50,627 | 18.18 | |
Total votes | 278,509 | 100 | ||
Republican hold | ||||
Incumbent Democrat Ralph Hall ran for re-election.
Party | Candidate | Votes | % | |
---|---|---|---|---|
Democratic | Ralph Hall (incumbent) | 139,379 | 66.41 | |
Republican | Randy Sutton | 67,379 | 32.09 | |
Libertarian | Melanie Dunn | 3,152 | 1.50 | |
Total votes | 209,868 | 100 | ||
Democratic hold | ||||
Incumbent Democrat John Wiley Bryant ran for re-election.
Party | Candidate | Votes | % | |
---|---|---|---|---|
Democratic | John Wiley Bryant (incumbent) | 95,376 | 60.73 | |
Republican | Lon Williams | 59,877 | 38.13 | |
Libertarian | Ken Ashby | 1,786 | 1.14 | |
Total votes | 157,039 | 100 | ||
Democratic hold | ||||
Incumbent Republican Joe Barton ran for re-election.
Party | Candidate | Votes | % | |
---|---|---|---|---|
Republican | Joe Barton (incumbent) | 164,692 | 67.64 | |
Democratic | Pat Kendrick | 78,786 | 32.36 | |
Total votes | 243,478 | 100 | ||
Republican hold | ||||
Incumbent Republican Bill Archer ran for re-election.
Party | Candidate | Votes | % | |
---|---|---|---|---|
Republican | Bill Archer (incumbent) | 185,203 | 79.14 | |
Democratic | Dianne Richards | 48,824 | 20.86 | |
Total votes | 234,027 | 100 | ||
Republican hold | ||||
Incumbent Republican Jack Fields ran for re-election unopposed.
Party | Candidate | Votes | % | |
---|---|---|---|---|
Republican | Jack Fields (incumbent) | 90,503 | 100.00 | |
Total votes | 90,503 | 100 | ||
Republican hold | ||||
Incumbent Democrat Jack Brooks ran for re-election unopposed.
Party | Candidate | Votes | % | |
---|---|---|---|---|
Democratic | Jack Brooks (incumbent) | 137,270 | 100.00 | |
Total votes | 137,270 | 100 | ||
Democratic hold | ||||
Incumbent Democrat J. J. Pickle ran for re-election.
Party | Candidate | Votes | % | |
---|---|---|---|---|
Democratic | J. J. Pickle (incumbent) | 232,213 | 93.45 | |
Libertarian | Vincent May | 16,281 | 6.55 | |
Total votes | 248,494 | 100 | ||
Democratic hold | ||||
Incumbent Democrat Marvin Leath ran for re-election.
Party | Candidate | Votes | % | |
---|---|---|---|---|
Democratic | Marvin Leath (incumbent) | 134,207 | 95.36 | |
Libertarian | Frederick King | 6,533 | 4.64 | |
Total votes | 140,740 | 100 | ||
Democratic hold | ||||
Incumbent Democratic Speaker of the United States House of Representatives Jim Wright ran for re-election.
Party | Candidate | Votes | % | |
---|---|---|---|---|
Democratic | Jim Wright (incumbent) | 135,459 | 99.27 | |
Write-in | Jim Ryan | 767 | 0.56 | |
Write-in | Gary Johnson | 230 | 0.17 | |
Total votes | 136,456 | 100 | ||
Democratic hold | ||||
Incumbent Republican Beau Boulter retired to run for U.S. Senator. [4]
Party | Candidate | Votes | % | |
---|---|---|---|---|
Democratic | Bill Sarpalius | 98,345 | 52.46 | |
Republican | Larry Milner | 89,105 | 47.54 | |
Total votes | 187,450 | 100.00 | ||
Democratic gain from Republican | ||||
Incumbent Republican Mac Sweeney ran for re-election.
Party | Candidate | Votes | % | |
---|---|---|---|---|
Democratic | Greg Laughlin | 111,395 | 53.24 | |
Republican | Mac Sweeney (incumbent) | 96,042 | 45.91 | |
Libertarian | Don Kelley | 1,779 | 0.85 | |
Total votes | 209,216 | 100.00 | ||
Democratic gain from Republican | ||||
Incumbent Democrat Kika de la Garza ran for re-election.
Party | Candidate | Votes | % | |
---|---|---|---|---|
Democratic | Kika de la Garza (incumbent) | 93,672 | 93.86 | |
Libertarian | Gloria Joyce Hendrix | 6,133 | 6.14 | |
Total votes | 99,805 | 100 | ||
Democratic hold | ||||
Incumbent Democrat Ronald D. Coleman ran for re-election unopposed.
Party | Candidate | Votes | % | |
---|---|---|---|---|
Democratic | Ronald D. Coleman (incumbent) | 104,504 | 100.00 | |
Total votes | 104,504 | 100 | ||
Democratic hold | ||||
Incumbent Democrat Charles Stenholm ran for re-election unopposed.
Party | Candidate | Votes | % | |
---|---|---|---|---|
Democratic | Charles Stenholm (incumbent) | 149,064 | 100.00 | |
Total votes | 149,064 | 100 | ||
Democratic hold | ||||
Incumbent Democrat Mickey Leland ran for re-election.
Party | Candidate | Votes | % | |
---|---|---|---|---|
Democratic | Mickey Leland (incumbent) | 94,408 | 92.88 | |
Libertarian | J. Alejandro Snead | 7,235 | 7.12 | |
Total votes | 101,643 | 100 | ||
Democratic hold | ||||
Incumbent Republican Larry Combest ran for re-election.
Party | Candidate | Votes | % | |
---|---|---|---|---|
Republican | Larry Combest (incumbent) | 113,068 | 67.71 | |
Democratic | Gerald McCathern | 53,932 | 32.29 | |
Total votes | 167,000 | 100 | ||
Republican hold | ||||
Incumbent Democrat Henry B. González ran for re-election.
Party | Candidate | Votes | % | |
---|---|---|---|---|
Democratic | Henry B. Gonzalez (incumbent) | 94,527 | 70.70 | |
Republican | Lee Trevino | 36,801 | 27.53 | |
Libertarian | Theresa Doyle | 2,368 | 1.77 | |
Total votes | 133,696 | 100 | ||
Democratic hold | ||||
Incumbent Republican Lamar Smith ran for re-election.
Party | Candidate | Votes | % | |
---|---|---|---|---|
Republican | Lamar Smith (incumbent) | 203,989 | 93.24 | |
Libertarian | James Robinson | 14,801 | 6.76 | |
Total votes | 218,790 | 100 | ||
Republican hold | ||||
Incumbent Republican Tom DeLay ran for re-election.
Party | Candidate | Votes | % | |
---|---|---|---|---|
Republican | Tom DeLay (incumbent) | 125,733 | 67.42 | |
Democratic | Wayne Walker | 58,471 | 31.35 | |
Libertarian | George Harper | 2,276 | 1.22 | |
Write-in | L.A. Sims | 4 | 0.00 | |
Total votes | 186,484 | 100 | ||
Republican hold | ||||
Incumbent Democrat Albert Bustamante ran for re-election.
Party | Candidate | Votes | % | |
---|---|---|---|---|
Democratic | Albert Bustamante (incumbent) | 116,423 | 64.53 | |
Republican | Jerome Gonzales | 60,559 | 33.56 | |
Libertarian | Tony Garza | 3,448 | 1.91 | |
Total votes | 180,430 | 100 | ||
Democratic hold | ||||
Incumbent Democrat Martin Frost ran for re-election.
Party | Candidate | Votes | % | |
---|---|---|---|---|
Democratic | Martin Frost (incumbent) | 135,794 | 92.61 | |
Libertarian | Leo Sadovy | 10,841 | 7.39 | |
Total votes | 146,635 | 100 | ||
Democratic hold | ||||
Incumbent Democrat Michael A. Andrews ran for re-election.
Party | Candidate | Votes | % | |
---|---|---|---|---|
Democratic | Michael A. Andrews (incumbent) | 113,499 | 71.37 | |
Republican | George Loeffler | 44,043 | 27.69 | |
Libertarian | Kevin Southwick | 1,494 | 0.94 | |
Total votes | 159,036 | 100 | ||
Democratic hold | ||||
Incumbent Republican Dick Armey ran for re-election.
Party | Candidate | Votes | % | |
---|---|---|---|---|
Republican | Dick Armey (incumbent) | 194,944 | 69.27 | |
Democratic | Jo Ann Reyes | 86,490 | 30.73 | |
Write-in | Dee Turner | 12 | 0.00 | |
Total votes | 281,446 | 100 | ||
Republican hold | ||||
Incumbent Democrat Solomon Ortiz ran for re-election unopposed.
Party | Candidate | Votes | % | |
---|---|---|---|---|
Democratic | Solomon Ortiz (incumbent) | 105,085 | 100.00 | |
Total votes | 105,085 | 100 | ||
Democratic hold | ||||
The 1988 United States Senate elections were elections for the United States Senate. Held on November 8, the 33 seats of Class 1 were contested in regular elections. In spite of the Republican victory by George H. W. Bush in the presidential election, the Democrats gained a net of one seat in the Senate. Seven seats changed parties, with four incumbents being defeated. The Democratic majority in the Senate increased by one to 55–to–45.
The 1952 United States Senate elections was an election for the United States Senate which coincided with the election of Dwight D. Eisenhower to the presidency by a large margin. The 32 Senate seats of Class 1 were contested in regular elections, and three special elections were held to fill vacancies. The Republicans took control of the Senate by managing to make a net gain of two seats. However, Wayne Morse (R-OR) became an independent forcing Republicans to rely on Vice President Richard Nixon's tie-breaking vote, although Republicans maintained a 48–47–1 plurality. Throughout the next Congress, Republicans were able to restore their 49–46–1 majority. This was the third time, as well as second consecutive, in which a sitting Senate leader lost his seat.
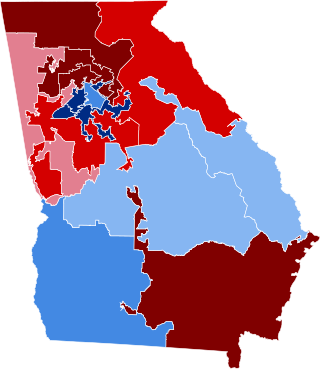
The 2004 House elections in Georgia occurred on November 2, 2004, to elect the members of the state of Georgia's delegation to the United States House of Representatives. Georgia has thirteen seats in the House, apportioned according to the 2000 United States census.
The 2004 United States House of Representatives elections in Texas occurred on November 2, 2004, to elect the members of the state of Texas's delegation to the United States House of Representatives. Texas had thirty-two seats in the House, apportioned according to the 2000 United States census.
The 1992 United States House of Representatives elections in Texas occurred on November 3, 1992, to elect the members of the state of Texas's delegation to the United States House of Representatives. Texas had thirty seats in the House, apportioned according to the 1990 United States census.
The 1984 United States House of Representatives elections in Texas occurred on November 6, 1984, to elect the members of the state of Texas's delegation to the United States House of Representatives. Texas had twenty-seven seats in the House, apportioned according to the 1980 United States census.
The 2002 United States House of Representatives elections in Texas occurred on November 5, 2002, to elect the members of the state of Texas's delegation to the United States House of Representatives. Texas had thirty-two seats in the House, apportioned according to the 2000 United States census. The state gained two seats in reapportionment. Democrats narrowly maintained control of the Texas House of Representatives after the 2000 election after heavily emphasizing it as necessary to protect the party from a potential Republican gerrymander. During the 2001 regular session, the divided legislature failed to pass any redistricting plans. Congressional redistricting fell to the courts in Balderas v. State of Texas after no special session was called to address redistricting. While the court's initial map appeared to benefit Republicans, the final maps ordered for the 2002 elections were seen as beneficial to Democrats.
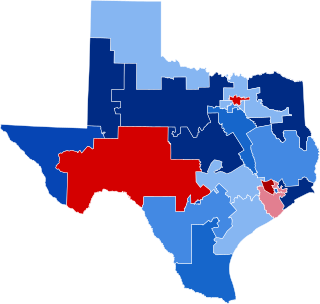
The 1980 United States House of Representatives elections in Texas occurred on November 4, 1980, to elect the members of the state of Texas's delegation to the United States House of Representatives. Texas had twenty-four seats in the House apportioned according to the 1970 United States census.
The 1996 United States House of Representatives elections in Texas occurred on November 5, 1996, to elect the members of the state of Texas's delegation to the United States House of Representatives. Texas had thirty seats in the House, apportioned according to the 1990 United States census.
The 1986 United States House of Representatives elections in Texas occurred on November 4, 1986, to elect the members of the state of Texas's delegation to the United States House of Representatives. Texas had twenty-seven seats in the House, apportioned according to the 1980 United States census.
The 1978 United States House of Representatives elections in Texas occurred on November 7, 1978, to elect the members of the state of Texas's delegation to the United States House of Representatives. Texas had twenty-four seats in the House apportioned according to the 1970 United States census.
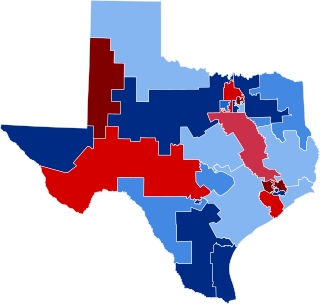
The 1990 United States House of Representatives elections in Texas occurred on November 6, 1990, to elect the members of the state of Texas's delegation to the United States House of Representatives. Texas had twenty-seven seats in the House, apportioned according to the 1980 United States census.
The 1994 United States House of Representatives elections in Texas occurred on November 8, 1994, to elect the members of the state of Texas's delegation to the United States House of Representatives. Texas had thirty seats in the House, apportioned according to the 1990 United States census.
The 2000 United States House of Representatives elections in Texas occurred on November 7, 2000, to elect the members of the state of Texas's delegation to the United States House of Representatives. Texas had thirty seats in the House, apportioned according to the 1990 United States census.
The 1998 United States House of Representatives elections in Texas occurred on November 3, 1998, to elect the members of the state of Texas's delegation to the United States House of Representatives. Texas had thirty seats in the House, apportioned according to the 1990 United States census.
The 2004 United States House of Representatives Elections in Florida were held on November 2, 2004 to determine who would represent the state of Florida in the United States House of Representatives. Representatives are elected for two-year terms; those elected served in the 109th Congress from January 3, 2005 to January 3, 2007. The election coincided with the 2004 U.S. presidential election as well as an election to the United States Senate.
The 1974 United States House of Representatives elections in Texas occurred on November 5, 1974, to elect the members of the state of Texas's delegation to the United States House of Representatives. Texas had twenty-four seats in the House apportioned according to the 1970 United States census.
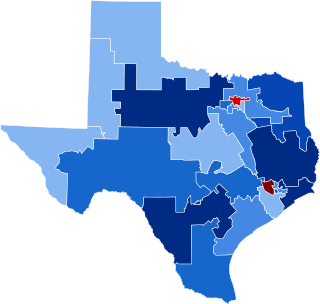
The 1976 United States House of Representatives elections in Texas occurred on November 2, 1976, to elect the members of the state of Texas's delegation to the United States House of Representatives. Texas had twenty-four seats in the House apportioned according to the 1970 United States census.
The 1982 United States House of Representatives elections in Texas occurred on November 2, 1982, to elect the members of the state of Texas's delegation to the United States House of Representatives. Texas had twenty-seven seats in the House, up three from the 1970s, apportioned according to the 1980 United States census.
The 2000 House elections in Washington occurred on November 7, 2000, to elect the members of the State of Washington's delegation to the United States House of Representatives. Washington has nine seats in the House, apportioned according to the 1990 United States census. This election saw the Democrats flip one Republican-held open seat. These elections occurred alongside Al Gore's victory in the state over George W. Bush in the presidential election.