The 2004 United States House of Representatives elections were held on November 2, 2004, to elect all 435 seats of the chamber. It coincided with the re-election of President George W. Bush as well as many Senate elections and gubernatorial elections. Prior to the election in the 108th Congress, Republicans held 227 seats, Democrats held 205, with two Republican vacancies and one independent. As a result of this election, the 109th Congress began composed of 232 Republicans, 201 Democrats, one independent, and one vacancy.

Texas's 7th congressional district of the United States House of Representatives comprises a small area of southwestern Houston and Harris County, along with a northern portion of suburban Fort Bend County. As of the 2000 census, the 7th district comprises 651,620 people. Since 2019, it has been represented by Democrat Lizzie Fletcher.

The 2002 United States House of Representatives elections were held on November 5, 2002, in the middle of President George W. Bush's first term, to elect U.S. Representatives to serve in the 108th United States Congress. This was the first congressional election using districts drawn up during the 2000 United States redistricting cycle on the basis of the 2000 census.

For about a hundred years, from after Reconstruction until the 1990s, the Democratic Party dominated Texas politics, making it part of the Solid South. In a reversal of alignments, since the late 1960s, the Republican Party has grown more prominent. By the 1990s, it became the state's dominant political party and remains so to this day, as Democrats have not won a statewide race since Bob Bullock won the 1994 Lieutenant gubernatorial election.

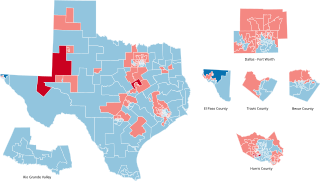
The 2003 Texas redistricting was a controversial intercensus state plan that defined new congressional districts. In the 2004 elections, this redistricting supported the Republicans taking a majority of Texas's federal House seats for the first time since Reconstruction. Democrats in both houses of the Texas Legislature staged walkouts, unsuccessfully trying to prevent the changes. Opponents challenged the plan in three suits, combined when the case went to the United States Supreme Court in League of United Latin American Citizens v. Perry (2006).

The 2002 United States elections were held on November 5, in the middle of Republican President George W. Bush's first term. Republicans won unified control of Congress, picking up seats in both chambers of Congress, making Bush the first President since Franklin D. Roosevelt in 1934 to gain seats in both houses of Congress. In the gubernatorial elections, Democrats won a net gain of one seat. The elections were held just a little under fourteen months after the September 11 attacks. Thus, the elections were heavily overshadowed by the War on Terror.
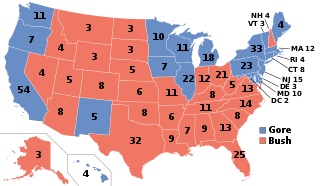
The 2000 United States elections were held on November 7, 2000. Republican Governor George W. Bush of Texas defeated Democratic Vice President Al Gore of Tennessee in the presidential election. Republicans retained control of both houses of Congress, giving the party unified control of Congress and the presidency for the first time since the 1954 elections.
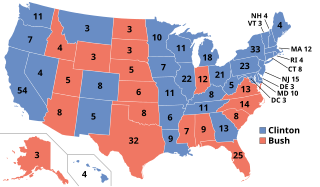
The 1992 United States elections elected state governors, the President of the United States, and members of the 103rd United States Congress. The election took place after the Soviet Union crumbled and the Cold War ended, as well as the redistricting that resulted from the 1990 census. Often considered "The Year Of The Woman," these elections brought an increased number of female politicians to Washington such as Dianne Feinstein (D-CA) and Carol Moseley Braun (D-IL). Governor Bill Clinton of Arkansas defeated incumbent President George H. W. Bush and businessman Ross Perot in the presidential election. The Democratic Party maintained their control of both chambers of Congress. This is the first Democratic trifecta since the Republican victory in the 1980 elections and the last one during the 20th century and the last one overall until 2008.

The 1992 United States House of Representatives elections in Texas occurred on November 3, 1992, to elect the members of the state of Texas's delegation to the United States House of Representatives. Texas had thirty seats in the House, apportioned according to the 1990 United States census.

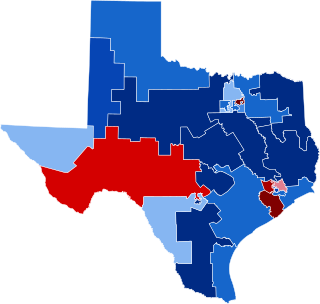
The 2002 United States House of Representatives elections in Texas occurred on November 5, 2002, to elect the members of the state of Texas's delegation to the United States House of Representatives. Texas had thirty-two seats in the House, apportioned according to the 2000 United States census. The state gained two seats in reapportionment. Democrats narrowly maintained control of the Texas House of Representatives after the 2000 election after heavily emphasizing it as necessary to protect the party from a potential Republican gerrymander. During the 2001 regular session, the divided legislature failed to pass any redistricting plans. Congressional redistricting fell to the courts in Balderas v. State of Texas after no special session was called to address redistricting. While the court's initial map appeared to benefit Republicans, the final maps ordered for the 2002 elections were seen as beneficial to Democrats.

The 1994 United States House of Representatives elections in Texas occurred on November 8, 1994, to elect the members of the state of Texas's delegation to the United States House of Representatives. Texas had thirty seats in the House, apportioned according to the 1990 United States census.
The 1982 United States House of Representatives elections in Texas occurred on November 2, 1982, to elect the members of the state of Texas's delegation to the United States House of Representatives. Texas had twenty-seven seats in the House, up three from the 1970s, apportioned according to the 1980 United States census.

The 2012 Texas Senate elections took place as part of the biennial United States elections. Texas voters elected state senators in all 31 State Senate districts. The winners of this election served in the 83rd Texas Legislature, with seats apportioned among the 2010 United States census.

The 2010 Texas House of Representatives elections took place as part of the biennial United States elections. Texas voters elected state senators in all 150 State House of Representatives districts. The winners of this election served in the 82nd Texas Legislature. State representatives serve for two-year terms.
The 2012 Texas House of Representatives elections took place as part of the biennial United States elections. Texas voters elected state senators in all 150 State House of Representatives districts. The winners of this election served in the 83rd Texas Legislature, with seats apportioned according to the 2010 United States census. State representatives serve for two-year terms.
Texas House of Representatives districts, Texas Senate districts, Texas Board of Education districts, and Texas's congressional districts are redistricted once every decade, usually in the year after the decennial United States census. According to the Texas Constitution, redistricting in Texas follows the regular legislative process; it must be passed by both houses of the Texas Legislature and signed by the governor of Texas—unless the legislature has sufficient votes to override a gubernatorial veto. Like many other states in the American South after the passage of the Voting Rights Act of 1965, federal judges and the United States Supreme Court have struck down Texas's congressional and legislative districts on multiple occasions, including in the 1960s, 1970s, 1980s, 1990s, and 2000s.

The 2002 Texas House of Representatives elections took place as part of the biennial United States elections. Texas voters elected state representatives in all 150 State House of Representatives districts. The winners of this election served in the 78th Texas Legislature, with seats apportioned according to the 2000 United States census. State representatives serve for two-year terms. Republicans gained control of the House with 88 seats to the Democrats' 62, giving them a governmental trifecta for the first time since Reconstruction.

The 1998 Texas House of Representatives elections took place as part of the biennial United States elections. Texas voters elected state representatives in all 150 State House of Representatives districts. The winners of this election served in the 76th Texas Legislature. State representatives serve for two-year terms. Republicans gained four seats from the Democrats, reducing the Democratic majority to 78 out of 150 seats.

The 1996 Texas House of Representatives elections took place as part of the biennial United States elections. Texas voters elected state representatives in all 150 State House of Representatives districts. The winners of this election served in the 75th Texas Legislature. State representatives serve for two-year terms. Republicans gained five seats from the Democrats, reducing the Democratic majority to 82 out of 150 seats.

The 1992 Texas House of Representatives elections took place as part of the biennial United States elections. Texas voters elected state representatives in all 150 State House of Representatives districts. The winners of this election served in the 73rd Texas Legislature, with seats apportioned according to the 1990 United States census. State representatives serve for two-year terms. Democrats maintained their majority of 92 out of 150 seats. As of 2024, this is the last time Democrats won the statewide popular vote for the Texas House.