2000 Texas House of Representatives election

Last updated

2000 Texas House of Representatives election
Flag of Texas.svg
  1998 November 7, 2000 2002  

All 150 seats in the Texas House of Representatives
76 seats needed for a majority
 Majority partyMinority party
 
Leader Pete Laney Tom Craddick
Party Democratic Republican
Leader sinceJanuary 12, 1993January 9, 1973
Leader's seat 85th 82nd
Last election7872
Seats won7872
Seat changeSteady2.svgSteady2.svg
Popular vote2,129,6332,943,035
Percentage41.03%56.70%
SwingDecrease2.svg 0.26%Decrease2.svg 1.84%

TxHouse2000Election.svg
2000 Texas State House election voteshares.svg
     Democratic hold     Democratic gain
     Republican hold     Republican gain
Democratic:     50–60%     60–70%     70–80%     80–90%     ≥90%
Republican:     50–60%     60–70%     70–80%     80–90%     ≥90%

Speaker before election

Pete Laney
Democratic

Elected Speaker

Pete Laney
Democratic

The 2000 Texas House of Representatives elections took place as part of the biennial United States elections. Texas voters elected state representatives in all 150 State House of Representatives districts. The winners of this election served in the 77th Texas Legislature. State representatives serve for two-year terms. There was no net change in seat control, leaving Democrats with their majority of 78 out of 150 seats. As of 2024, this is the last time Democrats won control of the Texas House of Representatives. [1]

Contents

Background

Democrats had held control of the Texas House of Representatives since Reconstruction despite Republicans winning the governorship in 1994 and the Texas Senate in 1996. [2] [3]

Results

Democrats flipped one Republican-held seat, and Republicans flipped one Democratic-held seat, resulting in no net change. [4] There were very few close races across the state. [5] Democrats' victory allowed them to maintain their last foothold of power across the state, preventing the establishment of a Republican trifecta. This also prevented complete Republican control over the upcoming redistricting which was to take place after the 2000 census. [6] [7]

Statewide

Summary of the November 7, 2000 Texas House of Representatives election results
Texas House 2000.svg
PartyCandidatesVotes %Seats+/–
Democratic Party 972,129,63341.03%78
Republican Party 952,943,03556.70%72
Libertarian Party 24117,0552.26%0
Write-in 14610.01%0
Total5,190,184100.00%150
Popular vote
Republican
56.70%
Democratic
41.03%
Libertarian
2.28%
Write-in
0.01%
House seats won
Democratic
52.00%
Republican
48.00%

Close races

  1. District 18, 2.50%
  2. District 5, 5.06%
  3. District 11, 6.10% (gain) (tipping-point district)
  4. District 73, 8.80%
  5. District 59, 8.80% (gain)
  6. District 20, 9.61%

Results by district

DistrictDemocraticRepublicanOthersTotalResult
Votes%Votes%Votes%Votes%
District 129,989100.00%----29,989100.00%Democratic hold
District 229,702100.00%----29,702100.00%Democratic hold
District 329,320100.00%----29,320100.00%Democratic hold
District 416,49236.15%29,12463.85%--45,616100.00%Republican hold
District 521,55652.53%19,47847.47%--41,034100.00%Democratic hold
District 612,57926.22%35,40473.78%--47,983100.00%Republican hold
District 7--29,574100.00%--29,574100.00%Republican hold
District 832,833100.00%----32,833100.00%Democratic hold
District 919,81744.59%24,62555.41%--44,442100.00%Republican hold
District 10--35,932100.00%--35,932100.00%Republican hold
District 1121,99153.05%19,45946.95%--41,450100.00%Democratic gain
District 1232,095100.00%----32,095100.00%Democratic hold
District 13--32,840100.00%--32,840100.00%Republican hold
District 14--28,98186.90%4,36913.10%33,350100.00%Republican hold
District 15--53,16488.38%6,98811.62%60,152100.00%Republican hold
District 16--43,078100.00%--43,078100.00%Republican hold
District 1732,522100.00%----32,522100.00%Democratic hold
District 1824,01351.25%22,83948.75%--46,852100.00%Democratic hold
District 1929,869100.00%----29,869100.00%Democratic hold
District 2025,35254.31%20,86844.70%4610.99%46,681100.00%Democratic hold
District 2127,03356.26%20,48442.63%5311.11%48,048100.00%Democratic hold
District 2226,788100.00%----26,788100.00%Democratic hold
District 2325,23256.84%18,39441.43%7671.73%44,393100.00%Democratic hold
District 2427,05259.42%18,47340.58%--45,525100.00%Democratic hold
District 25--42,719100.00%--42,719100.00%Republican hold
District 2622,45130.46%51,24569.54%--73,696100.00%Republican hold
District 2728,20964.02%15,85235.98%--44,061100.00%Democratic hold
District 2829,93763.35%17,32136.65%--47,258100.00%Democratic hold
District 2924,376100.00%----24,376100.00%Democratic hold
District 30--30,418100.00%--30,418100.00%Republican hold
District 3128,905100.00%----28,905100.00%Democratic hold
District 32--37,056100.00%--37,056100.00%Republican hold
District 3325,326100.00%----25,326100.00%Democratic hold
District 3422,504100.00%----22,504100.00%Democratic hold
District 3523,440100.00%----23,440100.00%Democratic hold
District 3618,451100.00%----18,451100.00%Democratic hold
District 3715,796100.00%----15,796100.00%Democratic hold
District 3818,20064.29%10,11135.71%--28,311100.00%Democratic hold
District 3915,837100.00%----15,837100.00%Democratic hold
District 4019,023100.00%----19,023100.00%Democratic hold
District 4118,808100.00%----18,808100.00%Democratic hold
District 4223,089100.00%----23,089100.00%Democratic hold
District 4329,749100.00%----29,749100.00%Democratic hold
District 4422,43555.15%18,24744.85%--40,682100.00%Democratic hold
District 45--49,380100.00%--49,380100.00%Republican hold
District 4618,64838.66%27,55157.12%2,0314.21%48,230100.00%Republican hold
District 47--74,95883.12%15,22116.88%90,179100.00%Republican hold
District 4833,68758.90%21,30037.24%2,2083.86%57,195100.00%Democratic hold
District 4929,83358.66%17,67234.75%3,3556.60%50,860100.00%Democratic hold
District 5031,63986.64%--4,87713.36%36,516100.00%Democratic hold
District 5127,263100.00%----27,263100.00%Democratic hold
District 52--54,19683.94%10,36816.06%64,564100.00%Republican hold
District 53--60,638100.00%--60,638100.00%Republican hold
District 5414,07437.82%23,13962.18%--37,213100.00%Republican hold
District 55--26,089100.00%--26,089100.00%Republican hold
District 56--35,156100.00%--35,156100.00%Republican hold
District 5725,415100.00%----25,415100.00%Democratic hold
District 58--35,399100.00%--35,399100.00%Republican hold
District 5915,56145.60%18,56654.40%--34,127100.00%Republican gain
District 60--35,395100.00%--35,395100.00%Republican hold
District 61--42,150100.00%--42,150100.00%Republican hold
District 62--35,073100.00%--35,073100.00%Republican hold
District 63--51,10388.08%6,91411.92%58,017100.00%Republican hold
District 64--51,681100.00%--51,681100.00%Republican hold
District 65--34,901100.00%--34,901100.00%Republican hold
District 66--59,905100.00%--59,905100.00%Republican hold
District 67--52,55088.42%6,88211.58%59,432100.00%Republican hold
District 6817,40542.06%23,97857.94%--41,383100.00%Republican hold
District 6926,079100.00%----26,079100.00%Democratic hold
District 7026,189100.00%----26,189100.00%Democratic hold
District 71--32,285100.00%--32,285100.00%Republican hold
District 7228,60873.64%10,24326.36%--38,851100.00%Democratic hold
District 7326,84354.40%22,50345.60%--49,346100.00%Democratic hold
District 7426,019100.00%----26,019100.00%Democratic hold
District 7521,528100.00%----21,528100.00%Democratic hold
District 7622,335100.00%----22,335100.00%Democratic hold
District 7716,213100.00%----16,213100.00%Democratic hold
District 78--28,409100.00%--28,409100.00%Republican hold
District 7922,322100.00%----22,322100.00%Democratic hold
District 80--23,728100.00%--23,728100.00%Republican hold
District 81--25,933100.00%--25,933100.00%Republican hold
District 828,79821.72%31,71778.28%--40,515100.00%Republican hold
District 83--19,53286.62%3,01713.38%22,549100.00%Republican hold
District 84--37,13587.60%5,25812.40%42,393100.00%Republican hold
District 8522,939100.00%----22,939100.00%Democratic hold
District 86--40,989100.00%--40,989100.00%Republican hold
District 87--23,856100.00%--23,856100.00%Republican hold
District 88--33,339100.00%--33,339100.00%Republican hold
District 8914,07737.41%23,54862.59%--37,625100.00%Republican hold
District 9015,531100.00%----15,531100.00%Democratic hold
District 91--36,186100.00%--36,186100.00%Republican hold
District 92--35,192100.00%--35,192100.00%Republican hold
District 93--24,833100.00%--24,833100.00%Republican hold
District 94--35,792100.00%--35,792100.00%Republican hold
District 9528,851100.00%----28,851100.00%Democratic hold
District 96--39,60486.57%6,14613.43%45,750100.00%Republican hold
District 97--41,79987.98%5,70812.02%47,507100.00%Republican hold
District 9815,70224.36%47,04572.99%1,7112.65%64,458100.00%Republican hold
District 99--37,713100.00%--37,713100.00%Republican hold
District 10019,907100.00%----19,907100.00%Democratic hold
District 10116,67541.60%23,41058.40%--40,085100.00%Republican hold
District 10214,36035.22%26,41864.78%--40,778100.00%Republican hold
District 10314,156100.00%----14,156100.00%Democratic hold
District 10410,86472.78%4,06427.22%--14,928100.00%Democratic hold
District 10516,57663.64%9,47036.36%--26,046100.00%Democratic hold
District 10614,63141.82%20,35658.18%--34,987100.00%Republican hold
District 10718,51159.41%12,64540.59%--31,156100.00%Democratic hold
District 108--40,295100.00%--40,295100.00%Republican hold
District 10927,569100.00%----27,569100.00%Democratic hold
District 11030,283100.00%----30,283100.00%Democratic hold
District 11128,982100.00%----28,982100.00%Democratic hold
District 112--28,535100.00%--28,535100.00%Republican hold
District 113--32,474100.00%--32,474100.00%Republican hold
District 11413,70231.97%29,15368.03%--42,855100.00%Republican hold
District 11518,773100.00%----18,773100.00%Democratic hold
District 11620,350100.00%----20,350100.00%Democratic hold
District 11716,490100.00%----16,490100.00%Democratic hold
District 11819,748100.00%----19,748100.00%Democratic hold
District 11922,773100.00%----22,773100.00%Democratic hold
District 12020,178100.00%----20,178100.00%Democratic hold
District 12112,92728.68%30,75668.24%1,3873.08%45,070100.00%Republican hold
District 122--50,42785.78%8,36214.22%58,789100.00%Republican hold
District 123--43,48784.59%7,92515.41%51,412100.00%Republican hold
District 12426,413100.00%----26,413100.00%Democratic hold
District 12518,94759.48%12,90640.52%--31,853100.00%Democratic hold
District 126--43,867100.00%--43,867100.00%Republican hold
District 127--40,478100.00%--40,478100.00%Republican hold
District 12820,369100.00%----20,369100.00%Democratic hold
District 129--38,50387.93%5,28312.07%43,786100.00%Republican hold
District 13015,23023.42%48,22374.16%1,5762.42%65,029100.00%Republican hold
District 13127,360100.00%----27,360100.00%Democratic hold
District 13230,755100.00%----30,755100.00%Democratic hold
District 133--35,04388.50%4,55511.50%39,598100.00%Republican hold
District 13414,49441.11%20,76458.89%--35,258100.00%Republican hold
District 135--40,946100.00%--40,946100.00%Republican hold
District 136--38,233100.00%--38,233100.00%Republican hold
District 13719,82262.14%12,07537.86%--31,897100.00%Democratic hold
District 13818,84462.39%11,36037.61%--30,204100.00%Democratic hold
District 13922,642100.00%----22,642100.00%Democratic hold
District 14013,261100.00%----13,261100.00%Democratic hold
District 14127,737100.00%----27,737100.00%Democratic hold
District 14225,464100.00%----25,464100.00%Democratic hold
District 14312,88369.06%5,77330.94%--18,656100.00%Democratic hold
District 14411,73437.83%19,28162.17%--31,015100.00%Republican hold
District 14512,15871.43%4,86328.57%--17,021100.00%Democratic hold
District 14630,459100.00%----30,459100.00%Democratic hold
District 14721,88293.12%--1,6166.88%23,498100.00%Democratic hold
District 14815,394100.00%----15,394100.00%Democratic hold
District 149--22,707100.00%--22,707100.00%Republican hold
District 150--38,676100.00%--38,676100.00%Republican hold
Total2,129,63341.03%2,943,03556.70%117,5162.27%5,190,184100.00%

Related Research Articles

<span class="mw-page-title-main">2003 Texas redistricting</span> Controversial redistricting of Texass districts for the U.S. House of Representatives

The 2003 Texas redistricting was a controversial intercensus state plan that defined new congressional districts. In the 2004 elections, this redistricting supported the Republicans taking a majority of Texas's federal House seats for the first time since Reconstruction. Democrats in both houses of the Texas Legislature staged walkouts, unsuccessfully trying to prevent the changes. Opponents challenged the plan in three suits, combined when the case went to the United States Supreme Court in League of United Latin American Citizens v. Perry (2006).
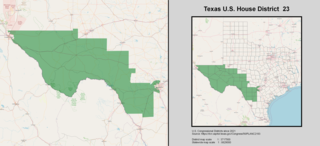
<span class="mw-page-title-main">Alabama's congressional districts</span>

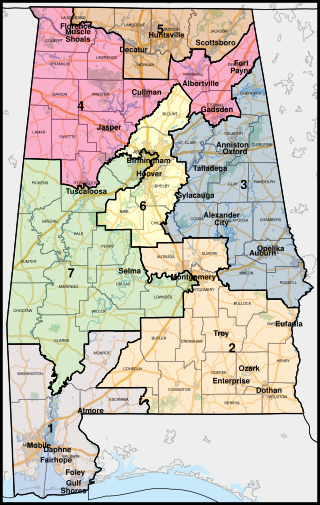
The U.S. state of Alabama is currently divided into seven congressional districts, each represented by a member of the United States House of Representatives.

<span class="mw-page-title-main">California's congressional districts</span> U.S. House districts in the state of California

California is the most populous U.S. state; as a result, it has the most representation in the United States House of Representatives, with 52 Representatives. Each Representative represents one congressional district.

<span class="mw-page-title-main">2010 United States elections</span>

The 2010 United States elections were held on Tuesday, November 2, 2010, in the middle of Democratic President Barack Obama's first term. Republicans ended unified Democratic control of Congress and the presidency by winning a majority in the House of Representatives and gained seats in the Senate despite Democrats holding Senate control.

<span class="mw-page-title-main">2002 United States elections</span>

The 2002 United States elections were held on November 5, in the middle of Republican President George W. Bush's first term. Republicans won unified control of Congress, picking up seats in both chambers of Congress, making Bush the first President since Franklin D. Roosevelt in 1934 to gain seats in both houses of Congress. In the gubernatorial elections, Democrats won a net gain of one seat. The elections were held just a little under fourteen months after the September 11 attacks. Thus, the elections were heavily overshadowed by the War on Terror, the impending Iraq War, the early 2000s recession, and the sudden death of Democratic Senator Paul Wellstone of Minnesota about one week before the election.

<span class="mw-page-title-main">2000 United States elections</span>

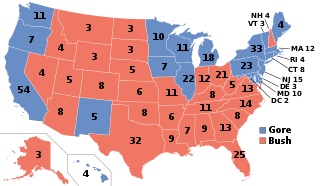
The 2000 United States elections were held on November 7, 2000. Republican Governor George W. Bush of Texas defeated Democratic Vice President Al Gore of Tennessee in the presidential election. Republicans retained control of both houses of Congress, giving the party unified control of Congress and the presidency for the first time since the 1954 elections.

<span class="mw-page-title-main">2012 United States House of Representatives elections</span> House elections for the 113th U.S. Congress

The 2012 United States House of Representatives elections were held on November 6, 2012. It coincided with the reelection of President Barack Obama. Elections were held for all 435 seats representing the 50 U.S. states and also for the delegates from the District of Columbia and five major U.S. territories. The winners of this election cycle served in the 113th United States Congress. This was the first congressional election using districts drawn up based on the 2010 United States census.

<span class="mw-page-title-main">1992 United States House of Representatives elections in Texas</span> 1992 House elections in Texas

The 1992 United States House of Representatives elections in Texas occurred on November 3, 1992, to elect the members of the state of Texas's delegation to the United States House of Representatives. Texas had thirty seats in the House, apportioned according to the 1990 United States census.

<span class="mw-page-title-main">2002 United States House of Representatives elections in Texas</span> 2002 House elections in Texas

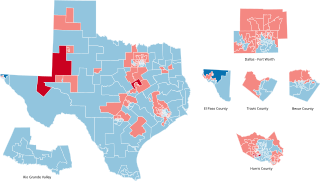
The 2002 United States House of Representatives elections in Texas occurred on November 5, 2002, to elect the members of the state of Texas's delegation to the United States House of Representatives. Texas had thirty-two seats in the House, apportioned according to the 2000 United States census. The state gained two seats in reapportionment. Democrats narrowly maintained control of the Texas House of Representatives after the 2000 election after heavily emphasizing it as necessary to protect the party from a potential Republican gerrymander. During the 2001 regular session, the divided legislature failed to pass any redistricting plans. Congressional redistricting fell to the courts in Balderas v. State of Texas after no special session was called to address redistricting. While the court's initial map appeared to benefit Republicans, the final maps ordered for the 2002 elections were seen as beneficial to Democrats.

<span class="mw-page-title-main">2020 United States state legislative elections</span> 2020 U.S. stage legislative elections

The 2020 United States state legislative elections were held on November 3, 2020, for 86 state legislative chambers in 44 states. Across the fifty states, approximately 65 percent of all upper house seats and 85 percent of all lower house seats were up for election. Nine legislative chambers in the five permanently-inhabited U.S. territories and the federal district of Washington, D.C. also held elections. The elections took place concurrently with several other federal, state, and local elections, including the presidential election, U.S. Senate elections, U.S. House elections, and gubernatorial elections.

<span class="mw-page-title-main">2012 Texas Senate election</span>

The 2012 Texas Senate elections took place as part of the biennial United States elections. Texas voters elected state senators in all 31 State Senate districts. The winners of this election served in the 83rd Texas Legislature, with seats apportioned among the 2010 United States census.

<span class="mw-page-title-main">2022 United States state legislative elections</span>

The 2022 United States state legislative elections were held on November 8, 2022, for 88 state legislative chambers in 46 states. Across the fifty states, approximately 56 percent of all upper house seats and 92 percent of all lower house seats were up for election. Additionally, six territorial chambers were up in four territories and the District of Columbia. These midterm elections coincided with other state and local elections, including gubernatorial elections in multiple states.

<span class="mw-page-title-main">2012 Texas House of Representatives election</span>

The 2012 Texas House of Representatives elections took place as part of the biennial United States elections. Texas voters elected state senators in all 150 State House of Representatives districts. The winners of this election served in the 83rd Texas Legislature, with seats apportioned according to the 2010 United States census. State representatives serve for two-year terms.

<span class="mw-page-title-main">2011 United States state legislative elections</span> State legislature elections in the United States

The 2011 United States state legislative elections were held on November 8, 2011. Eight legislative chambers in four states held regularly scheduled elections. These off-year elections coincided with other state and local elections, including gubernatorial elections in four states.

<span class="mw-page-title-main">Redistricting in Texas</span>

Texas House of Representatives districts, Texas Senate districts, Texas Board of Education districts, and Texas's congressional districts are redistricted once every decade, usually in the year after the decennial United States census. According to the Texas Constitution, redistricting in Texas follows the regular legislative process; it must be passed by both houses of the Texas Legislature and signed by the governor of Texas—unless the legislature has sufficient votes to override a gubernatorial veto. Like many other states in the American South after the passage of the Voting Rights Act of 1965, federal judges and the United States Supreme Court have struck down Texas's congressional and legislative districts on multiple occasions, including in the 1960s, 1970s, 1980s, 1990s, and 2000s.

<span class="mw-page-title-main">2004 Texas House of Representatives election</span>

The 2004 Texas House of Representatives elections took place as part of the biennial United States elections. Texas voters elected state representatives in all 150 State House of Representatives districts. The winners of this election served in the 79th Texas Legislature. State representatives serve for two-year terms. Republicans maintained control of the House, losing one seat to the Democrats.

<span class="mw-page-title-main">2002 Texas House of Representatives election</span>

The 2002 Texas House of Representatives elections took place as part of the biennial United States elections. Texas voters elected state representatives in all 150 State House of Representatives districts. The winners of this election served in the 78th Texas Legislature, with seats apportioned according to the 2000 United States census. State representatives serve for two-year terms. Republicans gained control of the House with 88 seats to the Democrats' 62, giving them a governmental trifecta for the first time since Reconstruction.

<span class="mw-page-title-main">1998 Texas House of Representatives election</span>

The 1998 Texas House of Representatives elections took place as part of the biennial United States elections. Texas voters elected state representatives in all 150 State House of Representatives districts. The winners of this election served in the 76th Texas Legislature. State representatives serve for two-year terms. Republicans gained four seats from the Democrats, reducing the Democratic majority to 78 out of 150 seats.

<span class="mw-page-title-main">1996 Texas House of Representatives election</span>

The 1996 Texas House of Representatives elections took place as part of the biennial United States elections. Texas voters elected state representatives in all 150 State House of Representatives districts. The winners of this election served in the 75th Texas Legislature. State representatives serve for two-year terms. Republicans gained five seats from the Democrats, reducing the Democratic majority to 82 out of 150 seats.

<span class="mw-page-title-main">1994 Texas House of Representatives election</span>

The 1994 Texas House of Representatives elections took place as part of the biennial United States elections. Texas voters elected state representatives in all 150 State House of Representatives districts. The winners of this election served in the 74th Texas Legislature. State representatives serve for two-year terms. Republicans gained a net of two seats from the Democrats, reducing the Democratic majority to 89 out of 150 seats.

References

  1. Goldenstein, Taylor (November 8, 2022). "Republicans on track to retain majority in Texas Legislature, early results show". Houston Chronicle. Retrieved June 3, 2023.
  2. Barboza, David (November 29, 1996). "Republicans Strike Deep In the Heart Of Texas". The New York Times. ISSN   0362-4331 . Retrieved March 17, 2023.
  3. "Rep. Stockman loses in Texas Congress runoff GOP claims majority in one house of state legislature, 1st since 1872". Baltimore Sun. December 12, 1996. Retrieved March 17, 2023.
  4. Office of the Secretary of State (November 7, 2000). "2000 General Election". elections.sos.state.tx.us. Retrieved June 3, 2023.
  5. "Election 2000". www.austinchronicle.com. November 10, 2000. Retrieved June 3, 2023.
  6. "National Parties Spend For Texas Redistricting Advantage". Congress Daily AM. The Atlantic Monthly Group LLC. September 28, 2000. Retrieved March 16, 2023 via Gale Academic OneFile.
  7. Ramsey, Ross (November 13, 2000). "A Truly Fantastic Week for Political Junkies". The Texas Tribune. Retrieved March 17, 2023.