| ||||||||||||||||||||||||||||
All 24 Texas seats to the United States House of Representatives | ||||||||||||||||||||||||||||
---|---|---|---|---|---|---|---|---|---|---|---|---|---|---|---|---|---|---|---|---|---|---|---|---|---|---|---|---|
| ||||||||||||||||||||||||||||
|
Elections in Texas |
---|
Government |
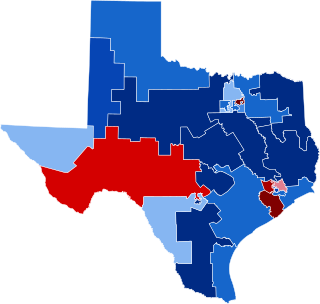
The 1980 United States House of Representatives elections in Texas occurred on November 4, 1980, to elect the members of the state of Texas's delegation to the United States House of Representatives. Texas had twenty-four seats in the House apportioned according to the 1970 United States census. [1]
These elections occurred simultaneously with the United States Senate elections of 1980, the United States House elections in other states, the presidential election, and various state and local elections.
Democrats maintained their majority of U.S. House seats from Texas, but they lost one seat to the Republicans, decreasing their majority to nineteen out of twenty-four seats on the coattails of president Ronald Reagan's election. [2] [3]
1980 United States House of Representatives elections in Texas [4] | ||||||
---|---|---|---|---|---|---|
Party | Votes | Percentage | Seats before | Seats after | +/– | |
Democratic | 2,405,026 | 59.11% | 20 | 19 | -1 | |
Republican | 1,608,636 | 39.54% | 4 | 5 | +1 | |
Libertarian | 52,820 | 1.30% | 0 | 0 | - | |
Independent | 2,053 | 0.05% | 0 | 0 | - | |
Totals | 4,068,535 | 100.00% | 24 | 24 | - |
Incumbent Democrat Sam B. Hall ran for re-election unopposed.
Party | Candidate | Votes | % | |
---|---|---|---|---|
Democratic | Sam B. Hall (incumbent) | 137,665 | 100.00 | |
Total votes | 137,665 | 100 | ||
Democratic hold |
Incumbent Democrat Charlie Wilson ran for re-election.
Party | Candidate | Votes | % | |
---|---|---|---|---|
Democratic | Charlie Wilson (incumbent) | 142,496 | 69.25 | |
Republican | F.H. Pannill | 60,742 | 29.52 | |
Libertarian | Martin Sorrells | 2,530 | 1.23 | |
Total votes | 205,768 | 100 | ||
Democratic hold |
Incumbent Republican James M. Collins ran for re-election.
Party | Candidate | Votes | % | |
---|---|---|---|---|
Republican | James M. Collins (incumbent) | 218,228 | 79.29 | |
Democratic | Earle Stephen Porter | 49,667 | 18.05 | |
Libertarian | William Stephen Briggs | 7,339 | 2.67 | |
Total votes | 275,234 | 100 | ||
Republican hold |
Incumbent Democrat Ray Roberts opted to retire rather than run for re-election. [2] [5] [6]
Party | Candidate | Votes | % | |
---|---|---|---|---|
Democratic | Ralph M. Hall | 102,787 | 52.26 | |
Republican | John Wright | 93,915 | 47.74 | |
Total votes | 196,702 | 100 | ||
Democratic hold |
Incumbent Democrat Jim Mattox ran for re-election.
Party | Candidate | Votes | % | |
---|---|---|---|---|
Democratic | Jim Mattox (incumbent) | 70,892 | 50.99 | |
Republican | Thomas W. Pauken | 67,848 | 48.80 | |
Write-in | Others | 295 | 0.21 | |
Total votes | 139,035 | 100 | ||
Democratic hold |
Incumbent Democrat Phil Gramm ran for re-election.
Party | Candidate | Votes | % | |
---|---|---|---|---|
Democratic | Phil Gramm (incumbent) | 144,816 | 70.88 | |
Republican | Buster Haskins | 59,503 | 29.12 | |
Total votes | 204,319 | 100 | ||
Democratic hold |
Incumbent Republican Bill Archer ran for re-election.
Party | Candidate | Votes | % | |
---|---|---|---|---|
Republican | Bill Archer (incumbent) | 242,810 | 82.12 | |
Democratic | Robert Hutchings | 48,594 | 16.43 | |
Libertarian | Bill Ware | 4,278 | 1.45 | |
Write-in | Others | 2 | 0.00 | |
Total votes | 295,684 | 100 | ||
Republican hold |
Incumbent Democrat Bob Eckhardt ran for re-election.
Party | Candidate | Votes | % | |
---|---|---|---|---|
Republican | Jack Fields | 72,856 | 51.75 | |
Democratic | Bob Eckhardt (incumbent) | 67,921 | 48.25 | |
Total votes | 140,777 | 100.00 | ||
Republican gain from Democratic |
Incumbent Democrat Jack Brooks ran for re-election unopposed.
Party | Candidate | Votes | % | |
---|---|---|---|---|
Democratic | Jack Brooks (incumbent) | 103,225 | 99.66 | |
Write-in | Others | 349 | 0.34 | |
Total votes | 103,574 | 100 | ||
Democratic hold |
Incumbent Democrat J. J. Pickle ran for re-election.
Party | Candidate | Votes | % | |
---|---|---|---|---|
Democratic | J. J. Pickle (incumbent) | 135,618 | 59.11 | |
Republican | John Biggar | 88,940 | 38.77 | |
Libertarian | Michael Grossberg | 4,866 | 2.12 | |
Total votes | 229,424 | 100 | ||
Democratic hold |
Incumbent Democrat Marvin Leath ran for re-election unopposed.
Party | Candidate | Votes | % | |
---|---|---|---|---|
Democratic | Marvin Leath (incumbent) | 128,520 | 100.00 | |
Total votes | 128,520 | 100 | ||
Democratic hold |
Incumbent Democrat Jim Wright ran for re-election.
Party | Candidate | Votes | % | |
---|---|---|---|---|
Democratic | Jim Wright (incumbent) | 99,104 | 59.92 | |
Republican | Jim Bradshaw | 65,005 | 39.30 | |
Libertarian | C.B. Mauldin | 1,281 | 0.78 | |
Total votes | 165,390 | 100 | ||
Democratic hold |
Incumbent Democrat Jack Hightower ran for re-election.
Party | Candidate | Votes | % | |
---|---|---|---|---|
Democratic | Jack Hightower (incumbent) | 98,779 | 55.00 | |
Republican | Ron Slover | 80,819 | 45.00 | |
Total votes | 179,598 | 100 | ||
Democratic hold |
Incumbent Democrat Joseph Wyatt opted to retire rather than run for re-election. [2] [7]
Party | Candidate | Votes | % | |
---|---|---|---|---|
Democratic | Bill Patman | 93,884 | 56.77 | |
Republican | C.L. Concklin | 71,495 | 43.23 | |
Total votes | 165,379 | 100 | ||
Democratic hold |
Incumbent Democrat Kika de la Garza ran for re-election.
Party | Candidate | Votes | % | |
---|---|---|---|---|
Democratic | Kika de la Garza (incumbent) | 105,325 | 70.02 | |
Republican | Lendy McDonald | 45,090 | 29.98 | |
Total votes | 150,415 | 100 | ||
Democratic hold |
Incumbent Democrat Richard Crawford White ran for re-election.
Party | Candidate | Votes | % | |
---|---|---|---|---|
Democratic | Richard Crawford White (incumbent) | 104,734 | 84.64 | |
Libertarian | Catherine McDivitt | 19,010 | 15.36 | |
Total votes | 123,744 | 100 | ||
Democratic hold |
Incumbent Democrat Charles Stenholm ran for re-election unopposed.
Party | Candidate | Votes | % | |
---|---|---|---|---|
Democratic | Charles Stenholm (incumbent) | 130,465 | 100.00 | |
Total votes | 130,465 | 100 | ||
Democratic hold |
Incumbent Democrat Mickey Leland ran for re-election.
Party | Candidate | Votes | % | |
---|---|---|---|---|
Democratic | Mickey Leland (incumbent) | 71,985 | 79.90 | |
Republican | C.L. Kennedy | 16,128 | 17.90 | |
Libertarian | Bill Fraser | 1,983 | 2.20 | |
Total votes | 90,096 | 100 | ||
Democratic hold |
Incumbent Democrat Kent Hance ran for re-election.
Party | Candidate | Votes | % | |
---|---|---|---|---|
Democratic | Kent Hance (incumbent) | 126,632 | 93.51 | |
Libertarian | J. D. Webster | 8,792 | 6.49 | |
Total votes | 135,424 | 100 | ||
Democratic hold |
Incumbent Democrat Henry B. González ran for re-election.
Party | Candidate | Votes | % | |
---|---|---|---|---|
Democratic | Henry B. Gonzalez (incumbent) | 84,133 | 81.93 | |
Republican | Merle Nash | 17,725 | 17.26 | |
Libertarian | Tom Burnham | 846 | 0.82 | |
Write-in | Others | 1 | 0.00 | |
Total votes | 102,685 | 100 | ||
Democratic hold |
Incumbent Republican Tom Loeffler ran for re-election.
Party | Candidate | Votes | % | |
---|---|---|---|---|
Republican | Tom Loeffler (incumbent) | 196,424 | 76.50 | |
Democratic | Joe Sullivan | 58,425 | 22.76 | |
Libertarian | William Rice | 1,895 | 0.74 | |
Total votes | 256,744 | 100 | ||
Republican hold |
Incumbent Republican Ron Paul ran for re-election.
Party | Candidate | Votes | % | |
---|---|---|---|---|
Republican | Ron Paul (incumbent) | 106,797 | 51.04 | |
Democratic | Michael A. Andrews | 101,094 | 48.31 | |
Independent | Vaudie Nance | 1,360 | 0.65 | |
Total votes | 209,251 | 100 | ||
Republican hold |
Incumbent Democrat Abraham Kazen ran for re-election.
Party | Candidate | Votes | % | |
---|---|---|---|---|
Democratic | Abraham Kazen (incumbent) | 104,595 | 69.83 | |
Republican | Bobby Locke | 45,139 | 30.14 | |
Write-in | Others | 46 | 0.03 | |
Total votes | 149,780 | 100 | ||
Democratic hold |
Incumbent Democrat Martin Frost ran for re-election.
Party | Candidate | Votes | % | |
---|---|---|---|---|
Democratic | Martin Frost (incumbent) | 93,690 | 61.29 | |
Republican | Clay Smothers | 59,172 | 38.71 | |
Total votes | 152,862 | 100 | ||
Democratic hold |
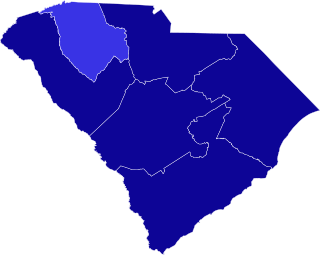
The 1956 United States House of Representatives elections in South Carolina were held on November 6, 1956, to select six Representatives for two-year terms from the state of South Carolina. All five incumbents who ran were re-elected and the open seat in the 5th congressional district was retained by the Democrats. The composition of the state delegation thus remained solely Democratic.
The 1978 United States House of Representatives elections in South Carolina were held on November 7, 1978, to select six Representatives for two-year terms from the state of South Carolina. The primary elections for the Democrats and the Republicans were held on June 13. All five incumbents who ran were re-elected, but the open seat in the 4th congressional district was taken by the Republicans from the Democrats. The composition of the state delegation after the elections was four Democrats and two Republicans.
The 1994 United States House of Representatives elections in South Carolina were held on November 8, 1994, to select six Representatives for two-year terms from the state of South Carolina. The primary elections for the Democrats and the Republicans were held on August 9 and the runoff elections were held two weeks later on August 23. All four incumbents who ran were re-elected and the Republicans won both of the open seats in the 1st congressional district and the 3rd congressional district. The composition of the state delegation after the elections was four Republicans and two Democrats.
The 1886 United States House of Representatives elections in South Carolina were held on November 2, 1886, to select seven Representatives for one two-year terms from the state of South Carolina. Five incumbents were re-elected, the Republican incumbent was defeated, and the open seat was retained by the Democrats. The composition of the state delegation after the election was solely Democratic.
The 2004 United States House of Representatives elections in Texas occurred on November 2, 2004, to elect the members of the state of Texas's delegation to the United States House of Representatives. Texas had thirty-two seats in the House, apportioned according to the 2000 United States census.
The 1992 United States House of Representatives elections in Texas occurred on November 3, 1992, to elect the members of the state of Texas's delegation to the United States House of Representatives. Texas had thirty seats in the House, apportioned according to the 1990 United States census.
The 1984 United States House of Representatives elections in Texas occurred on November 6, 1984, to elect the members of the state of Texas's delegation to the United States House of Representatives. Texas had twenty-seven seats in the House, apportioned according to the 1980 United States census.
The 2002 United States House of Representatives elections in Texas occurred on November 5, 2002, to elect the members of the state of Texas's delegation to the United States House of Representatives. Texas had thirty-two seats in the House, apportioned according to the 2000 United States census. The state gained two seats in reapportionment. Democrats narrowly maintained control of the Texas House of Representatives after the 2000 election after heavily emphasizing it as necessary to protect the party from a potential Republican gerrymander. During the 2001 regular session, the divided legislature failed to pass any redistricting plans. Congressional redistricting fell to the courts in Balderas v. State of Texas after no special session was called to address redistricting. While the court's initial map appeared to benefit Republicans, the final maps ordered for the 2002 elections were seen as beneficial to Democrats.
The 1996 United States House of Representatives elections in Texas occurred on November 5, 1996, to elect the members of the state of Texas's delegation to the United States House of Representatives. Texas had thirty seats in the House, apportioned according to the 1990 United States census.
The 1986 United States House of Representatives elections in Texas occurred on November 4, 1986, to elect the members of the state of Texas's delegation to the United States House of Representatives. Texas had twenty-seven seats in the House, apportioned according to the 1980 United States census.
The 1978 United States House of Representatives elections in Texas occurred on November 7, 1978, to elect the members of the state of Texas's delegation to the United States House of Representatives. Texas had twenty-four seats in the House apportioned according to the 1970 United States census.
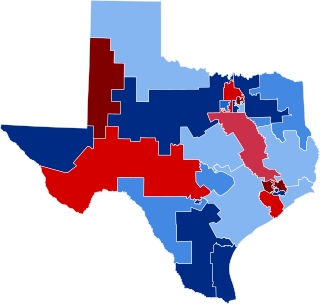
The 1990 United States House of Representatives elections in Texas occurred on November 6, 1990, to elect the members of the state of Texas's delegation to the United States House of Representatives. Texas had twenty-seven seats in the House, apportioned according to the 1980 United States census.
The 1994 United States House of Representatives elections in Texas occurred on November 8, 1994, to elect the members of the state of Texas's delegation to the United States House of Representatives. Texas had thirty seats in the House, apportioned according to the 1990 United States census.
The 2000 United States House of Representatives elections in Texas occurred on November 7, 2000, to elect the members of the state of Texas's delegation to the United States House of Representatives. Texas had thirty seats in the House, apportioned according to the 1990 United States census.
The 1998 United States House of Representatives elections in Texas occurred on November 3, 1998, to elect the members of the state of Texas's delegation to the United States House of Representatives. Texas had thirty seats in the House, apportioned according to the 1990 United States census.
The 1988 United States House of Representatives elections in Texas occurred on November 8, 1988, to elect the members of the state of Texas's delegation to the United States House of Representatives. Texas had twenty-seven seats in the House, apportioned according to the 1980 United States census.
The 1974 United States House of Representatives elections in Texas occurred on November 5, 1974, to elect the members of the state of Texas's delegation to the United States House of Representatives. Texas had twenty-four seats in the House apportioned according to the 1970 United States census.
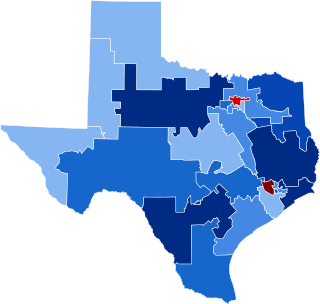
The 1976 United States House of Representatives elections in Texas occurred on November 2, 1976, to elect the members of the state of Texas's delegation to the United States House of Representatives. Texas had twenty-four seats in the House apportioned according to the 1970 United States census.
The 1964 United States House of Representatives elections in South Carolina were held on November 3, 1964, to select six Representatives for two-year terms from the state of South Carolina. The primary elections were held on June 9 and the runoff elections were held two weeks later on June 23. All five incumbents who ran were re-elected and the open seat in the 5th congressional district was retained by the Democrats. The composition of the state delegation thus remained solely Democratic.
The 1982 United States House of Representatives elections in Texas occurred on November 2, 1982, to elect the members of the state of Texas's delegation to the United States House of Representatives. Texas had twenty-seven seats in the House, up three from the 1970s, apportioned according to the 1980 United States census.
{{cite journal}}
: Cite journal requires |journal=
(help)