| ||||||||||||||||||||||||||||
All 27 Texas seats to the United States House of Representatives | ||||||||||||||||||||||||||||
---|---|---|---|---|---|---|---|---|---|---|---|---|---|---|---|---|---|---|---|---|---|---|---|---|---|---|---|---|
| ||||||||||||||||||||||||||||
|
Elections in Texas |
---|
Government |
The 1982 United States House of Representatives elections in Texas occurred on November 2, 1982, to elect the members of the state of Texas's delegation to the United States House of Representatives. Texas had twenty-seven seats in the House, up three from the 1970s, apportioned according to the 1980 United States census. [1]
Due to the Texas' divided government, considerable challenge was foreseen in the state's decennial redistricting process. The process attracted the attention of many prominent members of the U.S. House. [2] The Texas Legislature failed to adopt new congressional districts during the regular legislative session in 1981 due to conflict between liberal and conservative Texas Democrats. During a special session in 1981, conservative Democrats voted with Republicans on a plan supported by Republican governor Bill Clements. Most contentious during this session was the transfer of African-American voting precincts from District 5 to District 24 in the Dallas area. Though Republicans supported the establishment of the minority opportunity district, it was seen by many Democrats as a tactical political move to increase the Republican lean of the 5th District. [3] [4]
The adopted congressional districts were challenged by the U.S. Department of Justice in a District Court in Upham v. Seamon. Under preclearance established by Section 5 of the Voting Rights Act of 1965, they asserted that the boundaries of District 15 and District 27 were racially gerrymandered. The court ruled in favor of the Department of Justice, and it drew its own map, which established two districts in Dallas County where African-Americans made up a substantial proportion of the voting-age population. The case was appealed to the Supreme Court, and it remanded the case back to the District Court, but the ruling was made so close to the May primary election that the District Court's maps were allowed to stand for the 1982 elections. [5] [6]
These elections occurred simultaneously with the United States Senate elections of 1982, the United States House elections in other states, and various state and local elections.
Although Republicans were expected to gain seats in Texas's congressional delegation, [3] Democrats maintained their majority of seats, winning all three of the new seats Texas gained in the 1980 United States census. [7]
1982 United States House of Representatives elections in Texas [8] | ||||||
---|---|---|---|---|---|---|
Party | Votes | Percentage | Seats before | Seats after | +/– | |
Democratic | 1,847,045 | 64.83% | 19 | 22 | +3 | |
Republican | 934,863 | 32.81% | 5 | 5 | - | |
Libertarian | 57,998 | 2.04% | 0 | 0 | - | |
Citizens | 5,933 | 0.21% | 0 | 0 | - | |
Independent | 3,192 | 0.11% | 0 | 0 | - | |
Totals | 100.00% | 24 | 27 | - |
Incumbent Democrat Sam B. Hall ran for re-election.
Party | Candidate | Votes | % | |
---|---|---|---|---|
Democratic | Sam B. Hall (incumbent) | 100,685 | 97.48 | |
Libertarian | John Traylor | 2,598 | 2.52 | |
Total votes | 103,283 | 100 | ||
Democratic hold |
Incumbent Democrat Charlie Wilson ran for re-election.
Party | Candidate | Votes | % | |
---|---|---|---|---|
Democratic | Charlie Wilson (incumbent) | 91,762 | 94.26 | |
Libertarian | Ed Richbourg | 5,584 | 5.74 | |
Total votes | 97,346 | 100 | ||
Democratic hold |
Incumbent Republican James M. Collins retired to run for U.S. Senator. [9]
Party | Candidate | Votes | % | |
---|---|---|---|---|
Republican | Steve Bartlett | 99,852 | 77.09 | |
Democratic | Jim McNees | 28,223 | 21.79 | |
Libertarian | Jerry Williamson | 1,453 | 1.12 | |
Total votes | 129,528 | 100 | ||
Republican hold |
Incumbent Democrat Ralph Hall ran for re-election.
Party | Candidate | Votes | % | |
---|---|---|---|---|
Democratic | Ralph Hall (incumbent) | 94,134 | 73.83 | |
Republican | Pete Collumb | 32,221 | 25.27 | |
Libertarian | Bruce Iiams | 1,141 | 0.89 | |
Total votes | 127,496 | 100 | ||
Democratic hold |
Incumbent Democrat Jim Mattox retired to run for Attorney General. [10]
Party | Candidate | Votes | % | |
---|---|---|---|---|
Democratic | John Wiley Bryant | 52,214 | 64.84 | |
Republican | Joe Devany | 27,121 | 33.68 | |
Libertarian | Richard Squire | 732 | 0.91 | |
Citizens | John Richard Bridges | 459 | 0.57 | |
Write-in | Others | 4 | 0.00 | |
Total votes | 80,530 | 100 | ||
Democratic hold |
Incumbent Democrat Phil Gramm ran for re-election.
Party | Candidate | Votes | % | |
---|---|---|---|---|
Democratic | Phil Gramm (incumbent) | 91,546 | 94.54 | |
Libertarian | Ron Hard | 5,288 | 5.46 | |
Total votes | 96,834 | 100 | ||
Democratic hold |
Incumbent Republican Bill Archer ran for re-election.
Party | Candidate | Votes | % | |
---|---|---|---|---|
Republican | Bill Archer (incumbent) | 108,718 | 84.99 | |
Democratic | Dennis Scoggins | 17,866 | 13.97 | |
Libertarian | Bill Ware | 1,338 | 1.05 | |
Total votes | 127,922 | 100 | ||
Republican hold |
Incumbent Republican Jack Fields ran for re-election.
Party | Candidate | Votes | % | |
---|---|---|---|---|
Republican | Jack Fields (incumbent) | 50,630 | 56.75 | |
Democratic | Henry Allee | 38,041 | 42.64 | |
Libertarian | Mike Angwin | 547 | 0.61 | |
Total votes | 89,218 | 100 | ||
Republican hold |
Incumbent Democrat Jack Brooks ran for re-election.
Party | Candidate | Votes | % | |
---|---|---|---|---|
Democratic | Jack Brooks (incumbent) | 78,965 | 67.55 | |
Republican | John Lewis | 35,422 | 30.30 | |
Libertarian | Dean Allen | 2,510 | 2.15 | |
Total votes | 116,897 | 100 | ||
Democratic hold |
Incumbent Democrat J. J. Pickle ran for re-election.
Party | Candidate | Votes | % | |
---|---|---|---|---|
Democratic | J. J. Pickle (incumbent) | 121,030 | 90.14 | |
Libertarian | William Kelsey | 8,735 | 6.51 | |
Citizens | Bradley Louis Rockwell | 4,511 | 3.36 | |
Total votes | 134,276 | 100 | ||
Democratic hold |
Incumbent Democrat Marvin Leath ran for re-election.
Party | Candidate | Votes | % | |
---|---|---|---|---|
Democratic | Marvin Leath (incumbent) | 83,236 | 96.34 | |
Libertarian | Thomas Kilbride | 3,136 | 3.63 | |
Write-in | Others | 23 | 0.03 | |
Total votes | 86,395 | 100 | ||
Democratic hold |
Incumbent Democrat Jim Wright ran for re-election.
Party | Candidate | Votes | % | |
---|---|---|---|---|
Democratic | Jim Wright (incumbent) | 78,913 | 68.90 | |
Republican | Jim Ryan | 34,879 | 30.45 | |
Libertarian | Edward Olson | 743 | 0.65 | |
Total votes | 114,535 | 100 | ||
Democratic hold |
Incumbent Democrat Jack Hightower ran for re-election.
Party | Candidate | Votes | % | |
---|---|---|---|---|
Democratic | Jack Hightower (incumbent) | 86,376 | 63.60 | |
Republican | Ron Solver | 47,877 | 35.25 | |
Libertarian | Rod Collier | 1,567 | 1.15 | |
Total votes | 135,820 | 100 | ||
Democratic hold |
Incumbent Democrat Bill Patman ran for re-election. Former representative Joseph Wyatt, who retired in 1980, [11] challenged Patman, having switched his party affiliation from the Democratic Party to the Republican Party. [12]
Party | Candidate | Votes | % | |
---|---|---|---|---|
Democratic | Bill Patman (incumbent) | 76,851 | 60.65 | |
Republican | Joseph Wyatt | 48,942 | 38.62 | |
Libertarian | Glenn Rasmussen | 919 | 0.73 | |
Total votes | 126,712 | 100 | ||
Democratic hold |
Incumbent Democrat Kika de la Garza ran for re-election.
Party | Candidate | Votes | % | |
---|---|---|---|---|
Democratic | Kika de la Garza (incumbent) | 76,544 | 95.68 | |
Libertarian | Frank Jones | 3,458 | 4.32 | |
Total votes | 80,002 | 100 | ||
Democratic hold |
Incumbent Democrat Richard Crawford White opted to retire rather than run for re-election. [13]
Party | Candidate | Votes | % | |
---|---|---|---|---|
Democratic | Ronald D. Coleman | 44,024 | 53.90 | |
Republican | Pat Haggerty | 36,064 | 44.16 | |
Libertarian | Catherine McDivitt | 1,583 | 1.94 | |
Total votes | 81,671 | 100 | ||
Democratic hold |
Incumbent Democrat Charles Stenholm ran for re-election.
Party | Candidate | Votes | % | |
---|---|---|---|---|
Democratic | Charles Stenholm (incumbent) | 109,359 | 97.10 | |
Libertarian | James Cooley | 3,271 | 2.90 | |
Total votes | 112,630 | 100 | ||
Democratic hold |
Incumbent Democrat Mickey Leland ran for re-election.
Party | Candidate | Votes | % | |
---|---|---|---|---|
Democratic | Mickey Leland (incumbent) | 68,014 | 82.61 | |
Republican | C. Leon Pickett | 12,104 | 14.70 | |
Libertarian | Thomas Bernhardt | 2,215 | 2.69 | |
Write-in | Others | 2 | 0.00 | |
Total votes | 82,335 | 100 | ||
Democratic hold |
Incumbent Democrat Kent Hance ran for re-election.
Party | Candidate | Votes | % | |
---|---|---|---|---|
Democratic | Kent Hance (incumbent) | 89,702 | 81.57 | |
Republican | E. L. Hicks | 19,062 | 17.33 | |
Libertarian | Mike Read | 1,206 | 1.10 | |
Total votes | 109,970 | 100 | ||
Democratic hold |
Incumbent Democrat Henry B. González ran for re-election.
Party | Candidate | Votes | % | |
---|---|---|---|---|
Democratic | Henry B. Gonzalez (incumbent) | 68,544 | 91.48 | |
Libertarian | Roger Gary | 4,163 | 5.56 | |
Independent | Benedict La Rosa | 2,213 | 2.95 | |
Write-in | Others | 4 | 0.01 | |
Total votes | 74,924 | 100 | ||
Democratic hold |
Incumbent Republican Tom Loeffler ran for re-election.
Party | Candidate | Votes | % | |
---|---|---|---|---|
Republican | Tom Loeffler (incumbent) | 106,515 | 74.55 | |
Democratic | Charles Stough | 35,112 | 24.58 | |
Libertarian | Jeffrey Brown | 1,243 | 0.87 | |
Write-in | Others | 2 | 0.00 | |
Total votes | 142,872 | 100 | ||
Republican hold |
Incumbent Republican Ron Paul ran for re-election.
Party | Candidate | Votes | % | |
---|---|---|---|---|
Republican | Ron Paul (incumbent) | 66,536 | 98.60 | |
Write-in | Nick Benton | 943 | 1.40 | |
Total votes | 67,479 | 100 | ||
Republican hold |
Incumbent Democrat Abraham Kazen ran for re-election.
Party | Candidate | Votes | % | |
---|---|---|---|---|
Democratic | Abraham Kazen (incumbent) | 51,690 | 55.27 | |
Republican | Jeff Wentworth | 41,363 | 44.23 | |
Libertarian | Parker Abell | 475 | 0.51 | |
Total votes | 93,528 | 100 | ||
Democratic hold |
Incumbent Democrat Martin Frost ran for re-election. Under the legislature's initial redistricting plan, this district was slated to become a minority-majority district. Democratic former Dallas city councilwoman Lucy Patterson, an African-American woman, had announced her intention to challenge Frost in the Democratic primary. After the district's boundaries were changed by federal courts to return the district to having a majority-white population, Patterson switched parties and ran in the general election as a Republican. [14]
Party | Candidate | Votes | % | |
---|---|---|---|---|
Democratic | Martin Frost (incumbent) | 63,857 | 72.85 | |
Republican | Lucy Patterson | 22,798 | 26.01 | |
Libertarian | David Guier | 998 | 1.14 | |
Total votes | 87,653 | 100 | ||
Democratic hold |
District 25 was created as a result of redistricting after the 1980 census. The district was located in southern Harris County.
Party | Candidate | Votes | % | ||
---|---|---|---|---|---|
Democratic | Michael A. Andrews | 63,974 | 60.40 | ||
Republican | Mike Faubion | 40,112 | 37.87 | ||
Citizens | Barbara Coldiron | 963 | 0.91 | ||
Libertarian | Jeff Calvert | 864 | 0.82 | ||
Write-in | Others | 1 | 0.00 | ||
Total votes | 105,914 | 100 | |||
Democratic win (new seat) |
District 26 was created as a result of redistricting after the 1980 census. Both political parties heavily lobbied former Arlington mayor Tom Vandergriff to run for the seat on their respective tickets. [15] Vandergriff eventually chose to run as a Democrat. The district's lines had been drawn to favor Republicans; it would have given Ronald Reagan 67 percent of the vote had it existed in 1980. [16]
Party | Candidate | Votes | % | ||
---|---|---|---|---|---|
Democratic | Tom Vandergriff | 69,782 | 50.12 | ||
Republican | Jim Bradshaw | 69,438 | 49.88 | ||
Total votes | 139,220 | 100 | |||
Democratic win (new seat) |
District 27 was created as a result of redistricting after the 1980 census. The district was located in South Texas and was 53 percent Hispanic while the neighboring 15th District was 80 percent Hispanic in the plan passed by the Texas Legislature. The U.S. Department of Justice successfully argued that this was a racial gerrymander that diluted Hispanic voting power, and a District Court redrew the districts to more equally reflect Hispanic voting strength in the region. [4]
Party | Candidate | Votes | % | ||
---|---|---|---|---|---|
Democratic | Solomon Ortiz | 66,604 | 64.02 | ||
Republican | Jason Luby | 35,209 | 33.84 | ||
Libertarian | Steven Roberts | 2,231 | 2.14 | ||
Total votes | 104,044 | 100 | |||
Democratic win (new seat) |
Texas' 1st congressional district in the United States House of Representatives serves the northeastern portion of the state of Texas. As of 2022, the 1st district contained 775,992 people. It consists largely of three small East Texas metropolitan areas—Texarkana, Texas, Longview–Marshall, and Tyler. With a Cook Partisan Voting Index rating of R+26, it is the most Republican district in Texas. It has been represented by Republican Nathaniel Moran since 2023.
The 2003 Texas redistricting was a controversial intercensus state plan that defined new congressional districts. In the 2004 elections, this redistricting supported the Republicans taking a majority of Texas's federal House seats for the first time since Reconstruction. Democrats in both houses of the Texas Legislature staged walkouts, unsuccessfully trying to prevent the changes. Opponents challenged the plan in three suits, combined when the case went to the United States Supreme Court in League of United Latin American Citizens v. Perry (2006).
Texas's 22nd congressional district of the United States House of Representatives covers a largely suburban southwestern portion of the Greater Houston metropolitan area. The district includes most of Fort Bend County, including most of the cities of Sugar Land, Rosenberg, Needville and the county seat of Richmond as well as the county's share of the largely unincorporated Greater Katy area west of Houston. In addition, the district also contains portions of northern Brazoria County, including most of Pearland and Alvin and all of Wharton and Matagorda counties, as well as a small portion of western Harris County centered on most of that county's share of the Greater Katy area.
Texas's 25th congressional district of the United States House of Representatives stretches from Arlington and Fort Worth to some of its outer southwestern suburbs, as well as rural counties east of Abilene. The district's current Representative is Roger Williams.
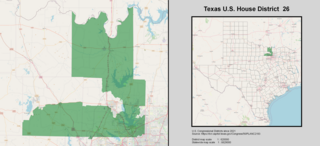
Texas' 26th congressional district of the United States House of Representatives includes rural Cooke County to the north and some of Wise County to the West and includes parts of Denton County, including Flower Mound, Lewisville and parts of Corinth, Carrollton, Little Elm and The Colony. The current Representative is Michael C. Burgess. The district is best known as the seat of former House Majority Leader Dick Armey.
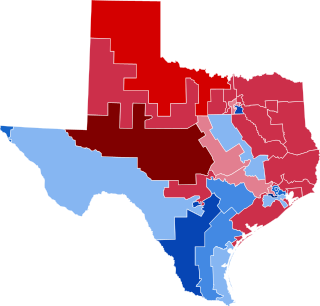
The 2006 United States House of Representatives elections in Texas were held on November 7, 2006, to determine the 32 U.S. representatives from the state of Texas, one from each of the state's 32 congressional districts. These elections coincided with the 2006 midterm elections, which included a gubernatorial election and an election to the U.S. Senate.
The 2008 elections for the Texas delegation of the United States House of Representatives was held on November 4, 2008. 31 of 32 congressional seats that make up the state's delegation were contested. In Texas's 14th congressional district no one challenged incumbent Ron Paul. Since Representatives are elected for two-year terms, those elected will serve in the 111th United States Congress from January 4, 2009, until January 3, 2011.
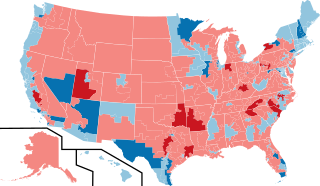
The 2012 United States House of Representatives elections were held on November 6, 2012. It coincided with the reelection of President Barack Obama. Elections were held for all 435 seats representing the 50 U.S. states and also for the delegates from the District of Columbia and five major U.S. territories. The winners of this election cycle served in the 113th United States Congress. This was the first congressional election using districts drawn up based on the 2010 United States census.
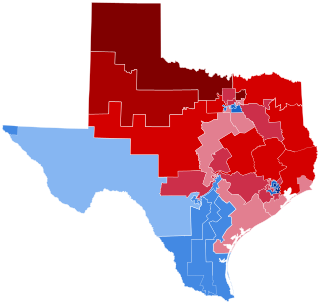
The 2012 United States House of Representatives elections in Texas were held on Tuesday, November 6, 2012, to elect the 36 U.S. representatives from the state of Texas—an increase of four seats in reapportionment following the 2010 United States census. The elections coincided with the elections of other federal and state offices, including a quadrennial presidential election and an election for the U.S. Senate. The primary election had been scheduled to be held on March 6, 2012, with a runoff election on May 22; because of problems arising from redistricting, the primary was postponed to May 29, and the run-off to July 31.
The 1992 United States House of Representatives elections in Texas occurred on November 3, 1992, to elect the members of the state of Texas's delegation to the United States House of Representatives. Texas had thirty seats in the House, apportioned according to the 1990 United States census.
The 1984 United States House of Representatives elections in Texas occurred on November 6, 1984, to elect the members of the state of Texas's delegation to the United States House of Representatives. Texas had twenty-seven seats in the House, apportioned according to the 1980 United States census.
The 2002 United States House of Representatives elections in Texas occurred on November 5, 2002, to elect the members of the state of Texas's delegation to the United States House of Representatives. Texas had thirty-two seats in the House, apportioned according to the 2000 United States census. The state gained two seats in reapportionment. Democrats narrowly maintained control of the Texas House of Representatives after the 2000 election after heavily emphasizing it as necessary to protect the party from a potential Republican gerrymander. During the 2001 regular session, the divided legislature failed to pass any redistricting plans. Congressional redistricting fell to the courts in Balderas v. State of Texas after no special session was called to address redistricting. While the court's initial map appeared to benefit Republicans, the final maps ordered for the 2002 elections were seen as beneficial to Democrats.
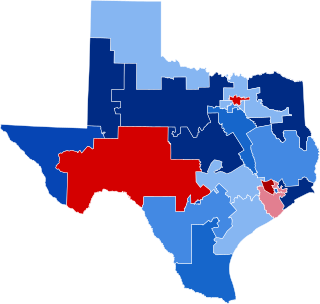
The 1980 United States House of Representatives elections in Texas occurred on November 4, 1980, to elect the members of the state of Texas's delegation to the United States House of Representatives. Texas had twenty-four seats in the House apportioned according to the 1970 United States census.
The 1996 United States House of Representatives elections in Texas occurred on November 5, 1996, to elect the members of the state of Texas's delegation to the United States House of Representatives. Texas had thirty seats in the House, apportioned according to the 1990 United States census.
The 1986 United States House of Representatives elections in Texas occurred on November 4, 1986, to elect the members of the state of Texas's delegation to the United States House of Representatives. Texas had twenty-seven seats in the House, apportioned according to the 1980 United States census.
The 1978 United States House of Representatives elections in Texas occurred on November 7, 1978, to elect the members of the state of Texas's delegation to the United States House of Representatives. Texas had twenty-four seats in the House apportioned according to the 1970 United States census.
The 1994 United States House of Representatives elections in Texas occurred on November 8, 1994, to elect the members of the state of Texas's delegation to the United States House of Representatives. Texas had thirty seats in the House, apportioned according to the 1990 United States census.
The 1974 United States House of Representatives elections in Texas occurred on November 5, 1974, to elect the members of the state of Texas's delegation to the United States House of Representatives. Texas had twenty-four seats in the House apportioned according to the 1970 United States census.
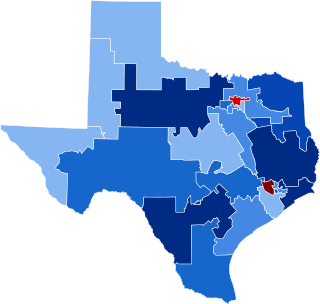
The 1976 United States House of Representatives elections in Texas occurred on November 2, 1976, to elect the members of the state of Texas's delegation to the United States House of Representatives. Texas had twenty-four seats in the House apportioned according to the 1970 United States census.
Texas House of Representatives districts, Texas Senate districts, Texas Board of Education districts, and Texas's congressional districts are redistricted once every decade, usually in the year after the decennial United States census. According to the Texas Constitution, redistricting in Texas follows the regular legislative process; it must be passed by both houses of the Texas Legislature and signed by the governor of Texas—unless the legislature has sufficient votes to override a gubernatorial veto. Like many other states in the American South after the passage of the Voting Rights Act of 1965, federal judges and the United States Supreme Court have struck down Texas's congressional and legislative districts on multiple occasions, including in the 1960s, 1970s, 1980s, 1990s, and 2000s.
{{cite journal}}
: Cite journal requires |journal=
(help)