2008 United States presidential election in Texas

Last updated

2008 United States presidential election in Texas
Flag of Texas.svg
  2004 November 4, 2008 2012  
Turnout59.5% (of registered voters) Increase2.svg
45.5% (of voting age population) [1]
  John McCain 2009 Official.jpg Obama portrait crop.jpg
Nominee John McCain Barack Obama
Party Republican Democratic
Home state Arizona Illinois
Running mate Sarah Palin Joe Biden
Electoral vote340
Popular vote4,479,3283,528,633
Percentage55.38%43.63%

Texas Presidential Election Results 2008.svg
2008 US Presidential election in Texas by congressional district.svg
2008 TX Pres.svg

President before election

George W. Bush
Republican

Elected President

Barack Obama
Democratic

The 2008 United States presidential election in Texas took place on November 4, 2008, and was part of the 2008 United States presidential election. Voters chose 34 representatives, or electors to the Electoral College, who voted for president and vice president.

Contents

Texas was won by Republican nominee John McCain by an 11.8% margin of victory despite "failing to deliver written certification of their nominations" on time to appear on the ballot. Barack Obama, the Democratic nominee and eventual President, made a similar error. [2]

Prior to the election, all 17 news organizations considered this a state McCain would win, or a safe red state. Although the state is very diverse and has a huge Latino population, Latinos in Texas, despite being fairly Democratic, make up only 20% of the electorate. Polling throughout the state showed McCain consistently and substantially leading Obama. On Election Day, McCain easily won the state, although his margin of victory was significantly less than that of George W. Bush in 2000 or 2004. This was the first election since 1996 in which the margin of victory was less than one million votes. Regardless, with its 34 electoral votes, Texas was the largest prize for McCain in 2008. This was the first time since 1924 that Texas gave a majority of the vote to a losing candidate.

As of the 2020 presidential election , this is the last time the Democratic candidate won Brewster County and the last in which Kenedy County voted for the winning candidate.

Primaries

Campaign

Predictions

There were 16 news organizations who made state-by-state predictions of the election. Here are their last predictions before election day:

SourceRanking
D.C. Political Report [3] Likely R
Cook Political Report [4] Solid R
The Takeaway [5] Solid R
Electoral-vote.com [6] Solid R
Washington Post [7] Solid R
Politico [8] Solid R
RealClearPolitics [9] Solid R
FiveThirtyEight [7] Solid R
CQ Politics [10] Solid R
The New York Times [11] Solid R
CNN [12] Safe R
NPR [7] Solid R
MSNBC [7] Solid R
Fox News [13] Likely R
Associated Press [14] Likely R
Rasmussen Reports [15] Safe R

Polling

McCain won every single pre-election poll. The final 3 polls averaged McCain leading 52% to 41%. [16]

Fundraising

Obama raised $20,424,500. McCain raised $17,990,153. [17]

Advertising and visits

Obama and his interest groups spent $9,917,565. McCain and his interest groups spent $33,983. [18] Both campaigns visited the state twice. [19]

Analysis

Voter casting a ballot in Texas Larsz - US election 08 (by-sa).jpg
Voter casting a ballot in Texas

Texas, split between the south and southwest regions of the United States, has become a consistently Republican state at all levels and is the home state of then President George W. Bush. Economically and racially diverse, Texas includes a very large swath of the Bible Belt, a region in which many voters, especially those in rural areas, identify as born-again or evangelical Christians, and tend to vote Republican due to their socially conservative views. Although once part of the Solid South, Texas has not voted for a Democratic presidential nominee since Jimmy Carter in 1976.

McCain did well throughout the state, winning the vast majority of counties by double digits. He took aknots every county in Eastern Texas, including many traditionally-Democratic areas. All the suburbs of the major cities voted Republican by large margins. He also dominated the Texas Panhandle (including Amarillo), the Permian Basin (including Midland and Odessa) and the South Plains (including Lubbock), three of the most conservative regions in the country. He won these three regions by margins of three-to-one—his largest margin of victory in the entire country. [20] These areas had been among the first in Texas where the old-line conservative Democrats started splitting their tickets and voting Republican nationally; some counties in this region haven't supported a Democrat since Harry S. Truman in 1948. King County, a thinly populated county near the Panhandle, gave McCain 92.64% of the vote to Obama's 4.91%, McCain's best margin in any county in the nation.

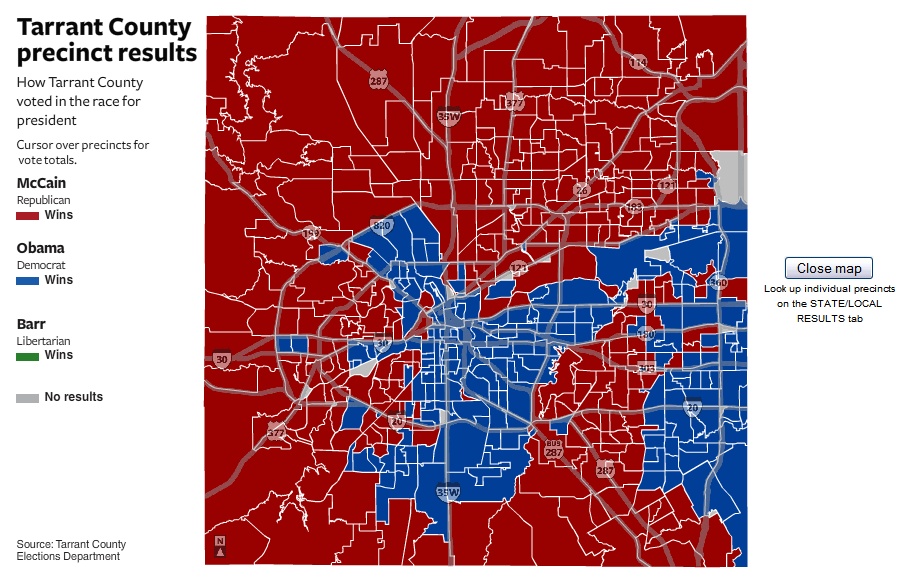
Despite the expected loss, Obama improved substantially upon John Kerry's performance in 2004, narrowing the margin of victory from 22.83% down to 11.77%. He was able to flip major urban counties such as Dallas, Bexar and Harris counties—home to the cities of Dallas, San Antonio, and Houston respectively. Dallas and Harris had been among the first areas of the state to turn Republican, largely due to an influx of Northern expatriates in the 1940s and 1950s. Neither county had supported a Democrat for president since 1964. Bexar had last gone Democratic in 1996. [21] A strong turnout of minority voters gave Obama the edge in these three counties. Obama also performed strongly in Travis County, which contains the state capital and liberal bastion of Austin; El Paso County, which contains the city of El Paso, due in large part to heavy support by Hispanics; and many of the Latino-majority counties in the Rio Grande Valley along the border with Mexico, which have strongly supported Democrats for decades. Although Obama lost Tarrant county, he did do well in the southern and eastern parts of Fort Worth and the eastern part of Arlington. [22]

During the same election, incumbent Republican U.S. Senator John Cornyn was reelected with 54.82% of the vote to Democrat Rick Noriega’s 42.84%. Libertarian Yvonne Adams Schick received the remaining 2.34%. Republicans also knocked off a Democratic incumbent from Texas in the U.S. House of Representatives. At the state level, however, Democrats picked up three seats in the Texas House of Representatives and one seat in the Texas Senate.

Results

2008 United States presidential election in Texas
PartyCandidateRunning mateVotesPercentageElectoral votes
Republican John McCain Sarah Palin 4,479,32855.45%34
Democratic Barack Obama Joe Biden 3,528,63343.68%0
Libertarian Bob Barr Wayne Allyn Root 56,1160.69%0
Write-ins Write-insWrite-ins9,3730.12%0
Independent Ralph Nader Matt Gonzalez 5,7510.07%0
Constitution Chuck Baldwin Darrell Castle5,7080.07%0
OthersOthersOthers1,1340.01%0
Green Cynthia McKinney Rosa Clemente 9090.01%0
Totals8,086,952100.00%34
Voter turnout (voting age population)46.8%

By county

CountyJohn McCain
Republican
Barack Obama
Democratic
Various candidates
Other parties
MarginTotal
#%#%#%#%
Anderson 11,88471.35%4,63027.80%1410.85%7,25443.55%16,655
Andrews 3,81682.44%79017.07%230.49%3,02665.37%4,629
Angelina 19,56967.13%9,37932.17%2050.70%10,19034.96%29,153
Aransas 6,69368.45%3,00630.74%790.81%3,68737.71%9,778
Archer 3,59582.36%74016.95%300.69%2,85565.41%4,365
Armstrong 85686.46%12812.93%60.61%72873.53%990
Atascosa 5,46254.96%4,41544.43%610.61%1,04710.53%9,938
Austin 8,78674.96%2,82124.07%1140.97%5,96550.89%11,721
Bailey 1,61869.86%68229.45%160.69%93640.41%2,316
Bandera 6,93574.59%2,25024.20%1121.21%4,68550.39%9,297
Bastrop 13,81753.02%11,68744.84%5582.14%2,1308.18%26,062
Baylor 1,26276.81%36622.28%150.91%89654.53%1,643
Bee 4,47154.81%3,64544.69%410.50%82610.12%8,157
Bell 49,24254.36%40,41344.61%9351.03%8,8299.75%90,590
Bexar 246,27546.69%275,52752.23%5,6901.08%-29,252-5.54%527,492
Blanco 3,41869.20%1,46729.70%541.10%1,95139.50%4,939
Borden 31687.53%4011.08%51.39%27676.45%361
Bosque 5,76275.36%1,79723.50%871.14%3,96551.86%7,646
Bowie 24,16268.67%10,81530.74%2090.59%13,34737.93%35,186
Brazoria 67,51564.34%36,48034.76%9450.90%31,03529.58%104,940
Brazos 37,46563.85%20,50234.94%7061.21%16,96328.91%58,673
Brewster 1,85547.56%1,97050.51%751.93%-115-2.95%3,900
Briscoe 61774.34%20524.70%80.96%41249.64%830
Brooks 55624.08%1,74775.66%60.26%-1,191-51.58%2,309
Brown 12,05279.95%2,82218.72%2001.33%9,23061.23%15,074
Burleson 4,54768.22%2,05330.80%650.98%2,49437.42%6,665
Burnet 12,05971.38%4,60827.28%2261.34%7,45144.10%16,893
Caldwell 6,10752.43%5,40346.39%1381.18%7046.04%11,648
Calhoun 4,10659.69%2,72939.67%440.64%1,37720.02%6,879
Callahan 4,58980.28%1,06318.60%641.12%3,52661.68%5,716
Cameron 26,67135.06%48,48063.72%9261.22%-21,809-28.66%76,077
Camp 2,79861.27%1,73437.97%350.76%1,06423.30%4,567
Carson 2,54885.50%40613.62%260.88%2,14271.88%2,980
Cass 8,27969.89%3,49029.46%770.65%4,78940.43%11,846
Castro 1,56268.18%71931.38%100.44%84336.80%2,291
Chambers 9,98875.14%3,18823.98%1160.88%6,80051.16%13,292
Cherokee 11,69571.24%4,61028.08%1120.68%7,08543.16%16,417
Childress 1,78277.61%49721.65%170.74%1,28555.96%2,296
Clay 4,21378.91%1,08520.32%410.77%3,12858.59%5,339
Cochran 75871.71%28426.87%151.42%47444.84%1,057
Coke 1,25279.80%29919.06%181.14%95360.74%1,569
Coleman 3,01181.33%64317.37%481.30%2,36863.96%3,702
Collin 184,89762.16%109,04736.66%3,5131.18%75,85025.50%297,457
Collingsworth 94378.91%23419.58%181.51%70959.33%1,195
Colorado 5,79569.38%2,50830.03%500.59%3,28739.35%8,353
Comal 35,23373.01%12,38425.66%6441.33%22,84947.35%48,261
Comanche 3,81373.09%1,33425.57%701.34%2,47947.52%5,217
Concho 80774.93%25723.86%131.21%55051.07%1,077
Cooke 11,87178.86%3,05120.27%1320.87%8,82058.59%15,054
Coryell 11,55063.00%6,61936.11%1630.89%4,93126.89%18,332
Cottle 50972.20%18726.52%91.28%32245.68%705
Crane 1,11976.96%31921.94%161.10%80055.02%1,454
Crockett 1,02666.41%51233.14%70.45%51433.27%1,545
Crosby 1,22163.79%68435.74%90.47%53728.05%1,914
Culberson 25733.86%49264.82%101.32%-235-30.96%759
Dallam 1,26979.86%30219.01%181.13%96760.85%1,589
Dallas 310,00041.89%422,98957.15%7,0850.96%-112,989-15.26%740,074
Dawson 2,90670.95%1,15228.13%380.92%1,75442.82%4,096
Deaf Smith 3,46673.06%1,24726.29%310.65%2,21946.77%4,744
Delta 1,58072.25%58926.93%180.82%99145.32%2,187
Denton 149,93561.63%91,16037.47%2,1680.90%58,77524.16%243,263
DeWitt 4,88873.77%1,71625.90%220.33%3,17247.87%6,626
Dickens 73075.10%23424.07%80.83%49651.03%972
Dimmit 87424.37%2,69275.05%210.58%-1,818-50.68%3,587
Donley 1,37481.30%29117.22%251.48%1,08364.08%1,690
Duval 1,07624.40%3,29874.80%350.80%-2,222-50.40%4,409
Eastland 5,16579.35%1,27119.53%731.12%3,89459.82%6,509
Ector 26,19973.49%9,12325.59%3290.92%17,07647.90%35,651
Edwards 67365.02%34633.43%161.55%32731.59%1,035
El Paso 61,78333.28%122,02165.73%1,8260.99%-60,238-32.45%185,630
Ellis 38,07870.71%15,33328.47%4420.82%22,74542.24%53,853
Erath 10,76876.81%3,12822.31%1230.88%7,64054.50%14,019
Falls 3,32859.44%2,22539.74%460.82%1,10319.70%5,599
Fannin 8,09269.20%3,46429.62%1381.18%4,62839.58%11,694
Fayette 7,58270.43%3,01428.00%1691.57%4,56842.43%10,765
Fisher 1,08360.71%68738.51%140.78%39622.20%1,784
Floyd 1,78470.77%73028.96%70.27%1,05441.81%2,521
Foard 32760.78%19836.80%132.42%12923.98%538
Fort Bend 103,20650.89%98,36848.50%1,2480.61%4,8382.39%202,822
Franklin 3,39275.53%1,03623.07%631.40%2,35652.46%4,491
Freestone 5,20571.42%2,03427.91%490.67%3,17143.51%7,288
Frio 1,64440.47%2,40559.21%130.32%-761-18.74%4,062
Gaines 3,38583.23%65015.98%320.79%2,73567.25%4,067
Galveston 62,25859.29%41,80539.81%9410.90%20,45319.48%105,004
Garza 1,35677.49%37521.43%191.08%98156.06%1,750
Gillespie 9,56377.51%2,57620.88%1991.61%6,98756.63%12,338
Glasscock 50290.13%529.34%30.53%45080.79%557
Goliad 2,29862.87%1,32936.36%280.77%96926.51%3,655
Gonzales 4,07664.83%2,16734.47%440.70%1,90930.36%6,287
Gray 6,92485.13%1,15314.18%560.69%5,77170.95%8,133
Grayson 31,13668.33%13,90030.51%5281.16%17,23637.82%45,564
Gregg 29,20368.54%13,16630.90%2410.56%16,03737.64%42,610
Grimes 5,56266.83%2,70432.49%560.68%2,85834.34%8,322
Guadalupe 30,86964.91%16,15633.97%5351.12%14,71330.94%47,560
Hale 7,17172.12%2,70827.24%640.64%4,46344.88%9,943
Hall 93073.58%32425.63%100.79%60647.95%1,264
Hamilton 2,87676.12%86322.84%391.04%2,01353.28%3,778
Hansford 1,84787.87%24011.42%150.71%1,60776.45%2,102
Hardeman 1,19975.17%37323.39%231.44%82651.78%1,595
Hardin 16,60380.20%3,93919.03%1600.77%12,66461.17%20,702
Harris 571,88348.82%590,98250.45%8,6070.73%-19,099-1.63%1,171,472
Harrison 17,10365.38%8,88733.97%1680.65%8,21631.41%26,158
Hartley 1,71186.20%25012.59%241.21%1,46173.61%1,985
Haskell 1,38865.60%69933.03%291.37%68932.57%2,116
Hays 29,63850.19%28,43148.15%9831.66%1,2072.04%59,052
Hemphill 1,34585.67%21613.76%90.57%1,12971.91%1,570
Henderson 20,85771.94%7,91327.29%2230.77%12,94444.65%28,993
Hidalgo 39,66830.29%90,26168.92%1,0430.79%-50,593-38.63%130,972
Hill 9,26470.25%3,81128.90%1130.85%5,45341.35%13,188
Hockley 5,79575.80%1,79723.51%530.69%3,99852.29%7,645
Hood 17,29976.46%5,08722.48%2381.06%12,21253.98%22,624
Hopkins 9,29971.98%3,53027.32%900.70%5,76944.66%12,919
Houston 5,87268.09%2,65630.80%961.11%3,21637.29%8,624
Howard 7,02972.55%2,54526.27%1151.18%4,48446.28%9,689
Hudspeth 45851.00%43047.88%101.12%283.12%898
Hunt 20,57369.68%8,59429.11%3571.21%11,97940.57%29,524
Hutchinson 7,36184.02%1,32215.09%780.89%6,03968.93%8,761
Irion 64478.82%16420.07%91.11%48058.75%817
Jack 2,52883.63%47015.55%250.82%2,05868.08%3,023
Jackson 3,72373.46%1,30125.67%440.87%2,42247.79%5,068
Jasper 9,02270.62%3,65828.63%960.75%5,36441.99%12,776
Jeff Davis 74960.60%46837.86%191.54%28122.74%1,236
Jefferson 42,90548.52%44,88850.76%6370.72%-1,983-2.24%88,430
Jim Hogg 47226.01%1,33673.61%70.38%-864-47.60%1,815
Jim Wells 4,84141.69%6,70657.75%650.56%-1,865-16.06%11,612
Johnson 36,68573.30%12,91225.80%4530.90%23,77347.50%50,050
Jones 4,20372.37%1,52826.31%771.32%2,67546.06%5,808
Karnes 2,73660.44%1,76038.88%310.68%97621.56%4,527
Kaufman 23,73567.53%11,16131.76%2490.71%12,57435.77%35,145
Kendall 12,97177.46%3,59921.49%1761.05%9,37255.97%16,746
Kenedy 9446.53%10853.47%00.00%-14-6.94%202
Kent 34276.34%9922.10%71.56%24354.24%448
Kerr 16,75274.27%5,57024.69%2341.04%11,18249.58%22,556
Kimble 1,48780.68%34218.56%140.76%1,14562.12%1,843
King 15192.64%84.91%42.45%14387.73%163
Kinney 90758.48%63340.81%110.71%27417.67%1,551
Kleberg 4,54045.97%5,25653.22%800.81%-716-7.25%9,876
Knox 98672.08%36726.83%151.09%61945.25%1,368
Lamar 12,95270.54%5,24328.55%1670.91%7,70941.99%18,362
Lamb 3,34473.90%1,15625.55%250.55%2,18848.35%4,525
Lampasas 5,65174.02%1,90324.93%801.05%3,74849.09%7,634
La Salle 71440.20%1,05259.23%100.57%-338-19.03%1,776
Lavaca 6,29376.30%1,86922.66%861.04%4,42453.64%8,248
Lee 4,31267.62%2,00031.36%651.02%2,31236.26%6,377
Leon 5,56679.05%1,41820.14%570.81%4,14858.91%7,041
Liberty 15,44871.23%5,99127.62%2481.15%9,45743.61%21,687
Limestone 5,07966.20%2,51632.79%771.01%2,56333.41%7,672
Lipscomb 1,09387.02%15512.34%80.64%93874.68%1,256
Live Oak 3,09574.11%1,04825.10%330.79%2,04749.01%4,176
Llano 7,28175.62%2,25023.37%981.01%5,03152.25%9,629
Loving 6784.81%1215.19%00.00%5569.62%79
Lubbock 66,30467.98%30,48631.26%7440.76%35,81836.72%97,534
Lynn 1,47369.61%62729.63%160.76%84639.98%2,116
Madison 2,89170.96%1,14628.13%370.91%1,74542.83%4,074
Marion 2,56760.37%1,64438.66%410.97%92321.71%4,252
Martin 1,38980.99%31418.31%120.70%1,07562.68%1,715
Mason 1,54472.80%54625.74%311.46%99847.06%2,121
Matagorda 7,83563.32%4,44035.88%980.80%3,39527.44%12,373
Maverick 2,31621.17%8,55478.20%690.63%-6,238-57.03%10,939
McCulloch 2,26375.18%72824.19%190.63%1,53550.99%3,010
McLennan 49,04461.56%29,99837.65%6320.79%19,04623.91%79,674
McMullen 40074.49%13224.58%50.93%26849.91%537
Medina 10,48066.59%5,14732.71%1100.70%5,33333.88%15,737
Menard 71269.94%29528.98%111.08%41740.96%1,018
Midland 36,15578.13%9,69120.94%4280.93%26,46457.19%46,274
Milam 5,21762.43%3,04436.42%961.15%2,17326.01%8,357
Mills 1,75380.52%39818.28%261.20%1,35562.24%2,177
Mitchell 1,81574.66%58624.11%301.23%1,22950.55%2,431
Montague 6,24578.55%1,59720.09%1081.36%4,64858.46%7,950
Montgomery 119,88475.76%36,70323.19%1,6641.05%83,18152.57%158,251
Moore 4,28278.76%1,12320.65%320.59%3,15958.11%5,437
Morris 3,15860.18%2,05539.16%350.66%1,10321.02%5,248
Motley 52287.88%6711.28%50.84%45576.60%594
Nacogdoches 14,82863.39%8,39335.88%1700.73%6,43527.51%23,391
Navarro 10,81066.23%5,40033.09%1110.68%5,41033.14%16,321
Newton 3,44665.51%1,75133.29%631.20%1,69532.22%5,260
Nolan 3,48568.83%1,52130.04%571.13%1,96438.79%5,063
Nueces 52,39151.75%47,91247.33%9270.92%4,4794.42%101,230
Ochiltree 2,85191.70%2437.82%150.48%2,60883.88%3,109
Oldham 81388.37%10211.09%50.54%71177.28%920
Orange 21,50973.14%7,64626.00%2510.86%13,86347.14%29,406
Palo Pinto 7,26473.45%2,49925.27%1271.28%4,76548.18%9,890
Panola 7,58274.22%2,58625.31%480.47%4,99648.91%10,216
Parker 36,97477.11%10,50221.90%4750.99%26,47255.21%47,951
Parmer 2,96979.96%71919.36%250.68%2,25060.60%3,713
Pecos 2,48061.85%1,47636.81%541.34%1,00425.04%4,010
Polk 13,73168.15%6,23030.92%1880.93%7,50137.23%20,149
Potter 20,76169.17%8,93929.78%3131.05%11,82239.39%30,013
Presidio 48927.83%1,25271.26%160.91%-763-43.43%1,757
Rains 3,14674.27%1,04824.74%420.99%2,09849.53%4,236
Randall 41,94880.93%9,46818.27%4160.80%32,48062.66%51,832
Reagan 79579.98%19719.82%20.20%59860.16%994
Real 1,23876.04%37523.03%150.93%86353.01%1,628
Red River 3,46168.51%1,53930.46%521.03%1,92238.05%5,052
Reeves 1,44546.96%1,60652.19%260.85%-161-5.23%3,077
Refugio 1,85556.88%1,38242.38%240.74%47314.50%3,261
Roberts 47792.08%417.92%00.00%43684.16%518
Robertson 3,98059.31%2,67539.87%550.82%1,30519.44%6,710
Rockwall 23,30072.45%8,49226.40%3701.15%14,80846.05%32,162
Runnels 3,11880.63%72018.62%290.75%2,39862.01%3,867
Rusk 13,64672.89%4,98326.62%930.49%8,66346.27%18,722
Sabine 3,74976.92%1,07722.10%480.98%2,67254.82%4,874
San Augustine 2,34263.04%1,32835.75%451.21%1,01427.29%3,715
San Jacinto 6,15168.66%2,72130.38%860.96%3,43038.28%8,958
San Patricio 12,40457.97%8,85441.38%1380.65%3,55016.59%21,396
San Saba 1,94179.00%48719.82%291.18%1,45459.18%2,457
Schleicher 97074.39%32424.85%100.76%64649.54%1,304
Scurry 4,41479.26%1,08819.54%671.20%3,32659.72%5,569
Shackelford 1,28485.32%20813.82%130.86%1,07671.50%1,505
Shelby 6,63071.91%2,54827.64%420.45%4,08244.27%9,220
Sherman 88486.67%12712.45%90.88%75774.22%1,020
Smith 55,18769.36%23,72629.82%6480.82%31,46139.54%79,561
Somervell 2,67775.77%79922.62%571.61%1,87853.15%3,533
Starr 1,49215.24%8,27484.50%260.26%-6,782-69.26%9,792
Stephens 2,86981.37%62617.75%310.88%2,24363.62%3,526
Sterling 52084.01%9715.67%20.32%42368.34%619
Stonewall 52471.29%20628.03%50.68%31843.26%735
Sutton 1,18975.35%38124.14%80.51%80851.21%1,578
Swisher 1,68366.39%81332.07%391.54%87034.32%2,535
Tarrant 348,42055.43%274,88043.73%5,2530.84%73,54011.70%628,553
Taylor 34,31772.34%12,69026.75%4320.91%21,62745.59%47,439
Terrell 32362.24%18635.84%101.92%13726.40%519
Terry 2,87967.27%1,37932.22%220.51%1,50035.05%4,280
Throckmorton 67180.07%16619.81%10.12%50560.26%838
Titus 6,02865.20%3,14534.02%720.78%2,88331.18%9,245
Tom Green 27,36270.41%11,15828.71%3410.88%16,20441.70%38,861
Travis 136,98134.25%254,01763.52%8,8902.23%-117,036-29.27%399,888
Trinity 4,09567.39%1,92531.68%570.93%2,17035.71%6,077
Tyler 5,64471.35%2,16627.38%1001.27%3,47843.97%7,910
Upshur 11,22274.00%3,79024.99%1521.01%7,43249.01%15,164
Upton 89875.02%28824.06%110.92%61050.96%1,197
Uvalde 4,59052.36%4,12647.07%500.57%4645.29%8,766
Val Verde 5,75244.87%6,98254.46%860.67%-1,230-9.59%12,820
Van Zandt 15,73477.15%4,50522.09%1560.76%11,22955.06%20,395
Victoria 19,87866.22%9,83232.75%3101.03%10,04633.47%30,020
Walker 11,62360.71%7,33438.31%1890.98%4,28922.40%19,146
Waller 8,26553.30%7,15346.12%900.58%1,1127.18%15,508
Ward 2,66774.04%89924.96%361.00%1,76849.08%3,602
Washington 10,17670.78%4,03428.06%1671.16%6,14242.72%14,377
Webb 13,11928.02%33,45271.45%2500.53%-20,333-43.43%46,821
Wharton 9,43165.41%4,93734.24%500.35%4,49431.17%14,418
Wheeler 1,91885.43%31413.99%130.58%1,60471.44%2,245
Wichita 31,73169.01%13,86830.16%3830.83%17,86338.85%45,982
Wilbarger 3,28372.81%1,19626.52%300.67%2,08746.29%4,509
Willacy 1,45629.70%3,40969.53%380.77%-1,953-39.83%4,903
Williamson 88,32355.49%67,69142.53%3,1521.98%20,63212.96%159,166
Wilson 10,90466.63%5,36232.76%1000.61%5,54233.87%16,366
Winkler 1,52975.25%47723.47%261.28%1,05251.78%2,032
Wise 15,97377.39%4,47121.66%1950.95%11,50255.73%20,639
Wood 13,65876.80%4,01022.55%1160.65%9,64854.25%17,784
Yoakum 1,98980.92%45018.31%190.77%1,53962.61%2,458
Young 5,94281.34%1,30317.84%600.82%4,63963.50%7,305
Zapata 91932.07%1,93967.66%80.27%-1,020-35.59%2,866
Zavala 59615.38%3,26384.18%170.44%-2,667-68.80%3,876
Totals4,479,32855.38%3,528,63343.63%79,8300.99%950,69511.75%8,087,791
County flips:
Democratic
Hold
Gain from Republican
Republican
Hold Texas County Flips 2008.svg
County flips:

Counties that flipped from Republican to Democratic

By congressional district

John McCain carried 21 of the state's 32 congressional districts, including one district held by a Democrat.

DistrictMcCainObamaRepresentative
1st 68.93%30.53% Louie Gohmert
2nd 59.75%39.69% Ted Poe
3rd 57.58%41.73% Sam Johnson
4th 69.10%30.17% Ralph Hall
5th 63.33%36.05% Jeb Hensarling
6th 59.77%39.59% Joe Barton
7th 58.36%40.94% John Culberson
8th 73.76%25.53% Kevin Brady
9th 22.54%77.08% Al Green
10th 54.96%44.18% Michael McCaul
11th 75.47%23.75% Mike Conaway
12th 62.90%36.36% Kay Granger
13th 76.54%22.71% Mac Thornberry
14th 66.27%33.08% Ron Paul
15th 39.63%59.82% Rubén Hinojosa
16th 33.57%65.81% Silvestre Reyes
17th 67.21%32.02% Chet Edwards
18th 22.19%77.37% Sheila Jackson Lee
19th 71.93%27.36% Randy Neugebauer
20th 35.65%63.59% Charlie Gonzalez
21st 58.49%40.71% Lamar S. Smith
22nd 58.23%41.14% Nick Lampson (110th Congress)
Pete Olson (111th Congress)
23rd 48.12%50.92% Ciro Rodriguez
24th 54.96%44.37% Kenny Marchant
25th 39.71%59.15% Lloyd Doggett
26th 58.00%41.33% Michael C. Burgess
27th 45.98%53.32% Solomon Ortiz
28th 43.53%55.93% Henry Cuellar
29th 37.73%61.65% Gene Green
30th 17.92%81.69% Eddie Bernice Johnson
31st 57.51%41.53% John Carter
32nd 53.03%46.21% Pete Sessions

Electors

Technically the voters of Texas cast their ballots for electors: representatives to the Electoral College. Texas is allocated 34 electors because it has 32 congressional districts and 2 senators. All candidates who appear on the ballot or qualify to receive write-in votes must submit a list of 34 electors, who pledge to vote for their candidate and his or her running mate. Whoever wins the majority of votes in the state is awarded all 34 electoral votes. Their chosen electors then vote for president and vice president. Although electors are pledged to their candidate and running mate, they are not obligated to vote for them. [23] An elector who votes for someone other than his or her candidate is known as a faithless elector.

The electors of each state and the District of Columbia met on December 15, 2008, to cast their votes for president and vice president. The Electoral College itself never meets as one body. Instead the electors from each state and the District of Columbia met in their respective capitols.

The following were the members of the Electoral College from the state. All 34 were pledged to John McCain and Sarah Palin: [24] [25] [26]

  1. Marcia Daughtrey
  2. Virgil Vickery
  3. Charlie O'Reilly
  4. Brenda Zielke
  5. Mary Darby
  6. Melba McDow
  7. Paul Pressler
  8. Deborah Cupples
  9. Frank Alvarez
  10. Russ Duerstine
  11. Zan Prince
  12. Bruce Harris
  13. Gordon Starkenburg
  14. Sandra Cararas
  15. Donene O'Dell
  16. Larry Lovelace
  17. Nelda Eppes
  18. Kenneth Corbin
  19. Gene Ryder
  20. Robert Hierynomus
  21. Terese Raia
  22. Arturo Martinez de Vara
  23. Thomas Ferguson
  24. Robert Long
  25. Pat Peale
  26. Joel Yowell
  27. Judith Hooge
  28. Giovanna Searcy
  29. Patricia Ann Van Winkle
  30. Ronny Risinger
  31. Frank Eikenburg
  32. Genny Hensz
  33. Talmadge Heflin

See also

Related Research Articles

<span class="mw-page-title-main">2004 United States presidential election in Texas</span> Election in Texas

The 2004 United States presidential election in Texas took place on November 2, 2004, and was part of the 2004 United States presidential election. State voters chose 34 representatives, or electors to the Electoral College, who voted for president and vice president.

<span class="mw-page-title-main">2008 United States presidential election in California</span>

The 2008 United States presidential election in California took place on November 4, 2008, in California as part of the 2008 United States presidential election. Voters chose 55 electors, the most out of any of the 50 states, to the Electoral College, who voted for president and vice president.

<span class="mw-page-title-main">2008 United States presidential election in Indiana</span> Election in Indiana

The 2008 United States presidential election in Indiana took place on November 4, 2008, and was part of the 2008 United States presidential election. Voters chose 11 representatives, or electors to the Electoral College, who voted for president and vice president.

<span class="mw-page-title-main">2008 United States presidential election in Colorado</span> Election in Colorado

The 2008 United States presidential election in Colorado took place on November 4, 2008, as a part of the 2008 United States presidential election throughout all 50 states and the District of Columbia. Voters chose nine representatives, or electors to the Electoral College, who voted for president and vice president.

<span class="mw-page-title-main">2008 United States presidential election in Utah</span> Election in Utah

The 2008 United States presidential election in Utah took place on November 4, 2008. It was part of the 2008 United States presidential election. Voters chose five representatives, or electors to the Electoral College, who voted for president and vice president.

<span class="mw-page-title-main">2008 United States presidential election in New Jersey</span> Election in New Jersey

The 2008 United States presidential election in New Jersey took place on November 4, 2008, and was part of the 2008 United States presidential election. Voters chose 15 representatives, or electors to the Electoral College, who voted for president and vice president.

<span class="mw-page-title-main">2008 United States presidential election in Wyoming</span> Election in Wyoming

The 2008 United States presidential election in Wyoming took place on November 4, 2008, and was part of the 2008 United States presidential election. Voters chose three representatives, or electors to the Electoral College, who voted for president and vice president.

<span class="mw-page-title-main">2008 United States presidential election in North Dakota</span> Election in North Dakota

The 2008 United States presidential election in North Dakota took place on November 4, 2008, and was part of the 2008 United States presidential election. Voters chose three representatives, or electors to the Electoral College, who voted for president and vice president.

<span class="mw-page-title-main">2008 United States presidential election in Montana</span> Election in Montana

The 2008 United States presidential election in Montana took place on November 4, 2008, and was part of the 2008 United States presidential election. Voters chose three representatives, or electors to the Electoral College, who voted for president and vice president.

<span class="mw-page-title-main">2008 United States presidential election in Ohio</span> Election in Ohio

The 2008 United States presidential election in Ohio took place on November 4, 2008, which was part of the 2008 United States presidential election. Voters chose 20 representatives, or electors to the Electoral College, who voted for president and vice president.

<span class="mw-page-title-main">2008 United States presidential election in Virginia</span> Election in Virginia

The 2008 United States presidential election in Virginia took place on November 4, 2008, which was part of the 2008 United States presidential election. Voters chose 13 representatives, or electors to the Electoral College, who voted for president and vice president.

<span class="mw-page-title-main">2008 United States presidential election in Arkansas</span> Election in Arkansas

The 2008 United States presidential election in Arkansas took place on November 4, 2008, and was part of the 2008 United States presidential election. State voters chose six representatives, or electors to the Electoral College, who voted for president and vice president.

<span class="mw-page-title-main">2008 United States presidential election in Idaho</span> Election in Idaho

The 2008 United States presidential election in Idaho took place on November 4, 2008, and was part of the 2008 United States presidential election. Voters chose four representatives, or electors to the Electoral College, who voted for president and vice president.

<span class="mw-page-title-main">2008 United States presidential election in Florida</span> Election in Florida

The 2008 United States presidential election in Florida took place on November 4, 2008, and was part of the 2008 United States presidential election. Voters chose 27 representatives, or electors to the Electoral College, who voted for president and vice president.

<span class="mw-page-title-main">2008 United States presidential election in Minnesota</span>

The 2008 United States presidential election in Minnesota took place on November 4, 2008, and was part of the 2008 United States presidential election. Voters chose ten representatives, or electors to the Electoral College, who voted for president and vice president.

<span class="mw-page-title-main">2008 United States presidential election in Georgia</span> Election in Georgia

The 2008 United States presidential election in Georgia took place on November 4, 2008. Voters chose 15 representatives, or electors to the Electoral College, who voted for president and vice president.

<span class="mw-page-title-main">2008 United States presidential election in Kansas</span> Election in Kansas

The 2008 United States presidential election in Kansas took place on November 4, 2008, and was part of the 2008 United States presidential election. Voters chose six representatives, or electors to the Electoral College, who voted for president and vice president.

<span class="mw-page-title-main">2008 United States presidential election in Kentucky</span> Election in Kentucky

The 2008 United States presidential election in Kentucky took place on November 4, 2008, and was part of the 2008 United States presidential election. Voters chose eight representatives, or electors to the Electoral College, who voted for president and vice president.

<span class="mw-page-title-main">2008 United States presidential election in Maryland</span> U.S. presidential election in Maryland

The 2008 United States presidential election in Maryland took place on November 4, 2008, and was part of the 2008 United States presidential election. Voters chose 10 representatives, or electors to the Electoral College, who voted for president and vice president.

<span class="mw-page-title-main">2008 United States presidential election in Michigan</span> Election in Michigan

The 2008 United States presidential election in Michigan took place on November 4, 2008. It was part of the 2008 United States presidential election which happened throughout all 50 states and D.C. Voters chose 17 representatives, or electors to the Electoral College, who voted for president and vice president.

References

  1. "Turnout and Voter Registration Figures (1970-current)".
  2. "Bob Barr sues to remove Obama, McCain from Texas ballot". September 16, 2008. Retrieved September 22, 2016.
  3. "D.C.'s Political Report: The complete source for campaign summaries". January 1, 2009. Archived from the original on January 1, 2009. Retrieved August 23, 2021.
  4. "Presidential". May 5, 2015. Archived from the original on May 5, 2015. Retrieved August 23, 2021.
  5. "Vote 2008 - The Takeaway - Track the Electoral College vote predictions". April 22, 2009. Archived from the original on April 22, 2009. Retrieved August 23, 2021.
  6. "Electoral-vote.com: President, Senate, House Updated Daily". electoral-vote.com. Retrieved August 23, 2021.
  7. 1 2 3 4 Based on Takeaway
  8. "POLITICO's 2008 Swing State Map - POLITICO.com". www.politico.com. Retrieved September 22, 2016.
  9. "RealClearPolitics - Electoral Map". Archived from the original on June 5, 2008.
  10. "CQ Presidential Election Maps, 2008". CQ Politics. Archived from the original on June 14, 2009. Retrieved December 20, 2009.
  11. Nagourney, Adam; Zeleny, Jeff; Carter, Shan (November 4, 2008). "The Electoral Map: Key States". The New York Times. Retrieved May 26, 2010.
  12. "October 2008 CNN Political Ticker - CNN.com Blogs". CNN. October 31, 2008. Archived from the original on June 19, 2010. Retrieved May 26, 2010.
  13. "Winning The Electoral College". Fox News. April 27, 2010.
  14. "roadto270". hosted.ap.org. Retrieved September 22, 2016.
  15. "Election 2008: Electoral College Update - Rasmussen Reports". www.rasmussenreports.com. Retrieved September 22, 2016.
  16. "Election 2008 Polls". Dave Leip's Atlas of U.S. Presidential Elections.
  17. "Presidential Campaign Finance". Archived from the original on March 24, 2009. Retrieved August 18, 2009.
  18. "Map: Campaign Ad Spending - Election Center 2008 from CNN.com". CNN. Retrieved May 26, 2010.
  19. "Map: Campaign Candidate Visits - Election Center 2008 from CNN.com". CNN. Retrieved May 26, 2010.
  20. Silver, Nate. "Messing With Texas". FiveThirtyEight. Retrieved May 17, 2009.
  21. Leip, David. "Presidential General Election Map Comparison: Texas". Atlas of U.S. Presidential Elections. Retrieved May 19, 2009.
  22. "Tarrant county election results by precinct, 2008".
  23. "Electoral College". California Secretary of State. Archived from the original on October 30, 2008. Retrieved November 1, 2008.
  24. "Archived copy" (PDF). Archived from the original (PDF) on November 28, 2008. Retrieved January 2, 2009.{{cite web}}: CS1 maint: archived copy as title (link)
  25. "U. S. Electoral College 2008 Certificate". www.archives.gov. Retrieved September 22, 2016.
  26. "U. S. Electoral College 2008 Certificate". www.archives.gov. Retrieved September 22, 2016.