Moore County, Texas

Last updated

Moore County
Moore County Texas Courthouse 2017.jpg
Moore County Courthouse in Dumas
Map of Texas highlighting Moore County.svg
Location within the U.S. state of Texas
Texas in United States.svg
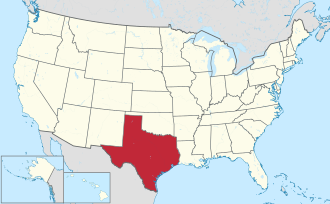
Texas's location within the U.S.
Coordinates: 35°50′N101°53′W / 35.84°N 101.89°W / 35.84; -101.89
CountryFlag of the United States.svg United States
StateFlag of Texas.svg Texas
Founded1892
Named after Edwin Ward Moore
Seat Dumas
Largest cityDumas
Government
  County JudgeRowdy Rhoades
Area
  Total
910 sq mi (2,400 km2)
  Land900 sq mi (2,000 km2)
  Water9.9 sq mi (26 km2)  1.1%
Population
 (2020)
  Total
21,358 Decrease2.svg
  Density23/sq mi (9/km2)
Time zone UTC−6 (Central)
  Summer (DST) UTC−5 (CDT)
Congressional district 13th
Website www.co.moore.tx.us

Moore County is a county located in the U.S. state of Texas. As of the 2020 census, its population was 21,358. [1] The county seat is Dumas. [2] The county was created in 1876 and organized in 1892. [3] It is named for Edwin Ward Moore, the commander of the Texas Navy. The Dumas micropolitan statistical area includes all of Moore County.

Contents

Moore County history is highlighted in the Window on the Plains Museum in Dumas.

History

100 million years ago, the land that Moore County encompasses was part of the Western Interior Seaway.

The people of the Antelope Creek Phase inhabited the Southeastern portion of Moore county in the Canadian River Valley, approximately from AD 1200 to 1450.

Geography

According to the U.S. Census Bureau, the county has a total area of 910 square miles (2,400 km2), of which 9.9 sq mi (26 km2) (1.1%) are covered by water. [4]

Major highways

Adjacent counties

National protected area

Demographics

Historical population
CensusPop.Note
1890 15
1900 2091,293.3%
1910 561168.4%
1920 5711.8%
1930 1,555172.3%
1940 4,461186.9%
1950 13,349199.2%
1960 14,77310.7%
1970 14,060−4.8%
1980 16,57517.9%
1990 17,8657.8%
2000 20,12112.6%
2010 21,9048.9%
2020 21,358−2.5%
U.S. Decennial Census [5]
1850–1900 [6] 1910 [7]
1920 [8] 1930 [9] 1940 [10]
1950 [11] 1960 [12] 1970 [13]
1980 [14] 1990 [15] 2000 [16]
2010 [17] 2020 [18]

2020 census

Moore County, Texas – Racial and ethnic composition
Note: the US Census treats Hispanic/Latino as an ethnic category. This table excludes Latinos from the racial categories and assigns them to a separate category. Hispanics/Latinos may be of any race.
Race / Ethnicity (NH = Non-Hispanic)Pop 2000 [19] Pop 2010 [20] Pop 2020 [18] % 2000% 2010% 2020
White alone (NH)10,0388,3706,49949.89%38.21%30.43%
Black or African American alone (NH)892876540.44%1.31%3.06%
Native American or Alaska Native alone (NH)77107970.38%0.49%0.45%
Asian alone (NH)1661,3239820.83%6.04%4.60%
Native Hawaiian or Pacific Islander alone (NH)51810.02%0.08%0.00%
Other race alone (NH)2561830.12%0.28%0.39%
Mixed race or Multiracial (NH)1631963950.81%0.89%1.85%
Hispanic or Latino (any race)9,55811,54212,64747.50%52.69%59.21%
Total20,12121,90421,358100.00%100.00%100.00%

2000 Census

At the 2000 census, 20,121 people, 6,774 households, and 5,331 families were in the county. The population density was 22 people/sq mi (8.5 people/km2). There were 7,478 housing units at an average density of 8 units per square mile (3.1/km2). The racial makeup of the county was 63.93% White, 0.69% Black or African American, 0.67% Native American, 0.86% Asian, 0.03% Pacific Islander, 31.20% from other races, and 2.62% from two or more races. 47.50% of the population were Hispanic or Latino of any race. [21] Of the 6,774 households 44.80% had children under the age of 18 living with them, 65.10% were married couples living together, 9.00% had a female householder with no husband present, and 21.30% were non-families. 18.20% of households were one person and 8.30% were one person aged 65 or older. The average household size was 2.94 and the average family size was 3.36.

The age distribution was 33.60% under 18, 9.20% from 18 to 24, 28.40% from 25 to 44, 18.30% from 45 to 64, and 10.60% 65 or older. The median age was 30 years. For every 100 females, there were 100.60 males. For every 100 females age 18 and over, there were 97.40 males.

The median household income was $34,852 and the median family income was $37,985. Males had a median income of $29,843 versus $19,383 for females. The per capita income for the county was $15,214. About 10.10% of families and 13.50% of the population were below the poverty line, including 18.10% of those under age 18 and 10.90% of those age 65 or over.

Politics

Moore County is a strongly Republican county, having given Senator John McCain 78.76% of the vote, over only 20.65% for Barack Obama in 2008. It also gave George W. Bush (R) 81.75% over 17.93% John Kerry (D) in 2004. [22]

United States presidential election results for Moore County, Texas [23]
Year Republican Democratic Third party(ies)
No.%No.%No.%
1912 56.85%5778.08%1115.07%
1916 65.50%10394.50%00.00%
1920 1311.30%10187.83%10.87%
1924 99.78%8289.13%11.09%
1928 8741.23%12458.77%00.00%
1932 569.23%54990.44%20.33%
1936 477.45%58392.39%10.16%
1940 22418.84%95980.66%60.50%
1944 31322.45%99971.66%825.88%
1948 32315.37%1,74883.20%301.43%
1952 1,90947.31%2,11452.39%120.30%
1956 1,82044.95%2,21954.80%100.25%
1960 2,46361.19%1,54738.43%150.37%
1964 1,76242.37%2,39357.54%40.10%
1968 2,37847.60%1,35927.20%1,25925.20%
1972 3,62079.77%86319.02%551.21%
1976 2,75949.49%2,76749.63%490.88%
1980 3,73666.92%1,74331.22%1041.86%
1984 4,64980.21%1,12919.48%180.31%
1988 3,71070.25%1,53729.10%340.64%
1992 3,14757.24%1,36124.75%99018.01%
1996 3,35365.96%1,35826.72%3727.32%
2000 4,20179.41%1,04019.66%490.93%
2004 4,60181.75%1,00917.93%180.32%
2008 4,28278.76%1,12320.65%320.59%
2012 3,96879.60%96419.34%531.06%
2016 3,97775.26%1,09820.78%2093.96%
2020 4,35979.01%1,06219.25%961.74%
2024 4,45883.02%86016.01%520.97%
United States Senate election results for Moore County, Texas1 [24]
Year Republican Democratic Third party(ies)
No.%No.%No.%
2024 4,18689.67%3748.01%1082.31%

Moore County is represented in the Texas House of Representatives by the Republican Walter Price, IV, elected on November 2, 2010. The district also includes the majority of neighboring Potter CountyAmarillo. Moore County is represented in the US house of representatives by Ronny Jackson (R), as it is a part of Texas's 13th congressional district.

Communities

Cities

Unincorporated community

Education

School districts: [25]

All of the county is in the service area of Amarillo College. [26]

See also

References

  1. "Moore County, Texas". United States Census Bureau . Retrieved February 23, 2021.
  2. "Find a County". National Association of Counties. Retrieved June 7, 2011.
  3. "Texas: Individual County Chronologies". Texas Atlas of Historical County Boundaries. The Newberry Library. 2008. Retrieved May 25, 2015.
  4. "2010 Census Gazetteer Files". United States Census Bureau. August 22, 2012. Retrieved May 4, 2015.
  5. "Decennial Census by Decade". US Census Bureau.
  6. "1900 Census of Population - Population of Texas By Counties And Minor Civil Divisions" (PDF). United States Census Bureau .
  7. "1910 Census of Population - Supplement for Texas" (PDF). United States Census Bureau .
  8. "1920 Census of Population - Number of Inhabitants - Texas" (PDF). United States Census Bureau .
  9. "1930 Census of Population - Number of Inhabitants - Texas" (PDF). United States Census Bureau .
  10. "1940 Census of Population - Number of Inhabitants - Texas" (PDF). United States Census Bureau .
  11. "1950 Census of Population - Number of Inhabitants - Texas" (PDF). United States Census Bureau .
  12. "1960 Census of Population - Number of Inhabitants - Texas" (PDF). United States Census Bureau .
  13. "1970 Census of Population - Number of Inhabitants - Texas" (PDF). United States Census Bureau .
  14. "1980 Census of Population - Number of Inhabitants - Texas" (PDF). United States Census Bureau .
  15. "1990 Census of Population - Population and Housing Unit Counts - Texas" (PDF). United States Census Bureau .
  16. "2000 Census of Population - Population and Housing Unit Counts - Texas" (PDF). United States Census Bureau .
  17. "2010 Census of Population - Population and Housing Unit Counts - Texas" (PDF). United States Census Bureau .
  18. 1 2 "P2 Hispanic or Latino, and Not Hispanic or Latino by Race – 2020: DEC Redistricting Data (PL 94-171) – Moore County, Texas". United States Census Bureau .
  19. "P004: Hispanic or Latino, and Not Hispanic or Latino by Race – 2000: DEC Summary File 1 – Moore County, Texas". United States Census Bureau.
  20. "P2 Hispanic or Latino, and Not Hispanic or Latino by Race – 2010: DEC Redistricting Data (PL 94-171) – Moore County, Texas". United States Census Bureau .
  21. "U.S. Census website". United States Census Bureau . Retrieved May 14, 2011.
  22. "Dave Leip's Atlas of U.S. Presidential Elections" . Retrieved June 11, 2011.
  23. Leip, David. "Dave Leip's Atlas of U.S. Presidential Elections". uselectionatlas.org.
  24. "2024 Senate Election (Official Returns)". Commonwealth of Texas by county. November 5, 2024. Retrieved December 5, 2024.
  25. "2020 CENSUS - SCHOOL DISTRICT REFERENCE MAP: Moore County, TX" (PDF). U.S. Census Bureau . Retrieved June 29, 2022. - list
  26. Texas Education Code, Sec. 130.164. AMARILLO COLLEGE DISTRICT SERVICE AREA..

35°50′N101°53′W / 35.84°N 101.89°W / 35.84; -101.89