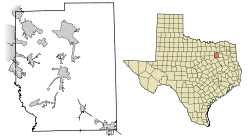
According to the U.S. Census Bureau, the county has a total area of 808 square miles (2,090km2), of which 781 square miles (2,020km2) are land and 27 square miles (70km2) (3.3%) are covered by water.[4] Located in the northeast portion of Texas, it is bounded on the southwest by the Trinity River, and drained by its east fork.[5]
Kaufman County, Texas – Racial and ethnic composition Note: the US Census treats Hispanic/Latino as an ethnic category. This table excludes Latinos from the racial categories and assigns them to a separate category. Hispanics/Latinos may be of any race.
According to the census of 2000,[12] 71,313 people, 24,367 households, and 19,225 families were residing in the county. The population density was 91 per square mile (35/km2). Its 26,133 housing units averaged 33 per square mile (13/km2). In 2020, the population was 145,310.[9] According to the 2000 census, the racial and ethnic makeup of the county was 81.10% White, 10.53% African American, 0.61% Native American, 0.47% Asian, 5.68% from other races, and 1.61% from two or more races. About 11.11% of the population was Hispanic or Latino of any race. By the 2020 census, its racial and ethnic makeup was 54.11% non-Hispanic white, 14.82% African American, 0.43% Native American, 1.45% Asian American, 0.05% Pacific Islander, 0.30% some other race, 3.95% multiracial, and 24.89% Hispanic or Latino American of any race.
American Community Survey 2023 Data
The United States Census Bureau estimated that in 2023, Kaufman County’s population was 185,690. It also estimated that the population was 46.6% non-Hispanic White, 28.1% Hispanic or Latino, 20.8% non-Hispanic Black, 2.2% Asian, 0.4% Native American, 0.1% Pacific Islander, and 1.9% multiracial.[13]
Kaufman County is served by three newspapers, the Terrell Tribune, the Kaufman Herald, and the Forney Messenger. Forney, Texas, is also served by online news media outlet inForney.com, which covers breaking news for the county. A quarterly magazine called Kaufman County Life is produced by the Terrell Tribune. The Kemp and Mabank areas are included in coverage by The Monitor and Athens Daily Review newspapers.
Law enforcement
The Kaufman County Sheriff's Office is Kaufman County's main police force. Smaller cities depend on the sheriff's office, along with the Texas Highway Patrol, for law-enforcement duties.
In December 2012, Texas officials issued a statewide bulletin warning that the Aryan Brotherhood was "actively planning retaliation against law enforcement officials" who worked to prosecute the gang's leadership.[14]
In January 2013, Assistant District Attorney Mark Hasse of Kaufman County was assassinated by gunshot outside the Kaufman County courthouse.[14] On March 30, 2013, District AttorneyMike McLelland, along with his wife, were found shot and killed in their home.[15] On April 13, 2013, ex-justice of the peace Eric Williams was arrested for making terrorist threats to county officials by email. Hasse and McLelland had aggressively prosecuted Williams in a theft case. Williams was convicted, and lost his position and his law license as a result.[16] On April 17, 2013, his wife Kim Williams was arrested on capital murder charges in all three deaths.[17]
Officials did not link these arrests or events to the Aryan Brotherhood. Eric Williams was convicted at trial and sentenced to death on December 16, 2014.[18] Kim Williams pleaded guilty on December 30, 2014, and received a 40-year sentence.[19]
Politics
Prior to 1952, Kaufman County was a Democratic Party stronghold in presidential elections. From 1952 to 1980, it was still primarily Democratic, though the party's margin of victories were far lower than before. Republican Richard Nixon won the county handily in 1972 as part of his national landslide. Starting with the 1984 election, it has become a Republican stronghold, though neither of Bill Clinton's two Republican opponents managed a majority despite winning the county due to Ross Perot's strong third-party candidacy.
The county's Republican lean has lessened a bit due to population growth in the DFW metroplex in recent years, but it still remains strongly Republican. Republicans have consistently won more than 60% of the vote in the county in the 21st century.
United States presidential election results for Kaufman County, Texas[20]
This page is based on this Wikipedia article Text is available under the CC BY-SA 4.0 license; additional terms may apply. Images, videos and audio are available under their respective licenses.