1992 Texas House of Representatives election

Last updated

1992 Texas House of Representatives election
Flag of Texas.svg
 1990November 3, 1992 1994  

All 150 seats in the Texas House of Representatives
76 seats needed for a majority
 Majority partyMinority party
 
Leader Gib Lewis
(retired)
Tom Craddick
Party Democratic Republican
Leader sinceJanuary 11, 1983January 9, 1973
Leader's seat 89th 82nd
Last election9357
Seats before9258
Seats won9258
Seat changeSteady2.svgSteady2.svg
Popular vote2,573,7552,234,252
Percentage52.13%45.25%

TxHouse1992Election.svg
1992 Texas State House election voteshares.svg
     Democratic hold     Democratic gain
     Republican hold     Republican gain
Democratic:     50–60%     60–70%     70–80%     80–90%     ≥90%
Republican:     50–60%     60–70%     70–80%     80–90%     ≥90%

Speaker before election

Gib Lewis
Democratic

Elected Speaker

Pete Laney
Democratic

The 1992 Texas House of Representatives elections took place as part of the biennial United States elections. Texas voters elected state representatives in all 150 State House of Representatives districts. The winners of this election served in the 73rd Texas Legislature, with seats apportioned according to the 1990 United States census. State representatives serve for two-year terms. Democrats maintained their majority of 92 out of 150 seats. As of 2023, this is the last time Democrats won the statewide popular vote for the Texas House.

Contents

Background

Democrats had held control of the Texas House of Representatives since Reconstruction. Republicans had gained one seat due to special elections after the resignation of Democrat Bruce Gibson of District 58. Republican Bernard Erickson won the special election outright to avoid a runoff, becoming the first Republican to ever represent the district. [1]

Redistricting

Following the release of the 1990 census results, democrats fully controlled the redistricting process. Republicans sued over the Texas House's map that was originally passed. The courts partially overhauled the map as a result of these lawsuits. [2] Democrats codified the court's map into law in a January 1992 special session. [3]

House districts follow the "county line rule," effectively granting individual counties delegations of state house seats based on their population. [4] The census found that Texas had a population of 14,229,191 in 1980, giving each district an "ideal population" of 94,861 people. In 1990, the "ideal population for a district" was 113,243 people based on a statewide population of 16,986,510. Counties with at least this number of people must fully contain at least one state house district. Counties with sufficient population for two or more districts must be divided into that number of districts. Should a county have sufficient population for one or more district plus a fraction of another, one district from another county may extend into it to represent the remaining population. District delegations for counties with at least one district changed as follows following the 1990 Census: [5]

County1980 pop. [6] SeatsPartial1990 pop. [7] SeatsPartial+/– W+/– P
Bell County 157,8201Yes191,0731YesSteady2.svgSteady2.svg
Bexar County 988,97110No1,185,39411NoIncrease2.svg1Steady2.svg
Brazoria County 169,5871Two191,7071YesSteady2.svgDecrease2.svg
Brazos County 93,5881No121,8621YesSteady2.svgIncrease2.svg
Cameron County 209,7272Yes260,1202YesSteady2.svgSteady2.svg
Collin County 144,5761Two264,0362YesIncrease2.svg1Decrease2.svg
Dallas County 1,556,41917No1,852,69116NoDecrease2.svg1Steady2.svg
Denton County 143,1261Yes273,6442YesIncrease2.svg1Steady2.svg
Ector County 115,3741Yes118,9341YesSteady2.svgSteady2.svg
El Paso County 479,8995No591,6105NoSteady2.svgSteady2.svg
Fort Bend County 130,9621Yes225,4212NoIncrease2.svg1Decrease2.svg
Galveston County 195,7382No217,3962NoSteady2.svgSteady2.svg
Gregg County 99,4951No104,9480YesDecrease2.svg1Increase2.svg
Harris County 2,409,54726No2,818,10125NoDecrease2.svg1Steady2.svg
Hidalgo County 283,3233No383,5453YesSteady2.svgIncrease2.svg
Jefferson County 248,6512Two239,3892YesSteady2.svgDecrease2.svg
Lubbock County 211,6512Yes222,6362NoSteady2.svgDecrease2.svg
McLennan County 170,7551Yes189,1231YesSteady2.svgSteady2.svg
Montgomery County 127,2221Yes182,2011YesSteady2.svgSteady2.svg
Nueces County 268,2152Yes291,1452YesSteady2.svgSteady2.svg
Potter County 98,6371No97,8740YesDecrease2.svg1Increase2.svg
Smith County 128,3661Yes151,3091YesSteady2.svgSteady2.svg
Tarrant County 860,8809No1,170,10310NoIncrease2.svg1Steady2.svg
Taylor County 110,9321Yes119,6551YesSteady2.svgSteady2.svg
Travis County 419,5734Yes576,4075NoIncrease2.svg1Decrease2.svg
Webb County 99,2581No133,2391YesSteady2.svgIncrease2.svg
Wichita County 121,0821Yes122,3781YesSteady2.svgSteady2.svg
Williamson County 76,5210Yes139,5511YesIncrease2.svg1Steady2.svg

Results

Despite Republican George H. W. Bush's victory in Texas in the concurrent presidential election, Republicans made no net gains over the Democrats in the Texas House. [8] A large number of retirements and primary defeats led to a turnover of over 30 House members. [9] In Harris County, a narrow election result in District 144 led to a contested election between Democrat Donald Fogo and Republican Robert Talton. Early ballots had Fogo in the lead, but later counts gave the lead to Talton. A recount confirmed Talton's victory, but Fogo contested the election. [10] A special panel in the Texas House later upheld Talton's victory, flipping the seat to the Republicans. [11]

Statewide

Summary of the November 3, 1992 Texas House of Representatives election results
Texas House 1992.svg
PartyCandidatesVotes %Seats+/–
Democratic Party 1152,573,75552.13%92Steady2.svg
Republican Party 892,234,25245.25%58Steady2.svg
Libertarian Party 29129,3532.62%0
Total4,937,360100.00%150
Popular vote
Democratic
52.13%
Republican
45.25%
Libertarian
2.62%
House seats won
Democratic
61.33%
Republican
38.67%

Results by district

DistrictDemocraticRepublicanLibertarianTotalResult
Votes%Votes%Votes%Votes%
District 130,216100.00%----30,216100.00%Democratic hold
District 225,05161.48%15,69738.52%--40,748100.00%Democratic hold
District 330,733100.00%----30,733100.00%Democratic hold
District 423,11755.30%18,68544.70%--41,802100.00%Democratic gain
District 525,12566.29%12,77833.71%--37,903100.00%Democratic hold
District 6--35,321100.00%--35,321100.00%Republican hold
District 7--29,855100.00%--29,855100.00%Republican hold
District 831,43772.73%11,78927.27%--43,226100.00%Democratic hold
District 934,024100.00%----34,024100.00%Democratic hold
District 1019,17345.23%23,21754.77%--42,390100.00%Republican hold
District 1128,740100.00%----28,740100.00%Democratic hold
District 1233,028100.00%----33,028100.00%Democratic hold
District 1321,06251.82%19,57948.18%--40,641100.00%Democratic hold
District 14--31,649100.00%--31,649100.00%Republican hold
District 15--35,491100.00%--35,491100.00%Republican hold
District 1614,98134.83%28,02765.17%--43,008100.00%Republican hold
District 1733,129100.00%----33,129100.00%Democratic hold
District 1832,166100.00%----32,166100.00%Democratic hold
District 1931,30671.92%12,22328.08%--43,529100.00%Democratic hold
District 2027,13165.76%14,12534.24%--41,256100.00%Democratic hold
District 2130,10160.24%19,87039.76%--49,971100.00%Democratic hold
District 2229,864100.00%----29,864100.00%Democratic hold
District 2324,672100.00%----24,672100.00%Democratic hold
District 2431,605100.00%----31,605100.00%Democratic hold
District 25--33,332100.00%--33,332100.00%Republican hold
District 2616,13832.65%33,28867.35%--49,426100.00%Republican hold
District 2722,27066.88%11,03033.12%--33,300100.00%Democratic gain
District 2832,005100.00%----32,005100.00%Democratic hold
District 2926,224100.00%----26,224100.00%Democratic hold
District 3018,04144.86%22,17755.14%--40,218100.00%Republican hold
District 3128,958100.00%----28,958100.00%Democratic hold
District 3230,084100.00%----30,084100.00%Democratic hold
District 3319,74156.11%15,44343.89%--35,184100.00%Democratic hold
District 3421,260100.00%----21,260100.00%Democratic hold
District 3525,116100.00%----25,116100.00%Democratic hold
District 3614,761100.00%----14,761100.00%Democratic gain
District 3713,367100.00%----13,367100.00%Democratic hold
District 3812,23750.13%12,17249.87%--24,409100.00%Democratic gain
District 3915,149100.00%----15,149100.00%Democratic hold
District 4015,237100.00%----15,237100.00%Democratic hold
District 4115,099100.00%----15,099100.00%Democratic hold
District 4219,102100.00%----19,102100.00%Democratic hold
District 4326,101100.00%----26,101100.00%Democratic hold
District 4429,174100.00%----29,174100.00%Democratic hold
District 45--31,56074.22%10,96125.78%42,521100.00%Republican hold
District 4628,504100.00%----28,504100.00%Democratic hold
District 4723,98734.59%45,35565.41%--69,342100.00%Republican gain
District 4836,05865.51%18,98334.49%--55,041100.00%Democratic hold
District 4939,106100.00%----39,106100.00%Democratic hold
District 5032,76687.11%--4,84812.89%37,614100.00%Democratic hold
District 5126,62870.20%11,30629.80%--37,934100.00%Democratic hold
District 5223,44348.14%25,25951.86%--48,702100.00%Republican gain
District 53--39,480100.00%--39,480100.00%Republican hold
District 5421,081100.00%----21,081100.00%Democratic hold
District 55--21,076100.00%--21,076100.00%Republican hold
District 5618,13140.31%26,85359.69%--44,984100.00%Republican hold
District 5719,29654.27%16,26145.73%--35,557100.00%Democratic hold
District 5818,45442.00%25,48658.00%--43,940100.00%Republican hold
District 5922,689100.00%----22,689100.00%Democratic hold
District 6027,72862.16%16,87637.84%--44,604100.00%Democratic hold
District 6128,70963.83%16,26936.17%--44,978100.00%Democratic hold
District 6229,768100.00%----29,768100.00%Democratic hold
District 6317,98738.06%26,65156.39%2,6225.55%47,260100.00%Republican gain
District 64--35,079100.00%--35,079100.00%Republican hold
District 6515,30536.86%26,21963.14%--41,524100.00%Republican hold
District 66--43,64585.32%7,50814.68%51,153100.00%Republican hold
District 67--35,40883.97%6,75916.03%42,167100.00%Republican gain
District 6832,719100.00%----32,719100.00%Democratic hold
District 6931,304100.00%----31,304100.00%Democratic hold
District 7029,037100.00%----29,037100.00%Democratic hold
District 71--32,463100.00%--32,463100.00%Republican hold
District 7233,576100.00%----33,576100.00%Democratic hold
District 7327,62761.16%17,54838.84%--45,175100.00%Democratic hold
District 7422,779100.00%----22,779100.00%Democratic hold
District 7516,308100.00%----16,308100.00%Democratic hold
District 7622,122100.00%----22,122100.00%Democratic hold
District 7714,797100.00%----14,797100.00%Democratic hold
District 78--25,443100.00%--25,443100.00%Republican hold
District 79--21,041100.00%--21,041100.00%Republican hold
District 8026,634100.00%----26,634100.00%Democratic hold
District 8116,40445.71%19,48254.29%--35,886100.00%Republican gain
District 82--32,539100.00%--32,539100.00%Republican hold
District 8311,62839.24%18,00460.76%--29,632100.00%Republican hold
District 8416,90733.60%33,40766.40%--50,314100.00%Republican hold
District 8525,206100.00%----25,206100.00%Democratic hold
District 86--36,420100.00%--36,420100.00%Republican hold
District 8714,72045.13%17,89754.87%--32,617100.00%Republican hold
District 8832,755100.00%----32,755100.00%Democratic hold
District 8920,44651.06%16,93442.29%2,6656.66%40,045100.00%Democratic hold
District 9019,645100.00%----19,645100.00%Democratic hold
District 91--32,66382.26%7,04217.74%39,705100.00%Republican hold
District 9214,90130.24%32,20865.36%2,1674.40%49,276100.00%Republican hold
District 9313,65437.18%20,56556.00%2,5036.82%36,722100.00%Republican hold
District 94--39,072100.00%--39,072100.00%Republican hold
District 9531,378100.00%----31,378100.00%Democratic hold
District 96--34,12482.08%7,45017.92%41,574100.00%Republican hold
District 9718,07430.56%41,05969.44%--59,133100.00%Republican hold
District 98--38,914100.00%--38,914100.00%Republican hold
District 99--36,04583.74%6,99716.26%43,042100.00%Republican hold
District 10018,60969.47%8,18030.53%--26,789100.00%Democratic hold
District 10113,23134.79%24,80065.21%--38,031100.00%Republican hold
District 102--36,703100.00%--36,703100.00%Republican hold
District 10313,43881.42%--3,06718.58%16,505100.00%Democratic hold
District 10410,15866.05%5,22233.95%--15,380100.00%Democratic gain
District 10515,53671.63%--6,15428.37%21,690100.00%Democratic hold
District 10615,61545.12%18,99554.88%--34,610100.00%Republican gain
District 10717,60153.41%12,24837.16%3,1089.43%32,957100.00%Democratic hold
District 10813,72923.63%41,50371.45%2,8584.92%58,090100.00%Republican hold
District 10924,125100.00%----24,125100.00%Democratic gain
District 11027,02971.06%11,01028.94%--38,039100.00%Democratic hold
District 11124,55065.07%13,17934.93%--37,729100.00%Democratic hold
District 112--32,310100.00%--32,310100.00%Republican hold
District 113--28,12182.06%6,14917.94%34,270100.00%Republican hold
District 114--33,653100.00%--33,653100.00%Republican hold
District 11519,26485.48%--3,27314.52%22,537100.00%Democratic hold
District 11621,957100.00%----21,957100.00%Democratic hold
District 11716,506100.00%----16,506100.00%Democratic hold
District 11819,147100.00%----19,147100.00%Democratic hold
District 11921,949100.00%----21,949100.00%Democratic hold
District 12021,965100.00%----21,965100.00%Democratic hold
District 121--36,166100.00%--36,166100.00%Republican hold
District 122--38,83888.55%5,02411.45%43,862100.00%Republican hold
District 123--39,04487.83%5,41012.17%44,454100.00%Republican hold
District 12422,105100.00%----22,105100.00%Democratic hold
District 12519,60561.68%12,17938.32%--31,784100.00%Democratic gain
District 126--40,114100.00%--40,114100.00%Republican hold
District 127--36,72884.16%6,91315.84%43,641100.00%Republican hold
District 12821,590100.00%----21,590100.00%Democratic hold
District 129--34,31880.59%8,26419.41%42,582100.00%Republican hold
District 130--37,161100.00%--37,161100.00%Republican hold
District 13123,51785.10%--4,11814.90%27,635100.00%Democratic hold
District 13223,78455.81%18,83544.19%--42,619100.00%Democratic hold
District 133--39,51887.95%5,41312.05%44,931100.00%Republican hold
District 13417,31750.15%16,43947.61%7742.24%34,530100.00%Democratic hold
District 13515,85135.95%26,55160.23%1,6843.82%44,086100.00%Republican hold
District 1369,53619.25%37,59475.88%2,4124.87%49,542100.00%Republican hold
District 13719,55359.12%12,23136.98%1,2903.90%33,074100.00%Democratic hold
District 13818,21858.52%11,75937.78%1,1523.70%31,129100.00%Democratic hold
District 13919,542100.00%----19,542100.00%Democratic hold
District 14014,150100.00%----14,150100.00%Democratic hold
District 14125,558100.00%----25,558100.00%Democratic hold
District 14224,651100.00%----24,651100.00%Democratic hold
District 14315,939100.00%----15,939100.00%Democratic hold
District 14413,32349.86%13,40050.14%--26,723100.00%Republican gain
District 14511,99266.15%6,13733.85%--18,129100.00%Democratic hold
District 14629,800100.00%----29,800100.00%Democratic hold
District 14721,07677.63%6,07322.37%--27,149100.00%Democratic hold
District 14813,25366.49%5,91129.66%7683.85%19,932100.00%Democratic hold
District 149--23,518100.00%--23,518100.00%Republican hold
District 150--32,472100.00%--32,472100.00%Republican hold
Total2,573,75552.13%2,234,25245.25%129,3532.62%4,937,360100.00%

Related Research Articles

<span class="mw-page-title-main">Texas's 7th congressional district</span> U.S. House district for Texas

Texas's 7th congressional district of the United States House of Representatives comprises a small area of southwestern Houston and Harris County, along with a northern portion of suburban Fort Bend County. As of the 2000 census, the 7th district comprises 651,620 people. Since 2019, it has been represented by Democrat Lizzie Fletcher.

<span class="mw-page-title-main">Texas's 10th congressional district</span> U.S. House district for Texas

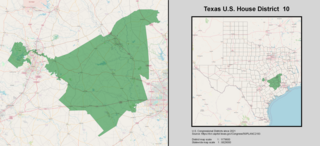
Texas's 10th congressional district of the United States House of Representatives stretches from the northwestern portion of the Greater Houston region to the Greater Austin region. It includes Houston suburbs such as Katy, Cypress, Tomball, and Prairie View, cities in east-central Texas including Brenham and Columbus, and northern Austin and some suburbs including Pflugerville, Bastrop, Manor, and Elgin. The current representative is Michael McCaul.

<span class="mw-page-title-main">Texas's 23rd congressional district</span> U.S. House district for Texas

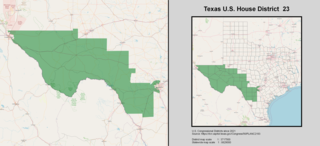
Texas's 23rd congressional district stretches across the southwestern portion of Texas. It is a majority Hispanic district and has been represented by Republican Tony Gonzales since 2021.

<span class="mw-page-title-main">Texas's 25th congressional district</span> U.S. House district for Texas

Texas's 25th congressional district of the United States House of Representatives stretches from Arlington and Fort Worth to some of its outer southwestern suburbs, as well as rural counties east of Abilene. The district's current Representative is Roger Williams.

<span class="mw-page-title-main">Texas's 26th congressional district</span> U.S. House district for Texas

Texas' 26th congressional district of the United States House of Representatives includes rural Cooke County to the north and some of Wise County to the West and includes parts of Denton County, including Flower Mound, Lewisville and parts of Corinth, Carrollton, Little Elm and The Colony. The current Representative is Michael C. Burgess. The district is best known as the seat of former House Majority Leader Dick Armey.

<span class="mw-page-title-main">Texas's 28th congressional district</span> U.S. House district for Texas

Texas's 28th congressional district of the United States House of Representatives covers a strip in deep south Texas starting in the eastern outskirts of San Antonio, and ending at the U.S.–Mexico border. Towns entirely or partially within this district include Converse, Laredo, Rio Grande City, and Universal City. The current Representative from the 28th district is Henry Cuellar.

<span class="mw-page-title-main">Texas's 32nd congressional district</span> U.S. House district for Texas

Texas's 32nd congressional district of the United States House of Representatives serves a suburban area of northeastern Dallas County and a sliver of Collin and Denton counties. The district was created after the 2000 United States census, when Texas went from 30 seats to 32 seats. It was then modified in 2011 after the 2010 census. The current representative is Democrat Colin Allred.

<span class="mw-page-title-main">2012 United States House of Representatives elections in Texas</span> 2012 House elections in Texas

The 2012 United States House of Representatives elections in Texas were held on Tuesday, November 6, 2012, to elect the 36 U.S. representatives from the state of Texas—an increase of four seats in reapportionment following the 2010 United States Census. The elections coincided with the elections of other federal and state offices, including a quadrennial presidential election and an election for the U.S. Senate. The primary election had been scheduled to be held on March 6, 2012, with a runoff election on May 22; because of problems arising from redistricting, the primary was postponed to May 29, and the run-off to July 31.

<span class="mw-page-title-main">1992 United States House of Representatives elections in Texas</span> 1992 House elections in Texas

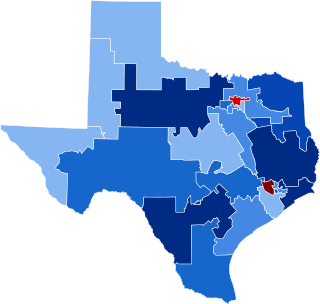
The 1992 United States House of Representatives elections in Texas occurred on November 3, 1992, to elect the members of the state of Texas's delegation to the United States House of Representatives. Texas had thirty seats in the House, apportioned according to the 1990 United States Census.

<span class="mw-page-title-main">2002 United States House of Representatives elections in Texas</span> 2002 House elections in Texas

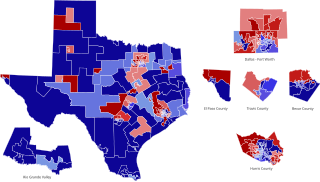
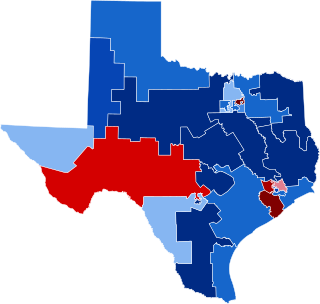
The 2002 United States House of Representatives elections in Texas occurred on November 5, 2002, to elect the members of the state of Texas's delegation to the United States House of Representatives. Texas had thirty-two seats in the House, apportioned according to the 2000 United States Census. The state gained two seats in reapportionment. Democrats narrowly maintained control of the Texas House of Representatives after the 2000 election after heavily emphasizing it as necessary to protect the party from a potential Republican gerrymander. During the 2001 regular session, the divided legislature failed to pass any redistricting plans. Congressional redistricting fell to the courts in Balderas v. State of Texas after no special session was called to address redistricting. While the court's initial map appeared to benefit Republicans, the final maps ordered for the 2002 elections were seen as beneficial to Democrats.

<span class="mw-page-title-main">1972 United States House of Representatives elections in Texas</span>

The 1972 United States House of Representatives elections in Texas occurred on November 7, 1972, to elect the members of the state of Texas's delegation to the United States House of Representatives. Texas had twenty-four seats in the House, up one from the 1960s, apportioned according to the 1970 United States Census.

<span class="mw-page-title-main">1974 United States House of Representatives elections in Texas</span>

The 1974 United States House of Representatives elections in Texas occurred on November 5, 1974, to elect the members of the state of Texas's delegation to the United States House of Representatives. Texas had twenty-four seats in the House apportioned according to the 1970 United States Census.

<span class="mw-page-title-main">1957 United States Senate special election in Texas</span>

The 1957 United States Senate special election in Texas was held on April 2, 1957 to complete the unexpired term of Senator Price Daniel, who resigned to become Governor of Texas. Interim Senator William Blakley did not run for re-election. Ralph Yarborough won the race with a plurality of the vote; no majority was required.

<span class="mw-page-title-main">1982 United States House of Representatives elections in Texas</span>

The 1982 United States House of Representatives elections in Texas occurred on November 2, 1982, to elect the members of the state of Texas's delegation to the United States House of Representatives. Texas had twenty-seven seats in the House, up three from the 1970s, apportioned according to the 1980 United States Census.

<span class="mw-page-title-main">2012 Texas House of Representatives election</span>

The 2012 Texas House of Representatives elections took place as part of the biennial United States elections. Texas voters elected state senators in all 150 State House of Representatives districts. The winners of this election served in the 83rd Texas Legislature, with seats apportioned according to the 2010 United States census. State representatives serve for two-year terms.

<span class="mw-page-title-main">Redistricting in Texas</span>

Texas House of Representatives districts, Texas Senate districts, Texas Board of Education districts, and Texas's congressional districts are redistricted once every decade, usually in the year after the decennial United States census. According to the Texas Constitution, redistricting in Texas follows the regular legislative process; it must be passed by both houses of the Texas Legislature and signed by the governor of Texas—unless the legislature has sufficient votes to override a gubernatorial veto. Like many other states in the American South after the passage of the Voting Rights Act of 1965, federal judges and the United States Supreme Court have struck down Texas's congressional and legislative districts on multiple occasions, including in the 1960s, 1970s, 1980s, 1990s, and 2000s.

<span class="mw-page-title-main">2004 Texas House of Representatives election</span>

The 2004 Texas House of Representatives elections took place as part of the biennial United States elections. Texas voters elected state representatives in all 150 State House of Representatives districts. The winners of this election served in the 79th Texas Legislature. State representatives serve for two-year terms. Republicans maintained control of the House, losing one seat to the Democrats.

<span class="mw-page-title-main">2002 Texas House of Representatives election</span>

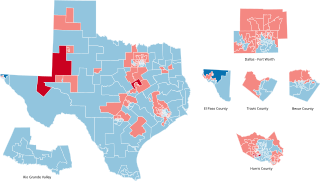
The 2002 Texas House of Representatives elections took place as part of the biennial United States elections. Texas voters elected state representatives in all 150 State House of Representatives districts. The winners of this election served in the 78th Texas Legislature, with seats apportioned according to the 2000 United States census. State representatives serve for two-year terms. Republicans gained control of the House with 88 seats to the Democrats' 62, giving them a governmental trifecta for the first time since Reconstruction.

<span class="mw-page-title-main">1996 Texas House of Representatives election</span>

The 1996 Texas House of Representatives elections took place as part of the biennial United States elections. Texas voters elected state representatives in all 150 State House of Representatives districts. The winners of this election served in the 75th Texas Legislature. State representatives serve for two-year terms. Republicans gained five seats from the Democrats, reducing the Democratic majority to 82 out of 150 seats.

<span class="mw-page-title-main">1994 Texas House of Representatives election</span>

The 1994 Texas House of Representatives elections took place as part of the biennial United States elections. Texas voters elected state representatives in all 150 State House of Representatives districts. The winners of this election served in the 74th Texas Legislature. State representatives serve for two-year terms. Republicans gained a net of two seats from the Democrats, reducing the Democratic majority to 89 out of 150 seats.

References

  1. "Erickson takes oath for Texas House". Austin American Statesman . May 14, 1992. pp. B2. ProQuest   256323047 . Retrieved June 24, 2023.
  2. "History". redistricting.capitol.texas.gov. Retrieved March 16, 2023.
  3. Bickerstaff, Steve (2020). Heath, C. Robert (ed.). Gerrymandering Texas. Lubbock, Texas: Texas Tech University Press. p. 124. ISBN   978-1-68283-073-4.
  4. "Legal Requirements". redistricting.capitol.texas.gov. Retrieved January 16, 2022.
  5. "History". redistricting.capitol.texas.gov. Retrieved January 16, 2022.
  6. Bureau, US Census. "County Intercensal Tables 1980-1990". Census.gov. Retrieved June 24, 2023.
  7. Bureau, US Census. "1990 Census: All Counties". Census.gov. Retrieved June 24, 2023.
  8. "1992 General Election". Texas Secretary of State. November 3, 1992. Retrieved June 23, 2023.
  9. Copelin, Laylan (November 4, 1992). "Republican Combs beats Day for House seat". Austin American Statesman . pp. A15. ProQuest   256236528 . Retrieved June 23, 2023.
  10. Elliot, David (December 28, 1992). "House may settle contested election. Lawmakers hope to avoid partisan battle". Austin American Statesman . pp. A1. ProQuest   256209860 . Retrieved June 23, 2023.
  11. Gardner, Selby (February 4, 1993). "House panel upholds Pasadenan's election". Houston Post. pp. A24. ProQuest   391784651 . Retrieved June 23, 2023.