United States presidential elections in Texas

Last updated

Presidential elections in Texas
Texas in United States.svg
Number of elections43
Voted Democratic27
Voted Republican16
Voted for winning candidate26
Voted for losing candidate17

Following is a table of United States presidential elections in Texas, ordered by year. Since its admission to statehood in 1845, Texas has participated in every U.S. presidential election except the 1864 election during the American Civil War, when the state had seceded to join the Confederacy, and the 1868 election, when the state was undergoing Reconstruction.

Contents

In its first century, Texas was a Democratic bastion in the mold of the "Solid South", only voting for another party once–– in 1928, when anti-Catholic sentiment against Democrat nominee Al Smith drove Texas' largely-Protestant electorate to back Republican Herbert Hoover. A gradual trend towards increasing social liberalism in the Democratic Party, however, has turned the state into generally a Republican stronghold. Since 1980, Texas has voted for the Republican nominee in every presidential election.

Winners of the state are in bold. The shading refers to the state winner, and not the national winner.

Elections from 1864 to present

Party percentage vote margin (D+, h-)Year-40-200204060801876190019241948197219962020Party percentage vote margin (D+, h-)United States presidential elections in Texas
YearWinner (nationally)VotesPercentRunner-up (nationally)VotesPercentOther national
candidates [a]
VotesPercentElectoral
votes
Margin of victory
2024 [1] Donald Trump 6,393,59756.14 Kamala Harris 4,835,25042.46401,558,347
2020 [2] Joe Biden 5,259,12646.48 Donald Trump 5,890,34752.0638631,221
2016 [3] Donald Trump [b] 4,685,04752.23 Hillary Clinton 3,877,86843.2438 [c] 807,179
2012 [4] Barack Obama 3,308,12441.38 Mitt Romney 4,569,84357.17381,261,719
2008 [5] Barack Obama 3,528,63343.68 John McCain 4,479,32855.4534950,695
2004 [6] George W. Bush 4,526,91761.09 John Kerry 2,832,70438.22341,694,213
2000 [7] George W. Bush [b] 3,799,63959.30 Al Gore 2,433,74637.98321,365,893
1996 [8] Bill Clinton 2,459,68343.83 Bob Dole 2,736,16748.76 Ross Perot 378,5376.7532276,484
1992 Bill Clinton 2,281,81537.08 George H. W. Bush 2,496,07140.56 Ross Perot 1,354,78122.0132214,256
1988 George H. W. Bush 3,036,82955.95 Michael Dukakis 2,352,74843.3529684,081
1984 Ronald Reagan 3,433,42863.61 Walter Mondale 1,949,27636.11291,484,152
1980 Ronald Reagan 2,510,70555.28 Jimmy Carter 1,881,14741.42 John B. Anderson 111,6132.4626629,558
1976 Jimmy Carter 2,082,31951.14 Gerald Ford 1,953,30047.9726129,019
1972 Richard Nixon 2,298,89666.20 George McGovern 1,154,29133.24261,144,605
1968 Richard Nixon 1,227,84439.87 Hubert Humphrey 1,266,80441.14 George Wallace 584,26918.972538,960
1964 Lyndon B. Johnson 1,663,18563.32 Barry Goldwater 958,56636.4925704,619
1960 John F. Kennedy 1,167,56750.52 Richard Nixon 1,121,31048.522446,257
1956 Dwight D. Eisenhower 1,080,61955.26 Adlai Stevenson II 859,95843.98 T. Coleman Andrews/
Unpledged Electors [d]
14,5910.7524220,661
1952 Dwight D. Eisenhower 1,102,87853.13 Adlai Stevenson II 969,22846.6924133,650
1948 Harry S. Truman 824,23565.96 Thomas E. Dewey 303,46724.29 Strom Thurmond 113,7769.1123520,768
1944 Franklin D. Roosevelt 821,60571.42 Thomas E. Dewey 191,42516.6423630,180
1940 Franklin D. Roosevelt 909,97480.92 Wendell Willkie 212,69218.9123697,282
1936 Franklin D. Roosevelt 734,48587.08 Alf Landon 103,87412.3123630,611
1932 Franklin D. Roosevelt 760,34888.06 Herbert Hoover 97,95911.3523662,389
1928 Herbert Hoover 367,03651.77 Al Smith 341,03248.102026,004
1924 Calvin Coolidge 130,02319.78 John W. Davis 484,60573.70 Robert M. La Follette 42,8816.5220354,582
1920 Warren G. Harding 114,53823.54 James M. Cox 288,76759.34 Parley P. Christensen 20174,229
1916 Woodrow Wilson 286,51476.92 Charles E. Hughes 64,99917.4520221,515
1912 Woodrow Wilson 221,58972.62 Theodore Roosevelt 28,8539.46 William H. Taft 26,7558.7720192,736
1908 William H. Taft 65,66622.35 William Jennings Bryan 217,30273.9718151,636
1904 Theodore Roosevelt 51,24221.9 Alton B. Parker 167,20071.4518115,958
1900 William McKinley 130,64130.83 William Jennings Bryan 267,43263.1215136,791
1896 William McKinley 167,52030.75 William Jennings Bryan 370,43468.0015202,914
1892 Grover Cleveland 239,14856.65 Benjamin Harrison 81,14419.22 James B. Weaver 99,68823.6115158,004
1888 Benjamin Harrison [b] 88,42224.73 Grover Cleveland 234,88365.713146,461
1884 Grover Cleveland 225,30969.26 James G. Blaine 93,14128.6313132,168
1880 James A. Garfield 57,89323.95 Winfield S. Hancock 156,42864.71 James B. Weaver 27,40511.34898,535
1876 Rutherford B. Hayes [b] 44,80029.96 Samuel J. Tilden 104,75570.04859,955
1872 Ulysses S. Grant 47,46840.71 Horace Greeley 66,54657.07819,078
1868 Ulysses S. Grant No vote due to status of Reconstruction. Horatio Seymour
1864 Abraham Lincoln No vote due to secession. George B. McClellan
   Bolded: Won Texas.

Election of 1860

The election of 1860 was a complex realigning election in which the breakdown of the previous two-party alignment culminated in four parties each competing for influence in different parts of the country. The result of the election, with the victory of an ardent opponent of slavery, spurred the secession of eleven states and brought about the American Civil War.

YearWinner (nationally)VotesPercentRunner-up (nationally)VotesPercentRunner-up (nationally)VotesPercentRunner-up (nationally)VotesPercentElectoral
votes
1860 Abraham Lincoln no ballots Stephen A. Douglas 180.0 John C. Breckinridge 47,45475.5 John Bell 15,38324.54
   Bolded: Won Texas.

Elections prior to 1860
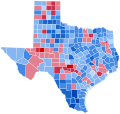
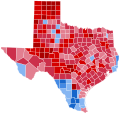
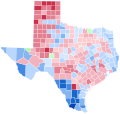
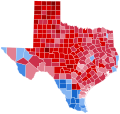
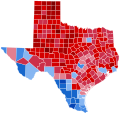
YearWinner (nationally)VotesPercentRunner-up (nationally)VotesPercentOther national
candidates [a]
VotesPercentElectoral
votes
1856 James Buchanan 31,16966.59 John C. Frémont no ballots Millard Fillmore 15,63933.414
1852 Franklin Pierce 13,55273.07 Winfield Scott 4,99526.93 John P. Hale no ballots4
1848 Zachary Taylor 4,50929.71 Lewis Cass 10,66870.29 Martin Van Buren no ballots4
   Bolded: Won Texas.

Results Maps

See also

Notes

  1. 1 2 For purposes of these lists, other national candidates are defined as those who won at least one electoral vote, or won at least ten percent of the vote in multiple states.
  2. 1 2 3 4 Won the electoral college while losing the popular vote
  3. Two faithless electors, one voting for John Kasich, another for Ron Paul.
  4. Was allied with a slate of unpledged electors in Louisiana, Mississippi and South Carolina

References

  1. Texas Elections.
  2. "Presidential Election Results: Biden Wins". The New York Times . Retrieved November 15, 2020.
  3. 2016 official Federal Election Commission report.
  4. 2012 official Federal Election Commission report.
  5. 2008 official Federal Election Commission report.
  6. "Federal Elections 2004: Election Results for the U.S. President, the U.S. Senate and the U.S. House of Representatives" (PDF). Federal Elections Commission. May 2005.
  7. "2000 Presidential Election Statistics". Dave Leip's Atlas of U.S. Presidential Elections.
  8. "1996 Presidential Election Statistics". Dave Leip's Atlas of U.S. Presidential Elections. Retrieved March 5, 2018.