United States presidential elections in New Hampshire

Last updated

Presidential elections in New Hampshire
New Hampshire in United States.svg
Number of elections59
Voted Democratic20
Voted Republican28
Voted Democratic-Republican5
Voted Federalist4
Voted other2 [a]
Voted for winning candidate43
Voted for losing candidate16

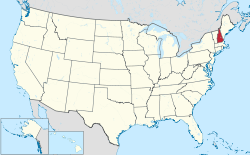
Following is a table of United States presidential elections in New Hampshire, ordered by year.

Contents

Winners of the state are in bold.

Elections from 1864 to present

Party percentage vote margin (D+, R−)Year-50-40-30-20-1001020301860189019201950198020102040Party percentage vote margin (D+, R−)Results of the United States presidential el...
YearWinner (nationally)VotesPercentRunner-up (nationally)VotesPercentOther national
candidates [b]
VotesPercentElectoral
votes
Notes
2024 Donald Trump 395,52347.87 Kamala Harris 418,48850.654
2020 [1] Joe Biden 424,92152.71 Donald Trump 365,65445.364
2016 [2] Donald Trump [c] 345,79046.46 Hillary Clinton 348,52646.834
2012 [3] Barack Obama 369,56151.98 Mitt Romney 329,91846.404
2008 [4] Barack Obama 384,82654.13 John McCain 316,53444.524
2004 [5] George W. Bush 331,23748.87 John Kerry 340,51150.244
2000 [6] George W. Bush [c] 273,55948.07 Al Gore 266,34846.804
1996 [7] Bill Clinton 246,21449.32 Bob Dole 196,53239.37 Ross Perot 48,3909.694
1992 Bill Clinton 209,04038.91 George H. W. Bush 202,48437.69 Ross Perot 121,33722.594
1988 George H. W. Bush 281,53762.49 Michael Dukakis 163,69636.334
1984 Ronald Reagan 267,05168.66 Walter Mondale 120,39530.954
1980 Ronald Reagan 221,70557.74 Jimmy Carter 108,86428.35 John B. Anderson 49,69312.944
1976 Jimmy Carter 147,63543.47 Gerald Ford 185,93554.754
1972 Richard Nixon 213,72463.98 George McGovern 116,43534.864
1968 Richard Nixon 154,90352.10 Hubert Humphrey 130,58943.93 George Wallace 11,1733.764
1964 Lyndon B. Johnson 184,06463.89 Barry Goldwater 104,02936.114
1960 John F. Kennedy 137,77246.58 Richard Nixon 157,98953.424
1956 Dwight D. Eisenhower 176,51966.11 Adlai Stevenson II 90,36433.84 T. Coleman Andrews/
Unpledged Electors [d]
1110.044
1952 Dwight D. Eisenhower 166,28760.92 Adlai Stevenson II 106,66339.084
1948 Harry S. Truman 107,99546.66 Thomas E. Dewey 121,29952.41 Strom Thurmond 7 [e] <0.014
1944 Franklin D. Roosevelt 119,66352.11 Thomas E. Dewey 109,91647.874
1940 Franklin D. Roosevelt 125,29253.22 Wendell Willkie 110,12746.784
1936 Franklin D. Roosevelt 108,46049.73 Alf Landon 104,64247.984
1932 Franklin D. Roosevelt 100,68048.99 Herbert Hoover 103,62950.424
1928 Herbert Hoover 115,40458.65 Al Smith 80,71541.024
1924 Calvin Coolidge 98,57559.83 John W. Davis 57,20134.72 Robert M. La Follette 8,9935.464
1920 Warren G. Harding 95,19659.84 James M. Cox 62,66239.39 Parley P. Christensen 4
1916 Woodrow Wilson 43,78149.12 Charles E. Hughes 43,72549.064
1912 Woodrow Wilson 34,72439.48 Theodore Roosevelt 17,79420.23 William H. Taft 32,92737.434
1908 William H. Taft 53,14959.32 William Jennings Bryan 33,65537.564
1904 Theodore Roosevelt 54,16360.07 Alton B. Parker 34,07437.794
1900 William McKinley 54,79959.33 William Jennings Bryan 35,48938.424
1896 William McKinley 57,44468.66 William Jennings Bryan 21,65025.884
1892 Grover Cleveland 42,08147.11 Benjamin Harrison 45,65851.11 James B. Weaver 2930.334
1888 Benjamin Harrison [c] 45,72850.34 Grover Cleveland 43,45647.844
1884 Grover Cleveland 39,19846.34 James G. Blaine 43,25451.144
1880 James A. Garfield 44,85651.94 Winfield S. Hancock 40,79747.24 James B. Weaver 5280.615
1876 Rutherford B. Hayes [c] 41,54051.83 Samuel J. Tilden 38,51048.055
1872 Ulysses S. Grant 37,16853.94 Horace Greeley 31,42545.615
1868 Ulysses S. Grant 37,71855.2 Horatio Seymour 30,57544.85
1864 Abraham Lincoln 36,59652.6 George B. McClellan 33,03447.45

Election of 1860

The election of 1860 was a complex realigning election in which the breakdown of the previous two-party alignment culminated in four parties each competing for influence in different parts of the country. The result of the election, with the victory of an ardent opponent of slavery, spurred the secession of eleven states and brought about the American Civil War.

YearWinner (nationally)VotesPercentRunner-up (nationally)VotesPercentRunner-up (nationally)VotesPercentRunner-up (nationally)VotesPercentElectoral
votes
1860 Abraham Lincoln 37,51956.9 Stephen A. Douglas 25,88739.3 John C. Breckinridge 2,1253.2 John Bell 4120.65

Elections from 1828 to 1856

YearWinner (nationally)VotesPercentRunner-up (nationally)VotesPercentOther national
candidates [b]
VotesPercentElectoral
votes
Notes
1856 James Buchanan 31,89145.71 John C. Frémont 37,47353.71 Millard Fillmore 4100.595
1852 Franklin Pierce 28,50356.4 Winfield Scott 15,48630.64 John P. Hale 6,54612.955
1848 Zachary Taylor 14,78129.5 Lewis Cass 27,76355.41 Martin Van Buren 7,56015.096
1844 James K. Polk 27,16055.22 Henry Clay 17,86636.326
1840 William Henry Harrison 26,31043.88 Martin Van Buren 32,77454.667
1836 Martin Van Buren 18,69775.01 William Henry Harrison 6,22824.99various [f] 7
1832 Andrew Jackson 24,85556.67 Henry Clay 18,93843.24 William Wirt no ballots7
1828 Andrew Jackson 20,21245.9 John Quincy Adams 23,82354.18

Election of 1824

The election of 1824 was a complex realigning election following the collapse of the prevailing Democratic-Republican Party, resulting in four different candidates each claiming to carry the banner of the party, and competing for influence in different parts of the country. The election was the only one in history to be decided by the House of Representatives under the provisions of the Twelfth Amendment to the United States Constitution after no candidate secured a majority of the electoral vote. It was also the only presidential election in which the candidate who received a plurality of electoral votes (Andrew Jackson) did not become president, a source of great bitterness for Jackson and his supporters, who proclaimed the election of Adams a corrupt bargain.

YearWinner (nationally)VotesPercentRunner-up (nationally)VotesPercentRunner-up (nationally)VotesPercentRunner-up (nationally)VotesPercentElectoral
votes
1824 Andrew Jackson no ballots John Quincy Adams 9,38993.59 Henry Clay no ballots William H. Crawford 6436.418

Elections from 1788-89 to 1820

In the election of 1820, incumbent President James Monroe ran effectively unopposed. The popular vote was primarily directed to filling the office of vice president. The sole electoral vote against Monroe came from William Plumer, an elector from New Hampshire and former United States senator and New Hampshire governor. Plumer cast his electoral ballot for Secretary of State John Quincy Adams. While some accounts claim incorrectly that this was to ensure that George Washington would remain the only American president unanimously chosen by the Electoral College, that was not Plumer's goal. In fact, Plumer simply thought that Monroe was a mediocre president and that Adams would be a better one. [8] Plumer also refused to vote for Tompkins for Vice President as "grossly intemperate", not having "that weight of character which his office requires," and "because he grossly neglected his duty" in his "only" official role as President of the Senate by being "absent nearly three-fourths of the time"; [9] Plumer instead voted for Richard Rush.

YearWinner (nationally)Runner-up (nationally)Electoral
votes
Notes
1820 James Monroe 9Monroe effectively ran unopposed. One elector voted for John Quincy Adams (see above).
1816 James Monroe Rufus King 8
1812 James Madison DeWitt Clinton 8
1808 James Madison Charles C. Pinckney 7
1804 Thomas Jefferson Charles C. Pinckney 7
1800 Thomas Jefferson John Adams 6
1796 John Adams Thomas Jefferson 6
1792 George Washington 6Washington effectively ran unopposed.
1788-89 George Washington 5Washington effectively ran unopposed.

See also

Notes

  1. George Washington, 1788-89, 1792.
  2. 1 2 For purposes of these lists, other national candidates are defined as those who won at least one electoral vote, or won at least ten percent of the vote in multiple states.
  3. 1 2 3 4 Won the electoral college while losing the popular vote
  4. Was allied with a slate of unpledged electors in Louisiana, Mississippi and South Carolina
  5. As a write-in candidate
  6. Three other candidates ran and received electoral votes nationally as part of the unsuccessful Whig strategy to defeat Martin Van Buren by running four candidates with local appeal in different regions of the country. The others were Hugh Lawson White, Daniel Webster, and Willie Person Mangum. None of these candidates appeared on the ballot in New Hampshire.

References

  1. "Presidential Election Results: Biden Wins". The New York Times . November 3, 2020. Retrieved November 15, 2020.
  2. 2016 official Federal Election Commission report.
  3. 2012 official Federal Election Commission report.
  4. 2008 official Federal Election Commission report.
  5. "Federal Elections 2004: Election Results for the U.S. President, the U.S. Senate and the U.S. House of Representatives" (PDF). Federal Elections Commission. May 2005.
  6. "2000 Presidential Election Statistics". Dave Leip’s Atlas of U.S. Presidential Elections.
  7. "1996 Presidential Election Statistics". Dave Leip’s Atlas of U.S. Presidential Elections. Retrieved March 5, 2018.
  8. Turner (1955) p 253.
  9. "Daniel D. Tompkins, 6th Vice President (1817-1825)" United States Senate web site.