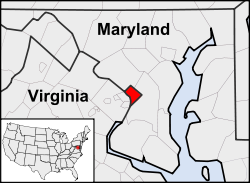
Number of elections | 16 |
---|---|
Voted Democratic | 16 |
Voted Republican | 0 |
Voted other | 0 |
Voted for winning candidate | 7 |
Voted for losing candidate | 9 |
Since the enactment of the 23rd amendment to the Constitution in 1961, [1] the District of Columbia has participated in 16 presidential elections. The amendment states that it cannot have any more electoral votes than the state with the smallest number of electors. [2] Since then, it has been allocated three electoral votes in every presidential election. [3] The Democratic Party has immense political strength in the district. In each of the 16 presidential elections, the district has overwhelmingly voted for the Democratic candidate, with no margin less than 56.5 percentage points. It has been won by the losing candidate in 9 of the 16 elections.
In the 2000 presidential election, Barbara Lett-Simmons, an elector from the district, left her ballot blank to protest its lack of voting representation in Congress. As a result, Al Gore received only two of the three electoral votes from Washington, D.C. [4] In 2016, 85.7% of the registered voters approved a statehood referendum. [5] In recent times, there have been various statehood movements in the District of Columbia, which advocates making the district a state. [6] [7]
The district is a signatory of the National Popular Vote Interstate Compact, an interstate compact in which signatories award all of their electoral votes to the winner of the national-level popular vote in a presidential election, even if another candidate won an individual signatory's popular vote. As of 2023, [update] it has not yet gone into force. [8]
Key for parties |
---|
Note– A double dagger (‡) indicates the national winner. |
Year | Winner | Runner-up | Other candidate [a] | EV | Ref. | |||||||||
---|---|---|---|---|---|---|---|---|---|---|---|---|---|---|
Candidate | Votes | % | Candidate | Votes | % | Candidate | Votes | % | ||||||
Lyndon B. Johnson (D)‡ | 169,796 | 85.5% | Barry Goldwater (R) | 28,801 | 14.5% | — | — | — | 3 | |||||
Hubert Humphrey (D) | 139,566 | 81.82% | Richard Nixon (R)‡ | 31,012 | 18.18% | — | — | — | 3 | |||||
George McGovern (D) | 127,627 | 78.1% | Richard Nixon (R)‡ | 35,226 | 21.56% | Linda Jenness (SW) | 316 | 0.19% | 3 | |||||
Jimmy Carter (D)‡ | 137,818 | 81.63% | Gerald Ford (R) | 27,873 | 16.51% | Peter Camejo (SW) | 545 | 0.32% | 3 | |||||
Jimmy Carter (D) | 130,231 | 74.32% | Ronald Reagan (R)‡ | 23,313 | 13.3% | John B. Anderson (I) | 16,131 | 9.21% | 3 | |||||
Walter Mondale (D) | 180,408 | 85.38% | Ronald Reagan (R)‡ | 29,009 | 13.73% | David Bergland (LI) | 279 | 0.13% | 3 | |||||
Michael Dukakis (D) | 159,407 | 82.65% | George H. W. Bush (R)‡ | 27,590 | 14.3% | Lenora Fulani (NA) | 2,901 | 1.5% | 3 | |||||
Bill Clinton (D)‡ | 192,619 | 84.64% | George H. W. Bush (R) | 20,698 | 9.1% | Ross Perot (I) | 9,681 | 4.25% | 3 | |||||
Bill Clinton (D)‡ | 158,220 | 85.19% | Bob Dole (R) | 17,339 | 9.34% | Ralph Nader (G) | 4,780 | 2.57% | 3 | |||||
Al Gore (D) | 171,923 | 85.16% | George W. Bush (R)‡ | 18,073 | 8.95% | Ralph Nader (G) | 10,576 | 5.24% | 2 [b] | |||||
John Kerry (D) | 202,970 | 89.18% | George W. Bush (R)‡ | 21,256 | 9.34% | Ralph Nader (I) | 1,485 | 0.65% | 3 | |||||
Barack Obama (D)‡ | 245,800 | 92.46% | John McCain (R) | 17,367 | 6.53% | Ralph Nader (I) | 1,138 | 0.43% | 3 | |||||
Barack Obama (D)‡ | 267,070 | 90.91% | Mitt Romney (R) | 21,381 | 7.28% | Jill Stein (G) | 2,458 | 0.84% | 3 | |||||
Hillary Clinton (D) | 282,830 | 90.86% | Donald Trump (R)‡ | 12,723 | 4.09% | Gary Johnson (LI) | 4,906 | 1.58% | 3 | |||||
Joe Biden (D)‡ | 317,323 | 92.15% | Donald Trump (R) | 18,586 | 5.4% | Jo Jorgensen (LI) | 2,036 | 0.59% | 3 | |||||
Kamala Harris (D) | 294,185 | 90.28% | Donald Trump (R)‡ | 21,076 | 6.47% | Robert F. Kennedy Jr. (I) | 2,778 | 0.85% | 3 |
The following graph shows the margin of victory of the Democratic Party over the Republican Party in the 15 presidential elections the District of Columbia participated.
Graphs are unavailable due to technical issues. There is more info on Phabricator and on MediaWiki.org. |
The District of Columbia holds general elections every two years to fill various D.C. government offices, including mayor, attorney general, members of the D.C. Council, members of the D.C. State Board of Education, and members of its Advisory Neighborhood Commissions. Special elections may be held to fill vacancies at other points in time. Additionally, citywide ballot measures may be proposed and voted on.
The 2000 United States presidential election in New Mexico took place on November 7, 2000, and was part of the 2000 United States presidential election. Voters chose five electors to the Electoral College, who voted for president and vice president. New Mexico was won by Vice President Al Gore by a 0.06 percent margin. It was the closest state in the entire presidential election by raw vote margin, which was even closer than Florida. News outlets called New Mexico for Gore at approximately 10:21 p.m. (EST), but later retracted the call when it was determined to be too close to call.
The 2012 United States presidential election in West Virginia took place on November 6, 2012, as part of the 2012 United States presidential election in which all 50 states plus the District of Columbia participated. West Virginia voters chose five electors to represent them in the Electoral College via a popular vote pitting incumbent Democratic President Barack Obama and his running mate, Vice President Joe Biden, against Republican challenger and former Massachusetts Governor Mitt Romney and his running mate, Congressman Paul Ryan.
Since Alaska's admission to the Union in January 1959, it has participated in 16 United States presidential elections, always having 3 electoral votes. In the 1960 presidential election, Alaska was narrowly won by the Republican Party's candidate and incumbent vice president Richard Nixon, defeating the Democratic Party's candidate John F. Kennedy by a margin of just 1.88%. In the 1964 presidential election, the Democratic Party's candidate Lyndon B. Johnson won Alaska in a national Democratic landslide victory. Since the 1964 election, Alaska has been won by the Republican Party in every presidential election. However, no Republican candidate has gotten 55% of the statewide vote since 2008. Donald Trump received 54.5% in 2024.
Since Arizona's admission to the Union in February 1912, it has participated in 28 United States presidential elections.
Arkansas is a state in the South Central region of the United States. Since its admission to the Union in June 1836, it has participated in 46 United States presidential elections. In the realigning 1860 election, Arkansas was one of the ten slave states that did not provide ballot access to the Republican nominee, Abraham Lincoln. Subsequently, John C. Breckinridge won the state by a comfortable margin, becoming the first third party candidate to win Arkansas. Soon after this election, Arkansas seceded from the Union and joined the Confederacy. Following the secession, Arkansas did not participate in the 1864 presidential election. After the Civil War, Arkansas was readmitted to the Union in 1868. In the 1872 election, all six of Arkansas's electoral votes were invalidated due to various irregularities including allegations of electoral fraud.
Since being admitted to the Union in 1850, California has participated in 43 presidential elections. A bellwether from 1888 to 1996, voting for the losing candidates only three times in that span, California has become a reliable state for Democratic presidential candidates since 1992.
Following is a table of United States presidential elections in Colorado, ordered by year. Since its admission to statehood in 1876, Colorado has participated in every U.S. presidential election.
Following is a table of United States presidential elections in Delaware, ordered by year. Since its admission to statehood in 1787, Delaware has participated in every U.S. presidential election.
Hawaii is a state in the Western United States located in the Pacific Ocean about 2,000 miles from the U.S. mainland. Since its admission to the Union in August 1959, it has participated in 16 United States presidential elections. In the 1960 presidential election, Hawaii was narrowly won by the Democratic Party's candidate John F. Kennedy, defeating the Republican Party's candidate and incumbent vice president Richard Nixon by a margin of just 0.06%. In the 1964 presidential election, the Democratic Party's candidate Lyndon B. Johnson won Hawaii by a margin of 57.52%, which remains the largest ever margin of victory in the state's history. Since the 1960 election, Hawaii has been won by the Democratic Party in every presidential election, except in 1972 and 1984, which were both won in a national Republican landslide victory by Nixon and Ronald Reagan respectively.
Following is a table of United States presidential elections in Kansas, ordered by year. Since its admission to statehood in 1861, Kansas has participated in every U.S. presidential election. As of 2024, Kansas has the longest streak of being decided by more than a 5% margin in presidential elections, with the last race this close being in 1896.
Following is a table of United States presidential elections in Minnesota, ordered by year. Since its admission to statehood in 1858, Minnesota has participated in every U.S. presidential election.
Following is a table of United States presidential elections in Montana, ordered by year. Since its admission to statehood in 1889, Montana has participated in every U.S. presidential election.
Since New Mexico's admission to the Union in January 1912, it has participated in 29 United States presidential elections. In the 1912 presidential election, Theodore Roosevelt, the Progressive Party's nominee, received the highest vote share (17.1%) ever won by a third-party candidate in New Mexico. In the 1932 presidential election, Democrat Franklin D. Roosevelt won New Mexico, defeating Republican Herbert Hoover by 26.96%, which remains the largest ever margin of victory in the state's history. In the 2000 presidential election, Democrat Al Gore won New Mexico, defeating Republican George W. Bush by a margin of just 0.06%.
Following is a table of United States presidential elections in North Dakota, ordered by year. Since its admission to statehood in 1889, North Dakota has participated in every U.S. presidential election.
Oklahoma is a state in the South Central region of the United States. Since it first joined the United States in 1907, Oklahoma has participated in 29 presidential elections. It was initially granted seven electoral votes, gaining three following the 1910 census. It was given an additional vote in the 1930 census, which it later lost in the 1940 census. The state's electoral votes were reduced to eight votes in the 1950 census before returning to its original seven following the 2000 census.
Following is a table of United States presidential elections in South Dakota, ordered by year. Since its admission to statehood in 1889, South Dakota has participated in every U.S. presidential election.
Utah is a state in the Mountain West sub-region of the Western United States. Since its admission to the Union in January 1896, it has participated in 32 United States presidential elections. In the 1896 presidential election, first presidential election in which the state participated, Utah was won in a landslide by Democrat William Jennings Bryan, who received almost 83 percent of the state's vote. 1896 was the only election in which Utah voted for a losing democratic candidate. The state would quickly swing towards the Republican Party in the years that followed, although it would remain a swing state at the presidential level well into the 1940s. In the 1912 election, Utah was one of only two states won by incumbent Republican President William Howard Taft. However, the state would vote for the Democratic nominee by a large margin in 1916, 1932, 1936, 1940, and 1944, and by a narrow margin in 1948. However, since the latter election, the state has become very heavily Republican and has only voted for a Democratic presidential nominee once.
Following is a table of United States presidential elections in Vermont, ordered by year. Since its admission to statehood in 1791, Vermont has participated in every U.S. presidential election.
Washington is a state in the Pacific Northwest region of the United States. Since its admission to the Union in November 1889, the state has participated in 33 United States presidential elections. It has had twelve electoral votes since 2012, when it gained a tenth congressional district during reappropriation based on the results of the 2010 U.S. census. Washington has conducted its presidential elections through mail-in voting since 2012 for general elections and 2016 for party primaries.