1996 Texas House of Representatives election

Last updated

1996 Texas House of Representatives election
Flag of Texas.svg
  1994 November 5, 1996 1998  

All 150 seats in the Texas House of Representatives
76 seats needed for a majority
 Majority partyMinority party
 
Leader Pete Laney Tom Craddick
Party Democratic Republican
Leader sinceJanuary 12, 1993January 9, 1973
Leader's seat 85th 82nd
Last election8961
Seats before8763
Seats won8268
Seat changeDecrease2.svg 5Increase2.svg 5
Popular vote2,015,9512,502,499
Percentage44.18%54.84%
SwingDecrease2.svg 3.94%Increase2.svg 3.85%

TxHouse1996Election.svg
1996 Texas State House election voteshares.svg
     Democratic hold     Democratic gain
     Republican hold     Republican gain
Democratic:     40–50%     50–60%     60–70%     70–80%     80–90%     ≥90%
Republican:     50–60%     60–70%     70–80%     80–90%     ≥90%

Speaker before election

Pete Laney
Democratic

Elected Speaker

Pete Laney
Democratic

The 1996 Texas House of Representatives elections took place as part of the biennial United States elections. Texas voters elected state representatives in all 150 State House of Representatives districts. The winners of this election served in the 75th Texas Legislature. State representatives serve for two-year terms. Republicans gained five seats from the Democrats, reducing the Democratic majority to 82 out of 150 seats.

Contents

Background

Democrats had held control of the Texas House of Representatives since Reconstruction. After the 1994 elections, Republican governor George W. Bush appointed Democratic Representative Elton Bomer of the 11th district as the state insurance commissioner. [1] In the ensuing special election, Republican Todd Staples narrowly avoided a runoff, defeating two Democrats to flip the seat. [2] Later in 1995, Representative Warren Chisum of the 88th district switched from the Democratic Party to the Republican Party. [3]

Redistricting

Democrats had fully controlled the redistricting process in 1991, and Republicans sued over the Texas House's map. The courts partially overhauled the map as a result of these lawsuits. [4] Democrats codified the court's map into law in a January 1992 special session. [5] The 1995 lawsuit Thomas v. Bush further altered the maps, as the courts reached a settlement with the legislature to alter the several districts in Harris, Dallas, and Bexar Counties for the 1996 elections. [4] [6] [7]

Results

Despite having hopes of winning control of the chamber from the Democrats due to Texas's increasing Republican lean, Republicans only flipped five seats. [8] [9]

Statewide

Summary of the November 5, 1996 Texas House of Representatives election results
Texas House 1996.svg
PartyCandidatesVotes %Seats+/–
Democratic Party 1002,015,95144.18%82Decrease2.svg5
Republican Party 1072,502,49954.84%68Increase2.svg5
Natural Law Party 823,0230.50%0
Libertarian Party 920,6190.45%0
Independent 16730.01%0
Write-in 13450.01%0
Total4,563,110100.00%150
Popular vote
Republican
54.84%
Democratic
44.18%
Natural Law
0.50%
Libertarian
0.45%
Independent
0.01%
Write-in
0.01%
House seats won
Democratic
54.67%
Republican
45.33%

Close races

  1. District 59, 0.04%
  2. District 9, 1.04% (gain)
  3. District 60, 1.18% (gain)
  4. District 32, 2.00% (gain)
  5. District 138, 2.02%
  6. District 70, 2.30%
  7. District 17, 2.62%
  8. District 54, 5.58% (gain)
  9. District 4, 5.76%
  10. District 20, 6.06%
  11. District 29, 6.88% (tipping-point district)
  12. District 58, 7.84%
  13. District 62, 7.88% (gain)
  14. District 28, 9.76%

Results by district

DistrictDemocraticRepublicanOthersTotalResult
Votes%Votes%Votes%Votes%
District 124,72863.77%14,05036.23%--38,778100.00%Democratic hold
District 226,553100.00%----26,553100.00%Democratic hold
District 326,303100.00%----26,303100.00%Democratic hold
District 420,60452.88%18,36247.12%--38,966100.00%Democratic hold
District 520,97259.49%14,27940.51%--35,251100.00%Democratic hold
District 6--23,440100.00%--23,440100.00%Republican hold
District 7--26,351100.00%--26,351100.00%Republican hold
District 826,36461.10%16,78338.90%--43,147100.00%Democratic hold
District 920,54949.48%20,97950.52%--41,528100.00%Republican gain
District 10--27,012100.00%--27,012100.00%Republican hold
District 1115,60543.82%20,00456.18%--35,609100.00%Republican hold
District 1225,43763.93%14,35436.07%--39,791100.00%Democratic hold
District 1323,37059.45%15,94240.55%--39,312100.00%Democratic hold
District 14--24,402100.00%--24,402100.00%Republican hold
District 1515,43131.05%34,26468.95%--49,695100.00%Republican hold
District 16--32,061100.00%--32,061100.00%Republican hold
District 1720,97651.31%19,90648.69%--40,882100.00%Democratic hold
District 1824,48360.15%16,22339.85%--40,706100.00%Democratic hold
District 1926,68568.97%12,00431.03%--38,689100.00%Democratic hold
District 2022,05953.03%19,53746.97%--41,596100.00%Democratic hold
District 2133,37787.59%--4,72812.41%38,105100.00%Democratic hold
District 2225,034100.00%----25,034100.00%Democratic hold
District 2321,58257.74%15,79642.26%--37,378100.00%Democratic hold
District 2425,503100.00%----25,503100.00%Democratic hold
District 2514,31533.06%28,98166.94%--43,296100.00%Republican hold
District 26--41,93186.06%6,79013.94%48,721100.00%Republican hold
District 2720,50360.46%13,41139.54%--33,914100.00%Democratic hold
District 2822,07854.88%18,15445.12%--40,232100.00%Democratic hold
District 2917,04153.44%14,85046.56%--31,891100.00%Democratic hold
District 30--25,894100.00%--25,894100.00%Republican hold
District 3125,29670.52%10,57729.48%--35,873100.00%Democratic hold
District 3221,81849.00%22,70451.00%--44,522100.00%Republican gain
District 3324,800100.00%----24,800100.00%Democratic hold
District 3422,924100.00%----22,924100.00%Democratic hold
District 3522,859100.00%----22,859100.00%Democratic hold
District 3614,00961.32%8,83538.68%--22,844100.00%Democratic hold
District 3713,03469.43%5,74030.57%--18,774100.00%Democratic hold
District 3815,529100.00%----15,529100.00%Democratic hold
District 3914,768100.00%----14,768100.00%Democratic hold
District 4015,81671.28%6,37128.72%--22,187100.00%Democratic hold
District 4115,11266.35%7,66433.65%--22,776100.00%Democratic hold
District 4219,019100.00%----19,019100.00%Democratic hold
District 4324,766100.00%----24,766100.00%Democratic hold
District 4426,492100.00%----26,492100.00%Democratic hold
District 45--37,52488.69%4,78411.31%42,308100.00%Republican hold
District 4620,85656.37%16,14043.63%--36,996100.00%Democratic hold
District 4722,10629.34%51,95368.95%1,2871.71%75,346100.00%Republican hold
District 4834,850100.00%----34,850100.00%Democratic hold
District 4928,13763.18%16,39936.82%--44,536100.00%Democratic hold
District 5027,240100.00%----27,240100.00%Democratic hold
District 5121,30071.80%7,11323.98%1,2544.23%29,667100.00%Democratic hold
District 5219,80938.42%31,75261.58%--51,561100.00%Republican hold
District 5315,51527.29%41,34772.71%--56,862100.00%Republican hold
District 5415,75747.21%17,62052.79%--33,377100.00%Republican gain
District 55--22,829100.00%--22,829100.00%Republican hold
District 56--29,981100.00%--29,981100.00%Republican hold
District 5718,24558.58%12,90141.42%--31,146100.00%Democratic gain
District 5818,36446.08%21,48753.92%--39,851100.00%Republican hold
District 5915,39949.60%15,38749.56%2630.85%31,049100.00%Democratic hold
District 6021,40949.41%21,92250.59%--43,331100.00%Republican gain
District 61--32,821100.00%--32,821100.00%Republican hold
District 6218,71846.06%21,92053.94%--40,638100.00%Republican gain
District 63--36,418100.00%--36,418100.00%Republican hold
District 64--36,830100.00%--36,830100.00%Republican hold
District 65--28,495100.00%--28,495100.00%Republican hold
District 66--48,127100.00%--48,127100.00%Republican hold
District 67--33,026100.00%--33,026100.00%Republican hold
District 6826,245100.00%----26,245100.00%Democratic hold
District 6925,912100.00%----25,912100.00%Democratic hold
District 7017,83451.15%17,03548.85%--34,869100.00%Democratic hold
District 71--30,683100.00%--30,683100.00%Republican hold
District 7228,102100.00%----28,102100.00%Democratic hold
District 7329,711100.00%----29,711100.00%Democratic hold
District 7422,994100.00%----22,994100.00%Democratic hold
District 7515,89568.21%7,40931.79%--23,304100.00%Democratic hold
District 7622,848100.00%----22,848100.00%Democratic hold
District 7716,839100.00%----16,839100.00%Democratic hold
District 78--26,860100.00%--26,860100.00%Republican hold
District 7918,723100.00%----18,723100.00%Democratic hold
District 80--21,169100.00%--21,169100.00%Republican hold
District 81--23,967100.00%--23,967100.00%Republican hold
District 82--30,771100.00%--30,771100.00%Republican hold
District 83--18,11983.00%3,71117.00%21,830100.00%Republican hold
District 8419,15842.07%26,38557.93%--45,543100.00%Republican hold
District 8520,81364.58%11,41735.42%--32,230100.00%Democratic hold
District 86--38,216100.00%--38,216100.00%Republican hold
District 87--23,050100.00%--23,050100.00%Republican hold
District 88--32,115100.00%--32,115100.00%Republican hold
District 8915,64344.87%19,21855.13%--34,861100.00%Republican gain
District 9016,015100.00%----16,015100.00%Democratic hold
District 91--29,998100.00%--29,998100.00%Republican hold
District 92--30,953100.00%--30,953100.00%Republican hold
District 93--21,064100.00%--21,064100.00%Republican hold
District 94--32,68588.73%4,15011.27%36,835100.00%Republican hold
District 9526,796100.00%----26,796100.00%Democratic hold
District 96--32,553100.00%--32,553100.00%Republican hold
District 97--38,701100.00%--38,701100.00%Republican hold
District 98--38,901100.00%--38,901100.00%Republican hold
District 99--32,764100.00%--32,764100.00%Republican hold
District 10017,29668.58%7,39229.31%5322.11%25,220100.00%Democratic hold
District 101--24,153100.00%--24,153100.00%Republican hold
District 102--28,269100.00%--28,269100.00%Republican hold
District 10313,340100.00%----13,340100.00%Democratic hold
District 10410,08672.35%3,85427.65%--13,940100.00%Democratic hold
District 10514,30561.81%8,16735.29%6732.91%23,145100.00%Democratic hold
District 10613,00140.92%18,77459.08%--31,775100.00%Republican hold
District 10716,23858.06%10,79538.60%9333.34%27,966100.00%Democratic hold
District 10812,28224.27%37,35773.81%9721.92%50,611100.00%Republican hold
District 10923,589100.00%----23,589100.00%Democratic hold
District 11026,89992.91%--2,0537.09%28,952100.00%Democratic hold
District 11124,761100.00%----24,761100.00%Democratic hold
District 112--28,493100.00%--28,493100.00%Republican hold
District 113--27,414100.00%--27,414100.00%Republican hold
District 114--31,17288.34%4,11611.66%35,288100.00%Republican hold
District 11518,276100.00%----18,276100.00%Democratic hold
District 11617,85870.15%7,59829.85%--25,456100.00%Democratic hold
District 11715,313100.00%----15,313100.00%Democratic hold
District 11818,294100.00%----18,294100.00%Democratic hold
District 11920,556100.00%----20,556100.00%Democratic hold
District 12019,39398.25%--3451.75%19,738100.00%Democratic hold
District 12114,35933.77%28,16166.23%--42,520100.00%Republican hold
District 122--40,113100.00%--40,113100.00%Republican hold
District 123--36,908100.00%--36,908100.00%Republican hold
District 12422,083100.00%----22,083100.00%Democratic hold
District 12517,73461.12%11,28238.88%--29,016100.00%Democratic hold
District 126--38,398100.00%--38,398100.00%Republican hold
District 127--32,464100.00%--32,464100.00%Republican hold
District 12815,989100.00%----15,989100.00%Democratic hold
District 129--35,097100.00%--35,097100.00%Republican hold
District 130--40,078100.00%--40,078100.00%Republican hold
District 13122,492100.00%----22,492100.00%Democratic hold
District 13224,24263.88%13,70536.12%--37,947100.00%Democratic hold
District 133--34,615100.00%--34,615100.00%Republican hold
District 134--22,048100.00%--22,048100.00%Republican hold
District 135--32,580100.00%--32,580100.00%Republican hold
District 136--36,20592.42%2,9697.58%39,174100.00%Republican hold
District 13717,86864.73%9,73735.27%--27,605100.00%Democratic hold
District 13814,54851.01%13,97148.99%--28,519100.00%Democratic hold
District 13917,194100.00%----17,194100.00%Democratic hold
District 14012,153100.00%----12,153100.00%Democratic hold
District 14123,187100.00%----23,187100.00%Democratic hold
District 14221,397100.00%----21,397100.00%Democratic hold
District 14313,25572.16%5,11327.84%--18,368100.00%Democratic hold
District 14410,86036.17%18,37261.19%7942.64%30,026100.00%Republican hold
District 14511,18670.86%4,60129.14%--15,787100.00%Democratic hold
District 14624,81772.98%9,18927.02%--34,006100.00%Democratic hold
District 14719,425100.00%----19,425100.00%Democratic hold
District 14814,648100.00%----14,648100.00%Democratic hold
District 149--19,11981.62%4,30618.38%23,425100.00%Republican hold
District 150--30,419100.00%--30,419100.00%Republican hold
Total2,015,95144.18%2,502,49954,84%44,6600.98%4,563,110100.00%

Related Research Articles

<span class="mw-page-title-main">Texas's 7th congressional district</span> U.S. House district for Texas

Texas's 7th congressional district of the United States House of Representatives comprises a small area of southwestern Houston and Harris County, along with a northern portion of suburban Fort Bend County. As of the 2000 census, the 7th district comprises 651,620 people. Since 2019, it has been represented by Democrat Lizzie Fletcher.

<span class="mw-page-title-main">2003 Texas redistricting</span> Controversial redistricting of Texass districts for the U.S. House of Representatives

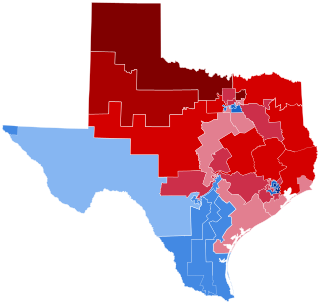
The 2003 Texas redistricting was a controversial intercensus state plan that defined new congressional districts. In the 2004 elections, this redistricting supported the Republicans taking a majority of Texas's federal House seats for the first time since Reconstruction. Democrats in both houses of the Texas Legislature staged walkouts, unsuccessfully trying to prevent the changes. Opponents challenged the plan in three suits, combined when the case went to the United States Supreme Court in League of United Latin American Citizens v. Perry (2006).

<span class="mw-page-title-main">Alabama's congressional districts</span>

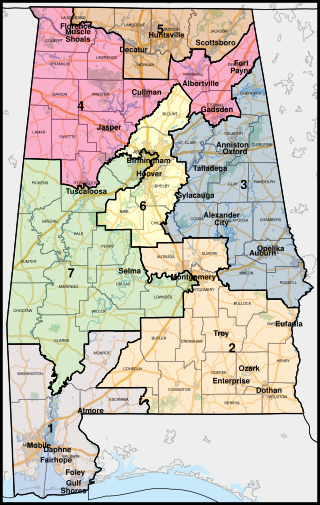
The U.S. state of Alabama is currently divided into seven congressional districts, each represented by a member of the United States House of Representatives.

The following table indicates the party of elected officials in the U.S. state of Texas:

<span class="mw-page-title-main">2012 United States House of Representatives elections in Texas</span> 2012 House elections in Texas

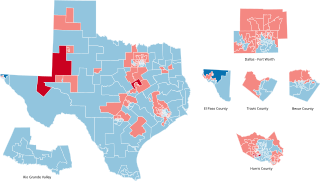
The 2012 United States House of Representatives elections in Texas were held on Tuesday, November 6, 2012, to elect the 36 U.S. representatives from the state of Texas—an increase of four seats in reapportionment following the 2010 United States Census. The elections coincided with the elections of other federal and state offices, including a quadrennial presidential election and an election for the U.S. Senate. The primary election had been scheduled to be held on March 6, 2012, with a runoff election on May 22; because of problems arising from redistricting, the primary was postponed to May 29, and the run-off to July 31.

<span class="mw-page-title-main">1992 United States House of Representatives elections in Texas</span> 1992 House elections in Texas

The 1992 United States House of Representatives elections in Texas occurred on November 3, 1992, to elect the members of the state of Texas's delegation to the United States House of Representatives. Texas had thirty seats in the House, apportioned according to the 1990 United States Census.

<span class="mw-page-title-main">2002 United States House of Representatives elections in Texas</span> 2002 House elections in Texas

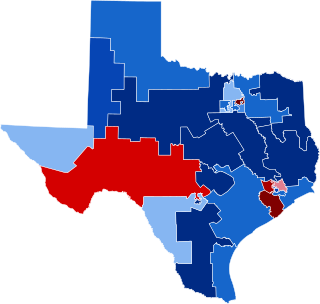
The 2002 United States House of Representatives elections in Texas occurred on November 5, 2002, to elect the members of the state of Texas's delegation to the United States House of Representatives. Texas had thirty-two seats in the House, apportioned according to the 2000 United States Census. The state gained two seats in reapportionment. Democrats narrowly maintained control of the Texas House of Representatives after the 2000 election after heavily emphasizing it as necessary to protect the party from a potential Republican gerrymander. During the 2001 regular session, the divided legislature failed to pass any redistricting plans. Congressional redistricting fell to the courts in Balderas v. State of Texas after no special session was called to address redistricting. While the court's initial map appeared to benefit Republicans, the final maps ordered for the 2002 elections were seen as beneficial to Democrats.

<span class="mw-page-title-main">1972 United States House of Representatives elections in Texas</span>

The 1972 United States House of Representatives elections in Texas occurred on November 7, 1972, to elect the members of the state of Texas's delegation to the United States House of Representatives. Texas had twenty-four seats in the House, up one from the 1960s, apportioned according to the 1970 United States Census.

<span class="mw-page-title-main">1982 United States House of Representatives elections in Texas</span>

The 1982 United States House of Representatives elections in Texas occurred on November 2, 1982, to elect the members of the state of Texas's delegation to the United States House of Representatives. Texas had twenty-seven seats in the House, up three from the 1970s, apportioned according to the 1980 United States Census.

<span class="mw-page-title-main">2020 United States state legislative elections</span> 2020 U.S. stage legislative elections

The 2020 United States state legislative elections were held on November 3, 2020, for 86 state legislative chambers in 44 states. Across the fifty states, approximately 65 percent of all upper house seats and 85 percent of all lower house seats were up for election. Nine legislative chambers in the five permanently-inhabited U.S. territories and the federal district of Washington, D.C. also held elections. The elections took place concurrently with several other federal, state, and local elections, including the presidential election, U.S. Senate elections, U.S. House elections, and gubernatorial elections.

<span class="mw-page-title-main">2012 Texas Senate election</span>

The 2012 Texas Senate elections took place as part of the biennial United States elections. Texas voters elected state senators in all 31 State Senate districts. The winners of this election served in the 83rd Texas Legislature, with seats apportioned among the 2010 United States census.

<span class="mw-page-title-main">2012 Texas House of Representatives election</span>

The 2012 Texas House of Representatives elections took place as part of the biennial United States elections. Texas voters elected state senators in all 150 State House of Representatives districts. The winners of this election served in the 83rd Texas Legislature, with seats apportioned according to the 2010 United States census. State representatives serve for two-year terms.

The 1990 United States redistricting cycle took place following the completion of the 1990 United States census. In all fifty states, various bodies re-drew state legislative and congressional districts. States that are apportioned more than one seat in the United States House of Representatives also drew new districts for that legislative body. The resulting new districts were first implemented for the 1991 and 1992 elections, which saw Democrats lose nine seats from their U.S. House majority and lose sixteen state legislative chambers but continue to retain a majority of state legislative seats nationwide throughout the decade. To date, it is the last time that Democrats held a majority of state legislative seats throughout an entire census cycle.

<span class="mw-page-title-main">Redistricting in Texas</span>

Texas House of Representatives districts, Texas Senate districts, Texas Board of Education districts, and Texas's congressional districts are redistricted once every decade, usually in the year after the decennial United States census. According to the Texas Constitution, redistricting in Texas follows the regular legislative process; it must be passed by both houses of the Texas Legislature and signed by the governor of Texas—unless the legislature has sufficient votes to override a gubernatorial veto. Like many other states in the American South after the passage of the Voting Rights Act of 1965, federal judges and the United States Supreme Court have struck down Texas's congressional and legislative districts on multiple occasions, including in the 1960s, 1970s, 1980s, 1990s, and 2000s.

<span class="mw-page-title-main">2004 Texas House of Representatives election</span>

The 2004 Texas House of Representatives elections took place as part of the biennial United States elections. Texas voters elected state representatives in all 150 State House of Representatives districts. The winners of this election served in the 79th Texas Legislature. State representatives serve for two-year terms. Republicans maintained control of the House, losing one seat to the Democrats.

<span class="mw-page-title-main">2002 Texas House of Representatives election</span>

The 2002 Texas House of Representatives elections took place as part of the biennial United States elections. Texas voters elected state representatives in all 150 State House of Representatives districts. The winners of this election served in the 78th Texas Legislature, with seats apportioned according to the 2000 United States census. State representatives serve for two-year terms. Republicans gained control of the House with 88 seats to the Democrats' 62, giving them a governmental trifecta for the first time since Reconstruction.

<span class="mw-page-title-main">2000 Texas House of Representatives election</span>

The 2000 Texas House of Representatives elections took place as part of the biennial United States elections. Texas voters elected state representatives in all 150 State House of Representatives districts. The winners of this election served in the 77th Texas Legislature. State representatives serve for two-year terms. There was no net change in seat control, leaving Democrats with their majority of 78 out of 150 seats. As of 2023, this is the last time Democrats won control of the Texas House of Representatives.

<span class="mw-page-title-main">1998 Texas House of Representatives election</span>

The 1998 Texas House of Representatives elections took place as part of the biennial United States elections. Texas voters elected state representatives in all 150 State House of Representatives districts. The winners of this election served in the 76th Texas Legislature. State representatives serve for two-year terms. Republicans gained four seats from the Democrats, reducing the Democratic majority to 78 out of 150 seats.

<span class="mw-page-title-main">1994 Texas House of Representatives election</span>

The 1994 Texas House of Representatives elections took place as part of the biennial United States elections. Texas voters elected state representatives in all 150 State House of Representatives districts. The winners of this election served in the 74th Texas Legislature. State representatives serve for two-year terms. Republicans gained a net of two seats from the Democrats, reducing the Democratic majority to 89 out of 150 seats.

<span class="mw-page-title-main">1992 Texas House of Representatives election</span>

The 1992 Texas House of Representatives elections took place as part of the biennial United States elections. Texas voters elected state representatives in all 150 State House of Representatives districts. The winners of this election served in the 73rd Texas Legislature, with seats apportioned according to the 1990 United States census. State representatives serve for two-year terms. Democrats maintained their majority of 92 out of 150 seats. As of 2023, this is the last time Democrats won the statewide popular vote for the Texas House.

References

  1. Stutz, Terrence (January 4, 1995). "Bush picks Democrat to insurance post Rep. Bomer named; interim official urged to delay hearing on anti-bias rules". The Dallas Morning News . pp. 1A. ProQuest   282959002 . Retrieved June 4, 2023.
  2. "Republican wins District 11 seat in special vote". Houston Chronicle . February 13, 1995. p. 15.
  3. Attlesey, Sam (June 27, 1995). "Laughlin, tops list of converts to GOP He says switch is about principles". The Dallas Morning News . pp. 11A. ProQuest   282875840 . Retrieved June 4, 2023.
  4. 1 2 "History". redistricting.capitol.texas.gov. Retrieved March 16, 2023.
  5. Bickerstaff, Steve (2020). Heath, C. Robert (ed.). Gerrymandering Texas. Lubbock, Texas: Texas Tech University Press. p. 124. ISBN   978-1-68283-073-4.
  6. Bickerstaff, Heath 2020, p. 127
  7. Ratcliffe, R.G. (September 16, 1995). "Temporary redistricting plan OK'd/Order to affect elections in 1996". The Houston Chronicle . p. 32.
  8. Knaggs, John (November 11, 1995). "Republicans see chance of Legislature control". Austin American Statesman . pp. A. 13. Retrieved June 17, 2023.
  9. "1996 General Election". elections.sos.state.tx.us. November 5, 1996. Retrieved June 5, 2023.