2010 Texas House of Representatives election

Last updated

2010 Texas House of Representatives election
Flag of Texas.svg
  2008 November 2, 2010 2012  

All 150 seats in the Texas House of Representatives
76 seats needed for a majority
 Majority partyMinority party
  Joe Straus voting (cropped).jpg
Dem
Leader Joe Straus Jim Dunnam
(Lost re-election)
Party Republican Democratic
Leader sinceJanuary 13, 2009January 14, 2003
Leader's seat 121st 57th
Last election7674
Seats before7773
Seats won9951
Seat changeIncrease2.svg22Decrease2.svg22
Popular vote2,795,9751,357,943
Percentage64.71%31.43%
SwingIncrease2.svg10.72%Decrease2.svg10.39%

TxHouse2010Election1.svg
2010 Texas State House election voteshares.svg
     Republican hold     Republican gain
     Democratic hold

Republican:     40–50%     50–60%     60–70%     70–80%     80–90%     ≥90%

Contents

Democratic:     40–50%     50–60%     60–70%     70–80%     80–90%     ≥90%

The 2010 Texas House of Representatives elections took place as part of the biennial United States elections. Texas voters elected state senators in all 150 State House of Representatives districts. The winners of this election served in the 82nd Texas Legislature. State representatives serve for two-year terms.

Background

Following the 2008 elections, the Democrats nearly gained control of the House with 74 members to the Republicans' 76. Republicans saw the freshmen Democratic members elected in 2008 as vulnerable, as many of them had narrowly won and had been the first Democrats elected to those districts in decades. [1] Democrats also had a large number of incumbents in districts that voted heavily Republican on the national level. In November 2009, Democrat Chuck Hopson announced he had switched his party affiliation to Republican, increasing the size of the Republican caucus to 77. Hopson's district was the most Republican district in the state that had elected a Democrat in 2008. [2] Democrats needed to gain three seats from the Republicans in order to win the majority.

Campaign

Republicans very heavily targeted White Democrats representing rural districts that voted for John McCain in the 2008 presidential election. These conservative Democrats attempted to distance themselves from the national Democratic Party as pundits increasingly predicted a Republican wave election in opposition to the policies of President Barack Obama. [3]

Results

In the end, the Republicans routed the Democrats in the general election, erasing all of the gains they had made in 2006 and 2008, as well as defeating almost every Democrat representing a rural, Republican-leaning district. Democrats lost twenty two seats in the midst of a nationwide Republican wave election. [4] On December 14, 2010, Democrat Allan Ritter announced he would be changing his party affiliation to Republican. [5] On the same day, Democrat Aaron Peña announced he would be switching to the Republican Party as well, claiming that the Democratic Party no longer aligned with his conservative values. [6] This left the party balance at 101 Republicans and 49 Democrats at the start of the Eighty-second Texas Legislature when it convened on January 11, 2011.

Statewide

Summary of the November 2, 2010 Texas House of Representatives election results
Texas House of Representatives 2010.svg
PartyCandi-
dates
Votes %Seats+/–
Republican Party 1122,795,97564.71%99Increase2.svg22
Democratic Party 931,357,94331.43%51Decrease2.svg22
Libertarian Party 50155,1443.59%0
Green Party 21,8480.04%0
Independent 29,4730.22%0
Write-in 13570.01%0
Total100.00%150
Popular vote
Republican
64.71%
Democratic
31.43%
Libertarian
3.59%
Green
0.04%
Independent
0.22%
Write-in
0.01%
House seats won
Republican
66.67%
Democratic
33.33%

Close races

Seats where the margin of victory was under 10%:

  1. District 48, 0.02%
  2. District 106, 0.94% (gain)
  3. District 134, 1.36% (gain)
  4. District 93, 1.69% (gain)
  5. District 47, 3.49% (gain)
  6. District 101, 3.62% (gain)
  7. District 117, 3.78% (gain)
  8. District 149, 4.76%
  9. District 96, 4.78% (gain)
  10. District 78, 4.82% (gain)
  11. District 107, 4.89% (gain)
  12. District 33, 5.02% (gain)
  13. District 35, 5.62% (gain)
  14. District 57, 5.92% (gain)
  15. District 23, 6.32%
  16. District 105, 6.81%
  17. District 45, 7.82% (gain)
  18. District 34, 7.92% (gain)
  19. District 102, 9.28% (gain)
  20. District 74, 9.64%

Notable races

District 11: Representative Chuck Hopson (D-Jacksonville) was re-elected as a Democrat in 2008 with 49.29% of the vote. On November 6, 2009, he announced that he would switch parties and seek re-election as a Republican. He would later go on to win re-election in 2010 with 75.82% of the vote

Results by district

District Democratic Republican OthersTotalResult
Votes%Votes%Votes%Votes%
District 1 14,71740.81%18,57551.51%2,7667.67%36,058100.00%Republican GAIN
District 2 --26,604100.00%--26,604100.00%Republican Hold
District 3 14,64541.51%19,97456.61%6651.88%35,284100.00%Republican GAIN
District 4 --14,904100.00%--14,904100.00%Republican Hold
District 5 --33,980100.00%--33,980100.00%Republican Hold
District 6 --30,61086.85%4,63413.15%35,244100.00%Republican Hold
District 7 --27,06991.27%2,5898.73%29,658100.00%Republican Hold
District 8 7,90625.61%22,96974.39%--30,875100.00%Republican Hold
District 9 9,16927.85%23,75472.15%--32,923100.00%Republican Hold
District 10 --31,797100.00%--31,797100.00%Republican Hold
District 11 8,63524.18%27,07475.82%--35,709100.00%Republican Hold
District 12 15,40542.36%20,95857.64%--36,363100.00%Republican GAIN
District 13 --31,741100.00%--31,741100.00%Republican Hold
District 14 --27,938100.00%--27,938100.00%Republican Hold
District 15 --52,55090.45%5,5469.55%58,096100.00%Republican Hold
District 16 --38,959100.00%--38,959100.00%Republican Hold
District 17 13,86831.94%28,26665.09%1,2912.97%43,425100.00%Republican Hold
District 18 --26,86289.57%3,12810.43%29,990100.00%Republican Hold
District 19 --28,261100.00%--28,261100.00%Republican Hold
District 20 --44,90182.55%9,49017.45%54,391100.00%Republican Hold
District 21 19,432100.00%----19,432100.00%Democratic Hold
District 22 16,552100.00%----16,552100.00%Democratic Hold
District 23 17,63153.16%15,53446.84%--33,165100.00%Democratic Hold
District 24 --39,19388.71%4,98911.29%44,182100.00%Republican Hold
District 25 --25,368100.00%--25,368100.00%Republican Hold
District 26 15,34433.37%29,72164.63%9222.00%45,987100.00%Republican Hold
District 27 32,03084.64%--5,81215.36%37,842100.00%Democratic Hold
District 28 17,62828.56%44,09471.44%61,722100.00%Republican Hold
District 29 --33,01184.69%5,96915.31%38,980100.00%Republican Hold
District 30 --29,045100.00%--29,045100.00%Republican Hold
District 31 12,724100.00%----12,724100.00%Democratic Hold
District 32 --28,215100.00%--28,215100.00%Republican Hold
District 33 11,30647.49%12,49952.51%--23,805100.00%Republican GAIN
District 34 11,85546.04%13,89253.96%--25,747100.00%Republican GAIN
District 35 13,69247.19%15,32452.81%--29,016100.00%Republican GAIN
District 36 -------100.00%Democratic Hold
District 37 9,640100.00%----9,640100.00%Democratic Hold
District 38 12,466100.00%----12,466100.00%Democratic Hold
District 39 -------100.00%Democratic Hold
District 40 -------100.00%Democratic Hold
District 41 10,61256.98%8,01243.02%--18,624100.00%Democratic Hold
District 42 18,798100.00%----18,798100.00%Democratic Hold
District 43 12,35177.90%--3,50322.10%15,854100.00%Democratic Hold
District 44 --37,037100.00%--37,037100.00%Republican Hold
District 45 23,69146.09%27,71553.91%--51,406100.00%Republican GAIN
District 46 18,43084.19%--3,46215.81%21,892100.00%Democratic Hold
District 47 27,77346.19%29,87349.68%2,4854.13%60,131100.00%Republican GAIN
District 48 25,02348.54%25,01148.52%1,5192.95%51,553100.00%Democratic Hold
District 49 30,42385.29%--5,24914.71%35,672100.00%Democratic Hold
District 50 23,72054.85%18,04141.72%1,4863.44%43,247100.00%Democratic Hold
District 51 12,98175.94%3,41219.96%7014.10%17,094100.00%Democratic Hold
District 52 16,82338.01%25,43057.45%2,0124.55%44,265100.00%Republican GAIN
District 53 --36,42489.90%4,09310.10%40,517100.00%Republican Hold
District 54 --22,111100.00%--22,111100.00%Republican Hold
District 55 --24,04181.11%5,60018.89%29,641100.00%Republican Hold
District 56 16,55437.88%25,55458.48%15,913.64%43,669100.00%Republican Hold
District 57 12,74345.76%14,39151.68%7122.56%27,846100.00%Republican GAIN
District 58 7,40820.37%27,53775.73%1,4183.90%36,363100.00%Republican Hold
District 59 --19,98574.87%6,70725.13%26,692100.00%Republican Hold
District 60 --33,425100.00%--33,425100.00%Republican Hold
District 61 --34,51386.24%5,50813.76%40,021100.00%Republican Hold
District 62 --26,13387.72%3,65712.28%29,790100.00%Republican Hold
District 63 --43,477100.00%--43,477100.00%Republican Hold
District 64 --26,05780.72%6,22419.28%32,281100.00%Republican Hold
District 65 --27,58582.43%5,87817.57%33,463100.00%Republican Hold
District 66 --25,279100.00%--25,279100.00%Republican Hold
District 67 --19,070100.00%--19,070100.00%Republican Hold
District 68 --29,140100.00%--29,140100.00%Republican Hold
District 69 7,26825.83%20,87274.17%--28,140100.00%Republican GAIN
District 70 --43,006100.00%--43,006100.00%Republican Hold
District 71 --24,46788.07%3,31311.93%27,780100.00%Republican Hold
District 72 --23,933100.00%--23,933100.00%Republican Hold
District 73 --49,84685.51%8,44614.49%58,282100.00%Republican Hold
District 74 15,72054.82%12,95745.18%--28,677100.00%Democratic Hold
District 75 11,545100.00%----11,545100.00%Democratic Hold
District 76 11,318100.00%----11,318100.00%Democratic Hold
District 77 9,508100.00%----9,508100.00%Democratic Hold
District 78 13,92747.59%15,33752.41%--29,264100.00%Republican GAIN
District 79 10,59184.34%--1,96715.66%12,558100.00%Democratic Hold
District 80 18,652100.00%----18,652100.00%Democratic Hold
District 81 --21,048100.00%--21,048100.00%Republican Hold
District 82 --28,006100.00%--28,006100.00%Republican Hold
District 83 --33,824100.00%--33,824100.00%Republican Hold
District 84 7,24831.80%15,54168.20%--22,789100.00%Republican Hold
District 85 10,71338.09%17,41661.91%--28,129100.00%Republican GAIN
District 86 --32,375100.00%--32,375100.00%Republican Hold
District 87 4,14818.89%16,97977.33%8303.78%21,957100.00%Republican Hold
District 88 --25,263100.00%--25,263100.00%Republican Hold
District 89 --43,947100.00%--43,947100.00%Republican Hold
District 90 7,75965.32%4,12034.68%--11,879100.00%Democratic Hold
District 91 --22,445100.00%--22,445100.00%Republican Hold
District 92 9,30728.52%23,33071.48%--32,637100.00%Republican Hold
District 93 12,13247.59%12,56349.28%7993.13%25,494100.00%Republican GAIN
District 94 --24,56584.53%4,49615.47%29,061100.00%Republican Hold
District 95 19,835100.00%----19,835100.00%Democratic Hold
District 96 21,58347.61%23,74752.39%--45,330100.00%Republican GAIN
District 97 --28,27586.41%4,44813.59%32,723100.00%Republican Hold
District 98 --46,750100.00%--46,750100.00%Republican Hold
District 99 --31,931100.00%--31,931100.00%Republican Hold
District 100 14,469100.00%----14,469100.00%Democratic Hold
District 101 12,33848.19%13,26651.81%--25,604100.00%Republican GAIN
District 102 11,79145.36%14,20254.64%--25,993100.00%Republican GAIN
District 103 7,626100.00%----7,626100.00%Democratic Hold
District 104 7,936100.00%----7,936100.00%Democratic Hold
District 105 9,79944.90%11,28651.71%7403.39%21,825100.00%Republican Hold
District 106 10,44448.50%10,64849.44%4442.06%51,536100.00%Republican GAIN
District 107 14,68346.48%16,22651.37%6482.15%31,587100.00%Republican GAIN
District 108 10,79332.71%21,42064.92%7832.37%32,996100.00%Republican Hold
District 109 34,91198.99%--3571.01%35,268100.00%Democratic Hold
District 110 15,866100.00%----15,866100.00%Democratic Hold
District 111 25,783100.00%----25,783100.00%Democratic Hold
District 112 --22,20683.22%4,47816.78%26,684100.00%Republican Hold
District 113 12,43042.85%16,57957.15%--29,009100.00%Republican Hold
District 114 11,00034.89%20,52965.11%--31,529100.00%Republican Hold
District 115 --22,94683.09%4,66916.91%27,615100.00%Republican Hold
District 116 16,889100.00%----16,889100.00%Democratic Hold
District 117 13,63548.11%14,70551.89%--28,340100.00%Republican GAIN
District 118 13,824100.00%----13,824100.00%Democratic Hold
District 119 13,39061.39%8,42238.61%--21,812100.00%Democratic Hold
District 120 14,700100.00%----14,700100.00%Democratic Hold
District 121 --32,713100.00%--32,713100.00%Republican Hold
District 122 16,57622.62%56,70277.38%--73,278100.00%Republican Hold
District 123 14,454100.00%----14,454100.00%Democratic Hold
District 124 15,26079.23%--4,00120.77%19,621100.00%Democratic Hold
District 125 16,59078.50%--4,54521.50%21,135100.00%Democratic Hold
District 126 11,93831.86%25,53468.14%--37,472100.00%Republican Hold
District 127 12,40624.75%37,72575.25%--50,131100.00%Republican Hold
District 128 --21,121100.00%--21,121100.00%Republican Hold
District 129 --31,526100.00%--31,526100.00%Republican Hold
District 130 --50,38988.93%6,27511.07%56,664100.00%Republican Hold
District 131 21,797100.00%----21,797100.00%Democratic Hold
District 132 14,76431.70%30,82866.19%9852.11%46,577100.00%Republican Hold
District 133 11,40342.43%15,12056.27%3491.30%26,872100.00%Republican GAIN
District 134 25,25449.32%25,95550.68%--51,209100.00%Republican GAIN
District 135 --22,390100.00%--22,390100.00%Republican Hold
District 136 --33,13088.58%4,27011.42%37,400100.00%Republican Hold
District 137 6,15158.72%4,32541.28%--10,476100.00%Democratic Hold
District 138 9,64635.49%17,00262.55%5321.96%27,180100.00%Republican Hold
District 139 20,842100.00%----20,842100.00%Democratic Hold
District 140 7,871100.00%----7,871100.00%Democratic Hold
District 141 19,59276.32%6,07823.68%--25,670100.00%Democratic Hold
District 142 21,147100.00%----21,147100.00%Democratic Hold
District 143 7,40968.30%3,43831.70%--10,847100.00%Democratic Hold
District 144 9,93138.28%15,42559.45%5882.27%25,944100.00%Republican Hold
District 145 9,395100.00%----9,395100.00%Democratic Hold
District 146 25,098100.00%----25,098100.00%Democratic Hold
District 147 22,312100.00%----22,312100.00%Democratic Hold
District 148 13,90358.68%9,79041.32%--23,693100.00%Democratic Hold
District 149 15,64152.23%14,30447.77%--29,945100.00%Democratic Hold
District 150 13,02726.84%34,60771.30%9041.86%48,538100.00%Republican Hold
Total1,357,94331.43%2,795,97564.71%166,8823.86%4,320,800100.00%Source: [7]

Related Research Articles

<span class="mw-page-title-main">1996 United States House of Representatives elections</span> House elections for the 105th U.S. Congress

The 1996 United States House of Representatives elections was an election for the United States House of Representatives on November 5, 1996, to elect members to serve in the 105th United States Congress. They coincided with the re-election of President Bill Clinton. Democrats won the popular vote by almost 60,000 votes (0.07%) and gained a net of two seats from the Republicans, but the Republicans retained an overall majority of seats in the House for the first time since 1928.

Thomas Russell Craddick is a Republican member of the Texas House of Representatives representing the 82nd district. Craddick was Speaker of the Texas House of Representatives from January 2003 to January 2009. He was the first Republican to serve as Speaker since Reconstruction.

<span class="mw-page-title-main">2008 United States House of Representatives elections</span> House elections for the 111th U.S. Congress

The 2008 United States House of Representatives elections were held on November 4, 2008, to elect members to the United States House of Representatives to serve in the 111th United States Congress from January 3, 2009, until January 3, 2011. It coincided with the election of Barack Obama as President. All 435 voting seats, as well as all 6 non-voting seats, were up for election. The Democratic Party, which won a majority of seats in the 2006 election, expanded its control in 2008.

<span class="mw-page-title-main">Hubert Vo</span> American politician

Hubert Vo is a Democratic member of the Texas House of Representatives for House District 149. He is the first and only Vietnamese American to be elected to the Texas legislature.

<span class="mw-page-title-main">2008 Texas Legislature election</span>

2008 elections for the Texas Legislature were held on Tuesday, November 4, 2008, in the U.S. state of Texas. The Texas Legislature election was conducted concurrently with the election for the 2008 United States presidential race, the United States Senate seat of Republican John Cornyn, and the state's 32 congressional representatives.

The following table indicates the party of elected officials in the U.S. state of Texas:

<span class="mw-page-title-main">Government of Mississippi</span> Government of the U.S. state of Mississippi

The Government of Mississippi is the government of the U.S. state of Mississippi. Power in Mississippi's government is distributed by the state's Constitution between the executive and legislative branches. The state's current governor is Tate Reeves. The Mississippi Legislature consists of the House of Representatives and Senate. Mississippi is one of only five states that elects its state officials in odd numbered years. Mississippi holds elections for these offices every four years in the years preceding Presidential election years. Thus, the last year when Mississippi elected a Governor was 2019, and the next gubernatorial election will occur in 2023.

<i>The Texas Tribune</i> Non-profit news organization covering politics and public policy in Texas

The Texas Tribune is a nonprofit politics and public policy news website headquartered in Austin, Texas. Its stated aim is to promote civic engagement through original, explanatory journalism and public events.

<span class="mw-page-title-main">2010 United States House of Representatives elections in Texas</span> 2010 House elections in Texas

The 2010 U.S. congressional elections in Texas were held on November 2, 2010, to determine who will represent the state of Texas in the United States House of Representatives. Representatives are elected for two-year terms; those elected served in the 112th Congress from January 2011 until January 2013.

<span class="mw-page-title-main">2010 Texas elections</span>

Elections were held in Texas on Tuesday, November 2, 2010. Primary elections were held on March 2, 2010.

<span class="mw-page-title-main">2012 United States House of Representatives elections in Texas</span> 2012 House elections in Texas

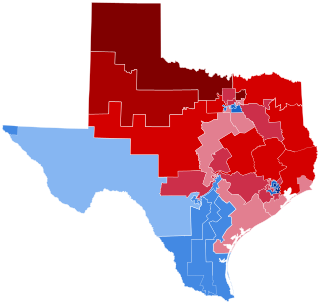
The 2012 United States House of Representatives elections in Texas were held on Tuesday, November 6, 2012, to elect the 36 U.S. representatives from the state of Texas—an increase of four seats in reapportionment following the 2010 United States Census. The elections coincided with the elections of other federal and state offices, including a quadrennial presidential election and an election for the U.S. Senate. The primary election had been scheduled to be held on March 6, 2012, with a runoff election on May 22; because of problems arising from redistricting, the primary was postponed to May 29, and the run-off to July 31.

<span class="mw-page-title-main">2002 United States House of Representatives elections in Texas</span> 2002 House elections in Texas

The 2002 United States House of Representatives elections in Texas occurred on November 5, 2002, to elect the members of the state of Texas's delegation to the United States House of Representatives. Texas had thirty-two seats in the House, apportioned according to the 2000 United States Census. The state gained two seats in reapportionment. Democrats narrowly maintained control of the Texas House of Representatives after the 2000 election after heavily emphasizing it as necessary to protect the party from a potential Republican gerrymander. During the 2001 regular session, the divided legislature failed to pass any redistricting plans. Congressional redistricting fell to the courts in Balderas v. State of Texas after no special session was called to address redistricting. While the court's initial map appeared to benefit Republicans, the final maps ordered for the 2002 elections were seen as beneficial to Democrats.
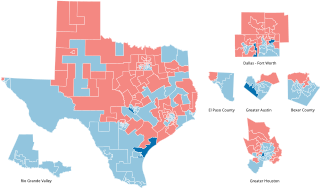
<span class="mw-page-title-main">2014 United States House of Representatives elections in Texas</span> 2014 House elections in Texas

The 2014 United States House of Representatives elections in Texas were held on Tuesday, November 4, 2014, to elect the 36 U.S. representatives from the state of Texas, one from each of the state's 36 congressional districts. The elections coincided with the elections of other federal and state offices, including a gubernatorial election and an election to the U.S. Senate.

<span class="mw-page-title-main">2008 Huntingdonshire District Council election</span>

The 2008 Huntingdonshire District Council election took place on 1 May 2008 to elect members of Huntingdonshire District Council in Cambridgeshire, England. One third of the council was up for election and the Conservative Party stayed in overall control of the council.

<span class="mw-page-title-main">2012 Texas Senate election</span>

The 2012 Texas Senate elections took place as part of the biennial United States elections. Texas voters elected state senators in all 31 State Senate districts. The winners of this election served in the 83rd Texas Legislature, with seats apportioned among the 2010 United States census.

<span class="mw-page-title-main">2010 Texas Senate election</span>

The 2010 Texas Senate elections took place as part of the biennial United States elections. Texas voters elected state senators in 16 State Senate districts. The winners of this election served in the 82nd Texas Legislature. State senators typically serve four-year terms in the Texas State Senate, but all Senators come up for election in the cycles following each decennial redistricting. As such, all of the seats up for this election were for two-year terms, with senators up for re-election in the following 2012 Texas State Senate elections.

<span class="mw-page-title-main">2012 Texas House of Representatives election</span>

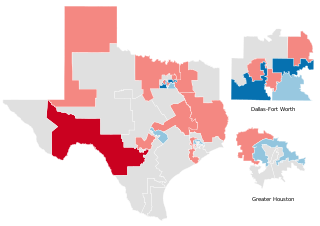
The 2012 Texas House of Representatives elections took place as part of the biennial United States elections. Texas voters elected state senators in all 150 State House of Representatives districts. The winners of this election served in the 83rd Texas Legislature, with seats apportioned according to the 2010 United States census. State representatives serve for two-year terms.

<span class="mw-page-title-main">2022 Texas's 34th congressional district special election</span> Election following resignation of Filemon Vela Jr.

The 2022 Texas's 34th congressional district special election was held on June 14, 2022. The seat, which went to Democratic president Joe Biden by only four points in the 2020 United States presidential election after being solidly blue in the past, became vacant after Democratic incumbent representative Filemon Vela Jr. resigned on March 31, 2022, to work at the law firm Akin Gump Strauss Hauer & Feld.

<span class="mw-page-title-main">2006 Texas House of Representatives election</span>

The 2006 Texas House of Representatives elections took place as part of the biennial United States elections. Texas voters elected state representatives in all 150 State House of Representatives districts. The winners of this election served in the 80th Texas Legislature. State representatives serve for two-year terms. Republicans maintained control of the House, losing five seats to the Democrats.

<span class="mw-page-title-main">2008 Texas House of Representatives election</span>

The 2008 Texas House of Representatives elections took place as part of the biennial United States elections. Texas voters elected state representatives in all 150 State House of Representatives districts. The winners of this election served in the 81st Texas Legislature. State representatives serve for two-year terms. Republicans maintained control of the House, losing three seats to the Democrats.

References

  1. Hu, Elise (2010-10-11). "A Sophomore Slump?". The Texas Tribune. Retrieved 2023-05-07.
  2. Ramsey, Ross (2009-11-06). "Hopson's Choice". The Texas Tribune. Retrieved 2023-05-07.
  3. Hamilton, Reeve (2010-10-08). "The Hunted". The Texas Tribune. Retrieved 2023-06-29.
  4. Brown, Brandi Grissom, Reeve Hamilton, Elise Hu, Ross Ramsey, Emily Ramshaw, Morgan Smith, Matt Stiles, Julián Aguilar, David Muto, Kate Galbraith, Becca Aaronson, Julie Chang, Tristan Hallman and Emily (2010-11-03). "Red November". The Texas Tribune. Retrieved 2023-05-07.{{cite web}}: CS1 maint: multiple names: authors list (link)
  5. Ramsey, Ross (2010-12-12). "TribBlog: Ritter Confirms He's Switching Parties". The Texas Tribune. Retrieved 2021-12-30.
  6. Hamilton, Reeve (2010-12-14). "TribBlog: Peña on Party Switching". The Texas Tribune. Retrieved 2022-01-15.
  7. "Race Summary Report – 2010 General Election". elections.sos.state.tx.us. Retrieved 2021-12-30.