| ||||||||||||||||||||||||||||
All 47 seats of the Maryland Senate 24 seats needed for a majority | ||||||||||||||||||||||||||||
---|---|---|---|---|---|---|---|---|---|---|---|---|---|---|---|---|---|---|---|---|---|---|---|---|---|---|---|---|
| ||||||||||||||||||||||||||||
|
Elections in Maryland |
---|
Government |
The 1994 Maryland Senate election were held on November 8, 1994, to elect senators in all 47 districts of the Maryland Senate. Members were elected in single-member constituencies to four-year terms. These elections were held concurrently with various federal and state elections, including for Governor of Maryland.
Republicans picked up six seats from the Democrats by tying themselves to the tax-cutting debate surrounding the gubernatorial election between Parris Glendening and Ellen Sauerbrey. This strategy was especially effective in Montgomery County, where Republicans campaigned on the county only getting 52 cents for every dollar in tax revenue it contributed to the state. The elections were marked by the legislature's highest turnover rate since 1974, which gave Republicans their largest legislative gains since the 1950s. [1]
Seats where the margin of victory was under 10%:
District 1 • District 2 • District 3 • District 4 • District 5 • District 6 • District 7 • District 8 • District 9 • District 10 • District 11 • District 12 • District 13 • District 14 • District 15 • District 16 • District 17 • District 18 • District 19 • District 20 • District 21 • District 22 • District 23 • District 24 • District 25 • District 26 • District 27 • District 28 • District 29 • District 30 • District 31 • District 32 • District 33 • District 34 • District 35 • District 36 • District 37 • District 38 • District 39 • District 40 • District 41 • District 42 • District 43 • District 44 • District 45 • District 46 • District 47 |
All election results are from the Maryland State Board of Elections. [17]
Party | Candidate | Votes | % | ||
---|---|---|---|---|---|
Republican | John J. Hafer (incumbent) | 20,496 | 71.4 | ||
Democratic | Edward A. Malloy Jr. | 8,209 | 28.6 | ||
Republican hold |
Party | Candidate | Votes | % | ||
---|---|---|---|---|---|
Republican | Donald F. Munson (incumbent) | 20,242 | 81.7 | ||
Democratic | Laura J. Wright | 4,535 | 18.3 | ||
Republican hold |
Party | Candidate | Votes | % | ||
---|---|---|---|---|---|
Republican | John W. Derr | 20,057 | 68.9 | ||
Democratic | Charles R. Luttrell | 9,034 | 31.1 | ||
Republican hold |
Party | Candidate | Votes | % | ||
---|---|---|---|---|---|
Republican | Timothy R. Ferguson | 15,975 | 52.4 | ||
Democratic | George H. Littrell Jr. | 14,496 | 47.6 | ||
Republican gain from Democratic |
Party | Candidate | Votes | % | ||
---|---|---|---|---|---|
Republican | Larry E. Haines (incumbent) | 22,599 | 63.7 | ||
Democratic | Cynthia Huggins Cummings | 12,857 | 36.3 | ||
Republican hold |
Party | Candidate | Votes | % | ||
---|---|---|---|---|---|
Democratic | Michael J. Collins (incumbent) | 12,463 | 54.2 | ||
Republican | Alfred E. Clasing Jr. | 10,511 | 45.8 | ||
Democratic hold |
Party | Candidate | Votes | % | ||
---|---|---|---|---|---|
Democratic | Norman R. Stone Jr. (incumbent) | 16,853 | 65.9 | ||
Republican | Russell Mirabile | 8,710 | 34.1 | ||
Democratic hold |
Party | Candidate | Votes | % | ||
---|---|---|---|---|---|
Democratic | Thomas L. Bromwell (incumbent) | 17,493 | 55.5 | ||
Republican | John J. Bishop | 14,052 | 44.5 | ||
Democratic hold |
Party | Candidate | Votes | % | ||
---|---|---|---|---|---|
Republican | F. Vernon Boozer (incumbent) | 27,143 | 100.0 | ||
Republican hold |
Party | Candidate | Votes | % | ||
---|---|---|---|---|---|
Democratic | Delores G. Kelley | 18,323 | 78.9 | ||
Republican | Jerome Goodman | 4,900 | 21.1 | ||
Democratic hold |
Party | Candidate | Votes | % | ||
---|---|---|---|---|---|
Democratic | Paula Hollinger | 24,226 | 63.2 | ||
Republican | Richard Manski | 14,082 | 36.8 | ||
Democratic hold |
Party | Candidate | Votes | % | ||
---|---|---|---|---|---|
Democratic | Edward J. Kasemeyer | 16,121 | 51.3 | ||
Republican | David P. Maier | 15,306 | 48.7 | ||
Democratic hold |
Party | Candidate | Votes | % | ||
---|---|---|---|---|---|
Republican | Martin G. Madden | 16,615 | 53.2 | ||
Democratic | Virginia M. Thomas | 14,640 | 46.8 | ||
Republican gain from Democratic |
Party | Candidate | Votes | % | ||
---|---|---|---|---|---|
Republican | Christopher J. McCabe (incumbent) | 23,219 | 54.7 | ||
Democratic | James P. Mundy | 19,199 | 45.3 | ||
Republican hold |
Party | Candidate | Votes | % | ||
---|---|---|---|---|---|
Republican | Jean Roesser | 20,272 | 55.0 | ||
Democratic | Laurence Levitan (incumbent) | 16,616 | 45.0 | ||
Republican gain from Democratic |
Party | Candidate | Votes | % | ||
---|---|---|---|---|---|
Democratic | Brian Frosh | 25,292 | 63.8 | ||
Republican | Daniel J. Cronin | 14,377 | 36.2 | ||
Democratic gain from Republican |
Party | Candidate | Votes | % | ||
---|---|---|---|---|---|
Democratic | Jennie M. Forehand | 19,194 | 97.8 | ||
Democratic | Lih Y. Young | 430 | 2.2 | ||
Democratic hold |
Party | Candidate | Votes | % | ||
---|---|---|---|---|---|
Democratic | Chris Van Hollen | 21,669 | 67.8 | ||
Republican | Albert E. Bullock | 10,231 | 32.0 | ||
Independent | Mark Merritt Spradley | 66 | 0.2 | ||
Democratic hold |
Party | Candidate | Votes | % | ||
---|---|---|---|---|---|
Democratic | Leonard H. Teitelbaum | 22,630 | 64.3 | ||
Republican | Lynn Siguenza | 12,569 | 35.7 | ||
Democratic hold |
Party | Candidate | Votes | % | ||
---|---|---|---|---|---|
Democratic | Ida G. Ruben (incumbent) | 18,353 | 70.0 | ||
Republican | John C. Leahy | 7,848 | 30.0 | ||
Democratic hold |
Party | Candidate | Votes | % | ||
---|---|---|---|---|---|
Democratic | Arthur Dorman (incumbent) | 12,801 | 64.9 | ||
Republican | Herman B. Bouma | 6,932 | 35.1 | ||
Democratic hold |
Party | Candidate | Votes | % | ||
---|---|---|---|---|---|
Democratic | Paul G. Pinsky (incumbent) | 11,713 | 63.1 | ||
Republican | John A. Schaffer | 6,849 | 36.9 | ||
Democratic hold |
Party | Candidate | Votes | % | ||
---|---|---|---|---|---|
Democratic | Leo E. Green (incumbent) | 23,606 | 100.0 | ||
Democratic hold |
Party | Candidate | Votes | % | ||
---|---|---|---|---|---|
Democratic | Decatur "Bucky" Trotter (incumbent) | 15,725 | 100.0 | ||
Democratic hold |
Party | Candidate | Votes | % | ||
---|---|---|---|---|---|
Democratic | Ulysses Currie | 16,019 | 100.0 | ||
Democratic hold |
Party | Candidate | Votes | % | ||
---|---|---|---|---|---|
Democratic | Gloria G. Lawlah (incumbent) | 17,590 | 76.8 | ||
Republican | Mary Bell G. Shepherd | 5,321 | 23.2 | ||
Democratic hold |
Party | Candidate | Votes | % | ||
---|---|---|---|---|---|
Democratic | Thomas V. Miller Jr. (incumbent) | 21,699 | 68.1 | ||
Republican | Joan Austin | 10,146 | 31.9 | ||
Democratic hold |
Party | Candidate | Votes | % | ||
---|---|---|---|---|---|
Democratic | Thomas M. Middleton | 14,195 | 56.8 | ||
Republican | James Easter | 10,804 | 43.2 | ||
Democratic hold |
Party | Candidate | Votes | % | ||
---|---|---|---|---|---|
Democratic | Roy Dyson | 16,660 | 56.8 | ||
Republican | James M. McKay | 12,678 | 43.2 | ||
Democratic hold |
Party | Candidate | Votes | % | ||
---|---|---|---|---|---|
Democratic | John Astle | 18,631 | 51.4 | ||
Republican | Mary McNally Rose | 17,613 | 48.6 | ||
Democratic hold |
Party | Candidate | Votes | % | ||
---|---|---|---|---|---|
Democratic | Philip C. Jimeno (incumbent) | 19,518 | 59.3 | ||
Republican | Nancy M. Schrum | 13,402 | 40.7 | ||
Democratic hold |
Party | Candidate | Votes | % | ||
---|---|---|---|---|---|
Republican | C. Edward Middlebrooks | 14,055 | 51.8 | ||
Democratic | Michael J. Wagner (incumbent) | 13,086 | 48.2 | ||
Republican gain from Democratic |
Party | Candidate | Votes | % | ||
---|---|---|---|---|---|
Republican | John A. Cade (incumbent) | 27,817 | 100.0 | ||
Republican hold |
Party | Candidate | Votes | % | ||
---|---|---|---|---|---|
Republican | David R. Craig | 17,444 | 54.3 | ||
Democratic | Habern W. Freeman (incumbent) | 14,676 | 45.7 | ||
Republican gain from Democratic |
Party | Candidate | Votes | % | ||
---|---|---|---|---|---|
Democratic | William H. Amoss (incumbent) | 19,993 | 54.4 | ||
Republican | Gwendalynne G. Corkran | 13,245 | 36.1 | ||
Independent | Catharine Wilson | 3,485 | 9.5 | ||
Democratic hold |
Party | Candidate | Votes | % | ||
---|---|---|---|---|---|
Democratic | Walter M. Baker (incumbent) | 17,981 | 98.3 | ||
Democratic | Janice L. Graham | 302 | 1.7 | ||
Democratic hold |
Party | Candidate | Votes | % | ||
---|---|---|---|---|---|
Republican | Richard F. Colburn | 16,224 | 54.9 | ||
Democratic | Samuel Q. Johnson III | 13,327 | 45.1 | ||
Republican gain from Democratic |
Party | Candidate | Votes | % | ||
---|---|---|---|---|---|
Republican | J. Lowell Stoltzfus (incumbent) | 21,783 | 66.9 | ||
Democratic | Dennis C. Donaldson | 10,794 | 33.1 | ||
Republican hold |
Party | Candidate | Votes | % | ||
---|---|---|---|---|---|
Republican | Patrick J. Hogan | 15,101 | 53.6 | ||
Democratic | Gene W. Counihan | 13,072 | 46.4 | ||
Republican gain from Democratic |
Party | Candidate | Votes | % | ||
---|---|---|---|---|---|
Democratic | Ralph M. Hughes (incumbent) | 15,133 | 94.5 | ||
Republican | Melvin Stubbs | 882 | 5.5 | ||
Democratic hold |
Party | Candidate | Votes | % | ||
---|---|---|---|---|---|
Democratic | Clarence W. Blount (incumbent) | 15,902 | 100.0 | ||
Democratic hold |
Party | Candidate | Votes | % | ||
---|---|---|---|---|---|
Democratic | Barbara A. Hoffman (incumbent) | 22,251 | 75.1 | ||
Republican | J. Gary Lee | 7,389 | 24.9 | ||
Democratic hold |
Party | Candidate | Votes | % | ||
---|---|---|---|---|---|
Democratic | John A. Pica Jr. (incumbent) | 18,374 | 100.0 | ||
Democratic hold |
Party | Candidate | Votes | % | ||
---|---|---|---|---|---|
Democratic | Larry Young (incumbent) | 10,460 | 100.0 | ||
Democratic hold |
Party | Candidate | Votes | % | ||
---|---|---|---|---|---|
Democratic | Nathaniel J. McFadden | 12,568 | 100.0 | ||
Democratic hold |
Party | Candidate | Votes | % | ||
---|---|---|---|---|---|
Democratic | Perry Sfikas | 13,578 | 100.0 | ||
Democratic hold |
Party | Candidate | Votes | % | ||
---|---|---|---|---|---|
Democratic | George W. Della Jr. (incumbent) | 12,575 | 61.8 | ||
Republican | John A. Hoffman | 7,764 | 38.2 | ||
Democratic hold |
The 2012 United States Senate election in Maryland took place on November 6, 2012, concurrently with the 2012 U.S. presidential election as well as other elections to the United States Senate, House of Representatives, and various state and local elections. Incumbent Democratic U.S. Senator Ben Cardin won re-election to a second term, defeating Republican nominee Dan Bongino and independent Rob Sobhani.
The 2016 United States Senate election in Maryland took place on November 8, 2016, to elect a member of the United States Senate to represent the State of Maryland, concurrently with the 2016 U.S. presidential election, as well as other elections to the United States Senate in other states and elections to the United States House of Representatives and various state and local elections.
The 1994 Maryland gubernatorial election was held on November 8, 1994. Incumbent Democratic governor William Donald Schaefer was ineligible for re-election. Prince George's County Executive Parris Glendening emerged victorious from the Democratic primary after defeating several candidates. Maryland House minority leader Ellen Sauerbrey, who would also be the 1998 Republican nominee for governor, won her party's nomination.
Elections for the Maryland Senate were held on November 6, 2018, with all 47 seats being contested. Republicans had initially hoped to break the Democrats' supermajority in the upper chamber by knocking off five incumbents, known as their "Drive for Five" plan. Though they did make a net gain of one seat, they came short of their goal. Three seats switched hands: District 9 in Carroll and Howard Counties flipped from Republican to Democratic while District 38 in Somerset, Wicomico, and Worcester Counties and District 42 in Baltimore County both flipped from Democrats to Republicans.
The 2024 United States Senate election in Maryland was held on November 5, 2024, to elect a member of the United States Senate to represent the state of Maryland. Democratic Prince George's County executive Angela Alsobrooks defeated Republican former Governor Larry Hogan in the contest to succeed Democratic incumbent Ben Cardin, who is not seeking a fourth term. Alsobrooks will be the first African American and second woman to represent Maryland in the Senate.
The 2018 Maryland House of Delegates elections were held on November 6, 2018, as part of the biennial United States elections. All 141 of Maryland's state delegates were up for reelection.
The 2006 Maryland Senate elections were held on November 7, 2006, as part of the 2006 United States elections, including the 2006 Maryland gubernatorial election. All 47 of Maryland's state senators were up for reelection. Neither party netted seats, allowing Democrats to retain supermajority control of the chamber.
The 2022 Maryland Senate election were held on November 8, 2022, to elect senators in all 47 districts of the Maryland Senate. Members were elected in single-member constituencies to four-year terms. These elections were held concurrently with various federal and state elections, including for governor of Maryland. The Democratic and Republican primaries were held on July 19, 2022.
The 2022 Maryland House of Delegates election was held on November 8, 2022, electing all 141 members of the chamber. This coincided with the election of all 47 of Maryland's state senators, along with other statewide offices. The Democratic and Republican primaries were held on July 19, 2022.
The 2014 Maryland Senate election were held on November 4, 2014, to elect senators in all 47 districts of the Maryland Senate. Members were elected in single-member constituencies to four-year terms. These elections were held concurrently with various federal and state elections, including for Governor of Maryland.
The 2014 Maryland House of Delegates elections were held on November 4, 2014, as part of the biennial United States elections. All 141 of Maryland's state delegates were up for reelection.
The 2002 Maryland Senate election were held on November 5, 2002, to elect senators in all 47 districts of the Maryland Senate. Members were elected in single-member constituencies to four-year terms. These elections were held concurrently with various federal and state elections, including for Governor of Maryland.
The 2002 Maryland House of Delegates elections were held on November 5, 2002, as part of the 2002 United States elections, including the 2002 Maryland gubernatorial election. All 141 of Maryland's state delegates were up for reelection.
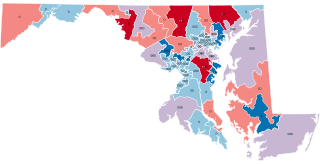
The 1998 Maryland House of Delegates elections were held on November 3, 1998, as part of the 1998 United States elections, including the 1998 Maryland gubernatorial election. All 141 of Maryland's state delegates were up for reelection.
The 1998 Maryland Senate election were held on November 3, 1998, to elect senators in all 47 districts of the Maryland Senate. Members were elected in single-member constituencies to four-year terms. These elections were held concurrently with various federal and state elections, including for Governor of Maryland.
The 1990 Maryland Senate election were held on November 6, 1990, to elect senators in all 47 districts of the Maryland Senate. Members were elected in single-member constituencies to four-year terms. These elections were held concurrently with various federal and state elections, including for Governor of Maryland.
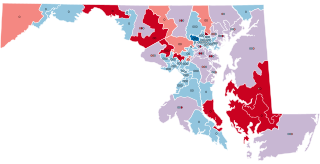
The 1994 Maryland House of Delegates elections were held on November 8, 1994, as part of the 1994 United States elections, including the 1994 Maryland gubernatorial election. All 141 of Maryland's state delegates were up for reelection.
The 1990 Maryland House of Delegates elections were held on November 6, 1990, as part of the 1990 United States elections, including the 1990 Maryland gubernatorial election. All 141 of Maryland's state delegates were up for reelection.
The 1986 Maryland House of Delegates elections were held on November 4, 1986, as part of the 1986 United States elections, including the 1986 Maryland gubernatorial election. All 141 of Maryland's state delegates were up for reelection.
The 1982 Maryland Senate elections were held on November 2, 1982, as part of the 1982 United States elections, including the 1982 Maryland gubernatorial election. All 47 of Maryland's state senators were up for reelection.