1896 United States presidential election in Maryland

Last updated

1896 United States presidential election in Maryland
Flag of Maryland (pre-1904).png
  1892 November 3, 1896 1900  
  William McKinley by Courtney Art Studio, 1896 (cropped).jpg William Jennings Bryan 2 (cropped).jpg
Nominee William McKinley William Jennings Bryan
Party Republican Democratic
Home state Ohio Nebraska
Running mate Garret Hobart Arthur Sewall
Electoral vote80
Popular vote136,959104,150
Percentage54.73%41.62%

Maryland Presidential Election Results 1896.svg
County Results

President before election

Grover Cleveland
Democratic

Elected President

William McKinley
Republican

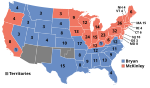
The 1896 United States presidential election in Maryland took place on November 3, 1896. All contemporary 45 states were part of the 1896 United States presidential election. States voters chose eight electors to the Electoral College, which selected the president and vice president.

Contents

Maryland was won by the Republican nominees, former Ohio Governor William McKinley and his running mate Garret Hobart of New Jersey. They defeated the Democratic nominee, former U.S. Representative from Nebraska William Jennings Bryan and his running mate Arthur Sewall. McKinley won the state by a margin of 13.11%.

This was the first time that a Republican presidential candidate won Maryland since Abraham Lincoln in 1864 and the Democrats would not win the state's popular vote until Woodrow Wilson in 1912.

In this election, Maryland voted 8.8% more Republican than the nation at-large. [1]

Bryan would lose Maryland to McKinley again four years later. In 1908, he would lose the popular vote to William Howard Taft but would win the electoral vote.

Results

1896 United States presidential election in Maryland [2]
PartyCandidateVotesPercentageElectoral votes
Republican William McKinley 136,95954.73%8
Democratic William Jennings Bryan101,76340.67%0
Populist William Jennings Bryan2,3870.95%0
Total William Jennings Bryan 104,15041.62%0
Prohibition Joshua Levering 5,9182.36%0
National Democratic John M. Palmer 2,4991.00%0
Socialist Labor Charles H. Matchett 5870.23%0
National Prohibition Charles E. Bentley 1360.05%0
Totals250,249100.00%8
Voter turnout

Results by county

CountyWilliam McKinley
Republican
William Jennings Bryan
Democratic
Joshua Levering
Prohibition
John McAuley Palmer
National Democratic
Various candidates
Other parties
MarginTotal votes cast [3]
#%#%#%#%#%#%
Allegany 5,46456.45%3,90740.36%2362.44%570.59%160.17%1,55716.08%9,680
Anne Arundel 4,03054.88%3,14542.83%1151.57%480.65%50.07%88512.05%7,343
Baltimore 9,21153.59%7,11041.37%5122.98%2801.63%750.44%2,10112.22%17,188
Baltimore City 61,96558.13%40,85938.33%1,9031.79%1,3501.27%5240.49%21,10619.80%106,601
Calvert 1,29457.95%88139.45%492.19%60.27%30.13%41318.50%2,233
Caroline 1,68648.45%1,65147.44%1103.16%250.72%80.23%351.01%3,480
Carroll 4,04749.72%3,84147.19%2092.57%350.43%80.10%2062.53%8,140
Cecil 3,12850.21%2,90846.68%991.59%881.41%70.11%2203.53%6,230
Charles 2,11759.99%1,37238.88%220.62%140.40%40.11%74521.11%3,529
Dorchester 3,04852.24%2,63845.21%1272.18%160.27%60.10%4107.03%5,835
Frederick 6,35253.20%5,21443.67%2792.34%880.74%70.06%1,1389.53%11,940
Garrett 2,05860.67%1,27737.65%411.21%140.41%20.06%78123.02%3,392
Harford 3,37447.49%3,36047.29%2924.11%731.03%60.08%140.20%7,105
Howard 1,98151.19%1,78646.15%591.52%360.93%80.21%1955.04%3,870
Kent 2,39953.73%1,98044.34%781.75%80.18%00.00%4199.38%4,465
Montgomery 3,21947.02%3,45650.48%1081.58%570.83%60.09%-237-3.46%6,846
Prince George's 3,25055.94%2,50543.12%250.43%280.48%20.03%74512.82%5,810
Queen Anne's 1,91741.53%2,51654.51%1433.10%320.69%80.17%-599-12.98%4,616
Somerset 2,64650.80%2,08440.01%4518.66%150.29%130.25%56210.79%5,209
St. Mary's 2,04457.56%1,47141.42%190.54%150.42%20.06%57316.14%3,551
Talbot 2,54251.50%2,18944.35%1513.06%501.01%40.08%3537.15%4,936
Washington 5,42853.57%4,38243.24%1971.94%1141.13%120.12%1,04610.32%10,133
Wicomico 2,02243.75%2,25348.75%3146.79%300.65%30.06%-231-5.00%4,622
Worcester 1,75642.59%1,96147.56%3799.19%200.49%70.17%-205-4.97%4,123
Totals136,97854.60%104,74641.75%5,9182.36%2,4991.00%7360.29%32,23212.85%250,877

Counties that flipped from Democratic to Republican

See also

References

  1. "Dave Leip's Atlas of U.S. Presidential Elections". uselectionatlas.org. Retrieved June 22, 2023.
  2. Dave Leip's U.S. Election Atlas; Presidential General Election Results – Maryland
  3. "Popular Vote at the Presidential Election for 1896". Géoelections.