
Christopher Van Hollen Jr. is an American attorney and politician serving as the junior United States senator from Maryland since 2017. A member of the Democratic Party, Van Hollen served as the U.S. representative for Maryland's 8th congressional district from 2003 to 2017.

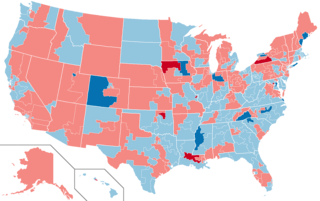
The 2002 United States House of Representatives elections were held on November 5, 2002, in the middle of President George W. Bush's first term, to elect U.S. Representatives to serve in the 108th United States Congress. This was the first congressional election using districts drawn up during the 2000 United States redistricting cycle on the basis of the 2000 census.

The 1992 United States House of Representatives elections were held on November 3, 1992, to elect U.S. Representatives to serve in the 103rd United States Congress. They coincided with the 1992 presidential election, in which Democrat Bill Clinton was elected president, defeating Republican incumbent President George H. W. Bush.
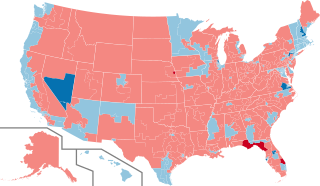
The 1986 United States House of Representatives elections was held on November 4, 1986, to elect U.S. Representatives to serve in the 100th United States Congress. They occurred in the middle of President Ronald Reagan's second term in office, while he was still relatively popular with the American public. As in most mid-term elections, the president's party — in this case, the Republican Party — lost seats, with the Democratic Party gaining a net of five seats and cementing its majority. These results were not as dramatic as those in the Senate, where the Republicans lost control of the chamber to the Democrats.

The 2012 United States House of Representatives elections in Maryland were held on Tuesday, November 6, 2012, to elect the eight U.S. representatives from the state of Maryland, one from each of the state's eight congressional districts. The elections coincided with the elections of other federal and state offices, including the quadrennial presidential election and an election to the U.S. Senate.

The 1994 Maryland Senate election were held on November 8, 1994, to elect senators in all 47 districts of the Maryland Senate. Members were elected in single-member constituencies to four-year terms. These elections were held concurrently with various federal and state elections, including for Governor of Maryland.
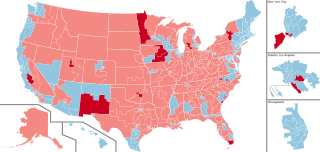
The 2016 United States House of Representatives elections were held on November 8, 2016, to elect representatives for all 435 congressional districts across each of the 50 U.S. states to the 115th United States Congress. Non-voting members for the District of Columbia and territories of the United States were also elected. These elections coincided with the election of President Donald Trump, although his party lost seats in both chambers of Congress. The winners of this election served in the 115th Congress, with seats apportioned among the states based on the 2010 United States census. In October 2015, the House elected a new Speaker, Republican Paul Ryan, who was re-elected in the new term. Democrat Nancy Pelosi continued to lead her party as Minority Leader. Elections were also held on the same day for the U.S. Senate, many governors, and other state and local elections.

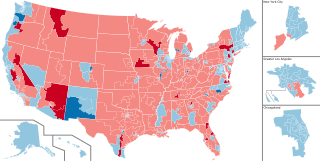
The 2018 United States House of Representatives elections were held on November 6, 2018, as part of the 2018 midterm elections during President Donald Trump's term, with early voting taking place in some states in the weeks preceding that date. Voters chose representatives from all 435 congressional districts across each of the 50 U.S. states to serve in the 116th United States Congress. Non-voting delegates from the District of Columbia and four of the five inhabited U.S. territories were also elected. On Election Day, Republicans had held a House majority since January 2011.
The 2020 United States House of Representatives elections were held on November 3, 2020, to elect representatives from all 435 congressional districts across each of the 50 U.S. states to the 117th United States Congress, as well as six non-voting delegates from the District of Columbia and the inhabited U.S. territories. Special House elections were also held on various dates throughout 2020.
The 2022 United States House of Representatives elections were held on November 8, 2022, as part of the 2022 United States elections during incumbent president Joe Biden's term. Representatives were elected from all 435 U.S. congressional districts across each of the 50 states to serve in the 118th United States Congress, as well as 5 non-voting members of the U.S. House of Representatives from the District of Columbia and four of the five inhabited insular areas. Numerous other federal, state, and local elections, including the 2022 U.S. Senate elections and the 2022 U.S. gubernatorial elections, were also held simultaneously. This was the first election after the 2020 redistricting cycle.

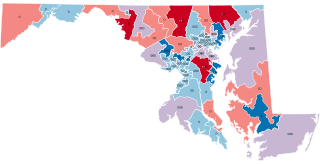
Elections for the Maryland Senate were held on November 6, 2018, with all 47 seats being contested. Republicans had initially hoped to break the Democrats' supermajority in the upper chamber by knocking off five incumbents, known as their "Drive for Five" plan. Though they did make a net gain of one seat, they came short of their goal. Three seats switched hands: District 9 in Carroll and Howard Counties flipped from Republican to Democratic while District 38 in Somerset, Wicomico, and Worcester Counties and District 42 in Baltimore County both flipped from Democrats to Republicans.

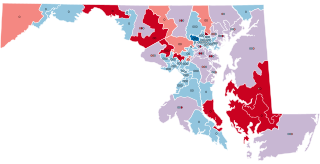
The 2018 Maryland House of Delegates elections were held on November 6, 2018, as part of the biennial United States elections. All 141 of Maryland's state delegates were up for reelection.

The 2024 United States House of Representatives elections were held on November 5, 2024, as part of the 2024 United States elections, to elect representatives from all 435 congressional districts across each of the 50 U.S. states, as well as 6 non-voting delegates from the District of Columbia and the inhabited U.S. territories to the United States House of Representatives. Special elections have also been held on various dates in 2024. Numerous other federal, state, and local elections, including the U.S. presidential election and elections to the Senate, were also held on this date. The winners of this election will serve in the 119th United States Congress, with seats apportioned among the states based on the 2020 United States census.

The 2014 Maryland House of Delegates elections were held on November 4, 2014, as part of the biennial United States elections. All 141 of Maryland's state delegates were up for reelection.

The 2002 Maryland Senate election were held on November 5, 2002, to elect senators in all 47 districts of the Maryland Senate. Members were elected in single-member constituencies to four-year terms. These elections were held concurrently with various federal and state elections, including for Governor of Maryland.

The 2002 Maryland House of Delegates elections were held on November 5, 2002, as part of the 2002 United States elections, including the 2002 Maryland gubernatorial election. All 141 of Maryland's state delegates were up for reelection.
The 1998 Maryland House of Delegates elections were held on November 3, 1998, as part of the 1998 United States elections, including the 1998 Maryland gubernatorial election. All 141 of Maryland's state delegates were up for reelection.
The 1986 Maryland Senate election were held on November 4, 1986, to elect senators in all 47 districts of the Maryland Senate. Members were elected in single-member constituencies to four-year terms. These elections were held concurrently with various federal and state elections, including for Governor of Maryland.
The 1994 Maryland House of Delegates elections were held on November 8, 1994, as part of the 1994 United States elections, including the 1994 Maryland gubernatorial election. All 141 of Maryland's state delegates were up for reelection.

The 1990 Maryland House of Delegates elections were held on November 6, 1990, as part of the 1990 United States elections, including the 1990 Maryland gubernatorial election. All 141 of Maryland's state delegates were up for reelection.


