| ||||||||||||||||||||||
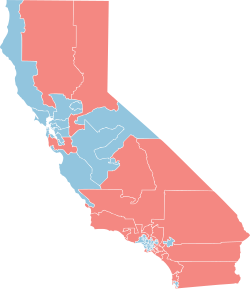
All 45 California seats to the United States House of Representatives | ||||||||||||||||||||||
---|---|---|---|---|---|---|---|---|---|---|---|---|---|---|---|---|---|---|---|---|---|---|
| ||||||||||||||||||||||
Results: Democratic hold Republican hold |
Elections in California |
---|
The United States House of Representatives elections in California of 1986 was an election for California's delegation to the United States House of Representatives, which occurred as part of the general election of the House of Representatives on November 4, 1986. No districts switched parties, so the delegation remained at 27 Democrats and 18 Republicans.
United States HoR elections in California, 1986 | ||||
---|---|---|---|---|
Party | Votes | % | Seats | |
Democratic | 3,793,542 | 52.32% | 27 | |
Republican | 3,328,109 | 45.90% | 18 | |
Libertarian | 71,448 | 0.99% | 0 | |
Peace and Freedom | 57,003 | 0.79% | 0 | |
Totals | 7,250,102 | 100.00% | 45 |
Final results from the clerk of the House of Representatives:
District 1 • District 2 • District 3 • District 4 • District 5 • District 6 • District 7 • District 8 • District 9 • District 10 • District 11 • District 12 • District 13 • District 14 |
Party | Candidate | Votes | % | |
---|---|---|---|---|
Democratic | Douglas H. Bosco (incumbent) | 138,174 | 67.48 | |
Republican | Floyd G. Sampson | 54,436 | 26.59 | |
Peace and Freedom | Elden McFarland | 12,149 | 5.93 | |
Total votes | 204,759 | 100.00 | ||
Turnout | ||||
Democratic hold | ||||
Party | Candidate | Votes | % | |
---|---|---|---|---|
Republican | Wally Herger | 109,758 | 58.25 | |
Democratic | Stephen C. Swendiman | 74,602 | 39.59 | |
Libertarian | Harry Hugh "Doc" Pendery | 4,054 | 2.15 | |
Total votes | 188,414 | 100.00 | ||
Turnout | ||||
Republican hold | ||||
Party | Candidate | Votes | % | |
---|---|---|---|---|
Democratic | Robert Matsui (incumbent) | 158,709 | 75.95 | |
Republican | Lowell Patrick Landowski | 50,265 | 24.05 | |
Total votes | 208,974 | 100.00 | ||
Turnout | ||||
Democratic hold | ||||
Party | Candidate | Votes | % | |
---|---|---|---|---|
Democratic | Vic Fazio (incumbent) | 128,364 | 70.16 | |
Republican | Jack D. Hite | 54,596 | 29.84 | |
Total votes | 182,960 | 100.00 | ||
Turnout | ||||
Democratic hold | ||||
Party | Candidate | Votes | % | |
---|---|---|---|---|
Democratic | Sala Burton (incumbent) | 122,688 | 75.17 | |
Republican | Mike Garza | 36,039 | 22.08 | |
Libertarian | Samuel K. "Sam" Grove | 2,409 | 1.48 | |
Peace and Freedom | Theodore Adrian "Ted" Zuur | 2,078 | 1.27 | |
Total votes | 163,214 | 100.00 | ||
Turnout | ||||
Democratic hold | ||||
Party | Candidate | Votes | % | |
---|---|---|---|---|
Democratic | Barbara Boxer (incumbent) | 142,946 | 73.85 | |
Republican | Franklin "Harry" Ernst III | 50,606 | 26.15 | |
Total votes | 193,552 | 100.00 | ||
Turnout | ||||
Democratic hold | ||||
Party | Candidate | Votes | % | |
---|---|---|---|---|
Democratic | George Miller (incumbent) | 124,174 | 66.56 | |
Republican | Rosemary Thaker | 62,379 | 33.44 | |
Total votes | 186,553 | 100.00 | ||
Turnout | ||||
Democratic hold | ||||
Party | Candidate | Votes | % | |
---|---|---|---|---|
Democratic | Ronald Dellums (incumbent) | 121,790 | 60.01 | |
Republican | Steven Eigenberg | 76,850 | 37.87 | |
Peace and Freedom | Lawrence R. Manuel | 4,295 | 2.12 | |
Total votes | 202,935 | 100.00 | ||
Turnout | ||||
Democratic hold | ||||
Party | Candidate | Votes | % | |
---|---|---|---|---|
Democratic | Pete Stark (incumbent) | 113,490 | 69.72 | |
Republican | David M. "Dave" Williams | 49,300 | 30.28 | |
Total votes | 162,790 | 100.00 | ||
Turnout | ||||
Democratic hold | ||||
Party | Candidate | Votes | % | |
---|---|---|---|---|
Democratic | Don Edwards (incumbent) | 84,240 | 70.46 | |
Republican | Michael R. La Crone | 31,826 | 26.62 | |
Libertarian | Perr Cardestam | 1,797 | 1.50 | |
Peace and Freedom | Bradley L. Mayer | 1,701 | 1.42 | |
Total votes | 119,564 | 100.00 | ||
Turnout | ||||
Democratic hold | ||||
Party | Candidate | Votes | % | |
---|---|---|---|---|
Democratic | Tom Lantos (incumbent) | 112,380 | 74.08 | |
Republican | Bill Quarishi | 39,315 | 25.92 | |
Total votes | 151,695 | 100.00 | ||
Turnout | ||||
Democratic hold | ||||
Party | Candidate | Votes | % | |
---|---|---|---|---|
Republican | Ernie Konnyu | 111,252 | 59.48 | |
Democratic | Lance T. Weil | 69,564 | 37.19 | |
Libertarian | William C. "Bill" White | 6,227 | 3.33 | |
Total votes | 187,043 | 100.00 | ||
Turnout | ||||
Republican hold | ||||
Party | Candidate | Votes | % | |
---|---|---|---|---|
Democratic | Norm Mineta (incumbent) | 107,696 | 69.73 | |
Republican | Bob Nash | 46,754 | 30.27 | |
Total votes | 154,450 | 100.00 | ||
Turnout | ||||
Democratic hold | ||||
Party | Candidate | Votes | % | |
---|---|---|---|---|
Republican | Norman D. Shumway (incumbent) | 146,906 | 71.61 | |
Democratic | Bill Steele | 53,597 | 26.12 | |
Libertarian | Bruce A. Daniel | 4,658 | 2.27 | |
Total votes | 205,161 | 100.00 | ||
Turnout | ||||
Republican hold | ||||
Party | Candidate | Votes | % | |
---|---|---|---|---|
Democratic | Tony Coelho (incumbent) | 93,600 | 71.03 | |
Republican | Carol Harner | 35,793 | 27.16 | |
Libertarian | Richard M. Harris | 2,382 | 1.81 | |
Total votes | 131,775 | 100.00 | ||
Turnout | ||||
Democratic hold | ||||
Party | Candidate | Votes | % | |
---|---|---|---|---|
Democratic | Leon Panetta (incumbent) | 128,151 | 78.38 | |
Republican | Louis Darrigo | 31,386 | 19.20 | |
Peace and Freedom | Ron Wright | 2,017 | 1.23 | |
Libertarian | Bill Anderson | 1,944 | 1.19 | |
Total votes | 163,498 | 100.00 | ||
Turnout | ||||
Democratic hold | ||||
Party | Candidate | Votes | % | |
---|---|---|---|---|
Republican | Charles (Chip) Pashayan (inc.) | 88,787 | 60.21 | |
Democratic | John Hartnett | 58,682 | 39.79 | |
Total votes | 147,469 | 100.00 | ||
Turnout | ||||
Republican hold | ||||
Party | Candidate | Votes | % | |
---|---|---|---|---|
Democratic | Richard Lehman (incumbent) | 101,480 | 71.27 | |
Republican | David C. Crevelt | 40,907 | 28.73 | |
Total votes | 142,387 | 100.00 | ||
Turnout | ||||
Democratic hold | ||||
Party | Candidate | Votes | % | |
---|---|---|---|---|
Republican | Bob Lagomarsino (incumbent) | 122,578 | 71.88 | |
Democratic | Wayne B. Norris | 45,619 | 26.75 | |
Libertarian | George Hasara | 2,341 | 1.37 | |
Total votes | 170,538 | 100.00 | ||
Turnout | ||||
Republican hold | ||||
Party | Candidate | Votes | % | |
---|---|---|---|---|
Republican | Bill Thomas (incumbent) | 129,989 | 72.61 | |
Democratic | Jules H. Moquin | 49,027 | 27.39 | |
Total votes | 179,016 | 100.00 | ||
Turnout | ||||
Republican hold | ||||
Party | Candidate | Votes | % | |
---|---|---|---|---|
Republican | Elton Gallegly | 132,090 | 68.41 | |
Democratic | Gilbert R. Saldana | 54,497 | 28.22 | |
Libertarian | Daniel Wiener | 6,504 | 3.37 | |
Total votes | 193,091 | 100.00 | ||
Turnout | ||||
Republican hold | ||||
Party | Candidate | Votes | % | |
---|---|---|---|---|
Republican | Carlos J. Moorhead (incumbent) | 141,096 | 73.80 | |
Democratic | John G. Simmons | 44,036 | 23.03 | |
Libertarian | Jona Joy Bergland | 3,114 | 1.63 | |
Peace and Freedom | Joel Lorimer | 2,930 | 1.53 | |
Total votes | 191,176 | 100.00 | ||
Turnout | ||||
Republican hold | ||||
Party | Candidate | Votes | % | |
---|---|---|---|---|
Democratic | Anthony C. Beilenson (incumbent) | 121,468 | 65.75 | |
Republican | George Woolverton | 58,746 | 31.80 | |
Peace and Freedom | Tom Hopke | 2,521 | 1.36 | |
Libertarian | Taylor Rhodes | 2,019 | 1.09 | |
Total votes | 184,754 | 100.00 | ||
Turnout | ||||
Democratic hold | ||||
Party | Candidate | Votes | % | |
---|---|---|---|---|
Democratic | Henry Waxman (incumbent) | 103,914 | 87.93 | |
Libertarian | George Abrahams | 8,871 | 7.51 | |
Peace and Freedom | James Green | 5,388 | 4.56 | |
Total votes | 118,173 | 100.00 | ||
Turnout | ||||
Democratic hold | ||||
Party | Candidate | Votes | % | |
---|---|---|---|---|
Democratic | Edward R. Roybal (incumbent) | 62,692 | 76.07 | |
Republican | Gregory L. Hardy | 17,558 | 21.30 | |
Libertarian | Ted Brown | 2,163 | 2.62 | |
Total votes | 82,413 | 100.00 | ||
Turnout | ||||
Democratic hold | ||||
Party | Candidate | Votes | % | |
---|---|---|---|---|
Democratic | Howard Berman (incumbent) | 98,091 | 65.07 | |
Republican | Robert M. Kerns | 52,662 | 34.93 | |
Total votes | 150,753 | 100.00 | ||
Turnout | ||||
Democratic hold | ||||
Party | Candidate | Votes | % | |
---|---|---|---|---|
Democratic | Mel Levine (incumbent) | 110,403 | 63.70 | |
Republican | Rob Scribner | 59,410 | 34.28 | |
Peace and Freedom | Thomas L. O'Connor, Jr. | 2,078 | 1.20 | |
Libertarian | Larry Leathers | 1,429 | 0.82 | |
Total votes | 173,320 | 100.00 | ||
Turnout | ||||
Democratic hold | ||||
Party | Candidate | Votes | % | |
---|---|---|---|---|
Democratic | Julian C. Dixon (incumbent) | 92,635 | 76.35 | |
Republican | George Zaldivar Adams | 25,858 | 21.31 | |
Libertarian | Howard Johnson | 2,837 | 2.34 | |
Total votes | 121,330 | 100.00 | ||
Turnout | ||||
Democratic hold | ||||
Party | Candidate | Votes | % | |
---|---|---|---|---|
Democratic | Augustus F. Hawkins (incumbent) | 78,132 | 84.54 | |
Republican | John Van de Brooke | 13,432 | 14.53 | |
Libertarian | Waheed R. Boctor | 851 | 0.92 | |
Total votes | 92,415 | 100.00 | ||
Turnout | ||||
Democratic hold | ||||
Party | Candidate | Votes | % | |
---|---|---|---|---|
Democratic | Matthew G. Martinez (incumbent) | 59,369 | 62.50 | |
Republican | John W. Almquist | 33,705 | 35.48 | |
Libertarian | Kim J. Goldsworthy | 1,911 | 2.01 | |
Total votes | 94,985 | 100.00 | ||
Turnout | ||||
Democratic hold | ||||
Party | Candidate | Votes | % | |
---|---|---|---|---|
Democratic | Mervyn M. Dymally (incumbent) | 77,126 | 70.25 | |
Republican | Jack McMurray | 30,322 | 27.62 | |
Peace and Freedom | B. Kwaku Duren | 2,333 | 2.13 | |
Total votes | 109,781 | 100.00 | ||
Turnout | ||||
Democratic hold | ||||
Party | Candidate | Votes | % | |
---|---|---|---|---|
Democratic | Glenn M. Anderson (incumbent) | 90,739 | 68.46 | |
Republican | Joyce M. Robertson | 39,003 | 29.43 | |
Peace and Freedom | John S. Donohue | 2,799 | 2.11 | |
Total votes | 132,541 | 100.00 | ||
Turnout | ||||
Democratic hold | ||||
Party | Candidate | Votes | % | |
---|---|---|---|---|
Republican | David Dreier (incumbent) | 118,541 | 71.69 | |
Democratic | Monty Hempel | 44,312 | 26.80 | |
Peace and Freedom | James Michael "Mike" Noonan | 2,500 | 1.51 | |
Total votes | 165,353 | 100.00 | ||
Turnout | ||||
Republican hold | ||||
Party | Candidate | Votes | % | |
---|---|---|---|---|
Democratic | Esteban Torres (incumbent) | 66,404 | 60.33 | |
Republican | Charles M. House | 43,659 | 39.67 | |
Total votes | 110,063 | 100.00 | ||
Turnout | ||||
Democratic hold | ||||
Party | Candidate | Votes | % | |
---|---|---|---|---|
Republican | Jerry Lewis (incumbent) | 127,235 | 76.85 | |
Democratic | Robert J. "Sarge" Hall | 38,322 | 23.15 | |
Total votes | 165,557 | 100.00 | ||
Turnout | ||||
Republican hold | ||||
Party | Candidate | Votes | % | |
---|---|---|---|---|
Democratic | George Brown, Jr. (incumbent) | 78,118 | 57.11 | |
Republican | Robert L. "Bob" Henley | 58,660 | 42.89 | |
Total votes | 136,778 | 100.00 | ||
Turnout | ||||
Democratic hold | ||||
Party | Candidate | Votes | % | |
---|---|---|---|---|
Republican | Al McCandless (incumbent) | 122,416 | 63.68 | |
Democratic | David E. "Dave" Skinner | 69,808 | 36.32 | |
Total votes | 192,224 | 100.00 | ||
Turnout | ||||
Republican hold | ||||
Party | Candidate | Votes | % | |
---|---|---|---|---|
Republican | Bob Dornan (incumbent) | 66,032 | 55.27 | |
Democratic | Richard H. Robinson | 50,625 | 42.38 | |
Libertarian | Lee Connelly | 2,807 | 2.35 | |
Total votes | 119,464 | 100.00 | ||
Turnout | ||||
Republican hold | ||||
Party | Candidate | Votes | % | |
---|---|---|---|---|
Republican | William E. Dannemeyer (incumbent) | 131,603 | 74.46 | |
Democratic | David D. Vest | 42,377 | 23.98 | |
Peace and Freedom | Frank Boeheim | 2,752 | 1.56 | |
Total votes | 176,732 | 100.00 | ||
Turnout | ||||
Republican hold | ||||
Party | Candidate | Votes | % | |
---|---|---|---|---|
Republican | Robert Badham (incumbent) | 119,829 | 59.76 | |
Democratic | Bruce W. Sumner | 75,664 | 37.73 | |
Peace and Freedom | Steve Sears | 5,025 | 2.51 | |
Total votes | 200,518 | 100.00 | ||
Turnout | ||||
Republican hold | ||||
Party | Candidate | Votes | % | |
---|---|---|---|---|
Republican | Bill Lowery (incumbent) | 133,566 | 67.83 | |
Democratic | Daniel F. "Dan" Kripke | 59,816 | 30.38 | |
Libertarian | Richard "Dick" Rider | 3,541 | 1.80 | |
Total votes | 196,923 | 100.00 | ||
Turnout | ||||
Republican hold | ||||
Party | Candidate | Votes | % | |
---|---|---|---|---|
Republican | Dan Lungren (incumbent) | 140,364 | 72.84 | |
Democratic | Michael P. Blackburn | 47,586 | 24.69 | |
Peace and Freedom | Kate McClatchy | 4,761 | 2.47 | |
Total votes | 192,711 | 100.00 | ||
Turnout | ||||
Republican hold | ||||
Party | Candidate | Votes | % | |
---|---|---|---|---|
Republican | Ron Packard (incumbent) | 137,341 | 73.14 | |
Democratic | Joseph Chirra | 45,078 | 24.00 | |
Libertarian | Phyllis Avery | 5,370 | 2.86 | |
Total votes | 187,789 | 100.00 | ||
Turnout | ||||
Republican hold | ||||
Party | Candidate | Votes | % | |
---|---|---|---|---|
Democratic | Jim Bates (incumbent) | 70,557 | 64.24 | |
Republican | Bill Mitchell | 36,359 | 33.10 | |
Peace and Freedom | Shirley Rachel Issacson | 1,676 | 1.53 | |
Libertarian | Dennis Thompson | 1,244 | 1.13 | |
Total votes | 109,836 | 100.00 | ||
Turnout | ||||
Democratic hold | ||||
Party | Candidate | Votes | % | |
---|---|---|---|---|
Republican | Duncan Hunter (incumbent) | 118,900 | 58.09 | |
Democratic | Hewitt Fitts Ryan | 82,800 | 40.45 | |
Libertarian | Lee Schwartz | 2,975 | 1.45 | |
Total votes | 204,675 | 100.00 | ||
Turnout | ||||
Republican hold | ||||
The United States House of Representatives elections in California, 1988 was an election for California's delegation to the United States House of Representatives, which occurred as part of the general election of the House of Representatives on November 8, 1988. No districts switched parties, so the delegation remained at 27 Democrats and 18 Republicans.
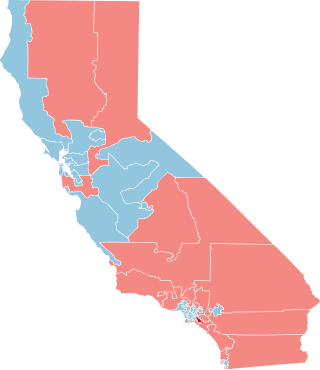
The United States House of Representatives elections in California of 1984 was an election for California's delegation to the United States House of Representatives, which occurred as part of the general election of the House of Representatives on November 6, 1984. Only one incumbent, Democrat Jerry M. Patterson, lost reelection.
The California United States House elections, 1976 was an election for California's delegation to the United States House of Representatives, which occurred as part of the general election of the House of Representatives on November 2, 1976. Democrats picked up one district, the 16th.
The United States House of Representatives elections in California, 1968 was an election for California's delegation to the United States House of Representatives, which occurred as part of the general election of the House of Representatives on November 5, 1968. The delegation remained unchanged, at 21 Democrats and 17 Republicans.
The United States House of Representatives elections in California, 1966 was an election for California's delegation to the United States House of Representatives, which occurred as part of the general election of the House of Representatives on November 8, 1966. Republicans gained three seats from the Democrats. There was a mid-decade redistricting of the California districts in 1966.
The United States House of Representatives elections in California, 1958 was an election for California's delegation to the United States House of Representatives, which occurred as part of the general election of the House of Representatives on November 4, 1958. Democrats picked up three seats, taking a majority of the delegation, which they would keep ever since except for a brief tie with the Republicans in the 104th Congress.
The United States House of Representatives elections in California, 1946 was an election for California's delegation to the United States House of Representatives, which occurred as part of the general election of the House of Representatives on November 5, 1946. Republicans captured control of Congress for the first time since 1928 due to the extreme unpopularity of President Harry Truman. California was indicative of the results as Republicans gained seven seats, one of which was won by a recently returned WWII veteran named Richard Nixon. Democrats would not regain a majority of the delegation until after the 1958 election.
The United States House of Representatives elections in California, 1944 was an election for California's delegation to the United States House of Representatives, which occurred as part of the general election of the House of Representatives on November 7, 1944. Democrats picked up four districts.
The United States House of Representatives elections in California, 1940 was an election for California's delegation to the United States House of Representatives, which occurred as part of the general election of the House of Representatives on November 5, 1940. Republicans gained two districts.
The United States House of Representatives elections in California, 1934 was an election for California's delegation to the United States House of Representatives, which occurred as part of the general election of the House of Representatives on November 6, 1934. Democrats gained three districts while losing one.
The United States House of Representatives elections in California, 1930 was an election for California's delegation to the United States House of Representatives, which occurred as part of the general election of the House of Representatives on November 4, 1930. California's delegation remained unchanged at 10 Republicans and 1 Democrat.
The United States House of Representatives elections in California, 1928 was an election for California's delegation to the United States House of Representatives, which occurred as part of the general election of the House of Representatives on November 6, 1928. California's House delegation remained unchanged at 10 Republicans and 1 Democrat.
The United States House of Representatives elections in California, 1924 was an election for California's delegation to the United States House of Representatives, which occurred as part of the general election of the House of Representatives on November 4, 1924. California's delegation remained unchanged at 9 Republicans and 2 Democrats.
The United States House of Representatives elections in California, 1922 was an election for California's delegation to the United States House of Representatives, which occurred as part of the general election of the House of Representatives on November 7, 1922. The districts were not reapportioned after the 1920 Census, so the state's delegation remained at 11 representatives, and the partisan makeup remained unchanged, at 9 Republicans and 2 Democrats.
The United States House of Representatives elections in California, 1910 was an election for California's delegation to the United States House of Representatives, which occurred as part of the general election of the House of Representatives on November 8, 1910. Complete Republican dominance of California's congressional delegation ended when Democrats narrowly won one district.
The United States House of Representatives elections in California, 1880 was an election for California's delegation to the United States House of Representatives, which occurred as part of the general election of the House of Representatives on November 2, 1880. Democrats gained one district.
The United States House of Representatives elections in California, 1879 were elections for California's delegation to the United States House of Representatives, which occurred on September 3, 1879. California's delegation remained unchanged, at three Republicans and one Democrat.
The United States House of Representatives elections in California, 1876 was an election for California's delegation to the United States House of Representatives, which occurred as part of the general election of the House of Representatives on November 7, 1876. Republicans gained two districts.
The United States House of Representatives elections in California, 1875 were elections for California's delegation to the United States House of Representatives, which occurred on September 7, 1875. Democrats gained two districts.
The United States House of Representatives elections in California, 1871 were elections for California's delegation to the United States House of Representatives, which occurred on September 6, 1871. Republicans gained both Democratic districts.