Elections in California |
---|
The United States House of Representatives elections in California, 1978 was an election for California's delegation to the United States House of Representatives, which occurred as part of the general election of the House of Representatives on November 7, 1978. Republicans knocked off three Democratic incumbents. 11th district Congressman Leo Ryan was re-elected, but was murdered while investigating the Peoples Temple in Guyana following the election.
United States House of Representatives elections in California, 1978 | ||||||
---|---|---|---|---|---|---|
Party | Votes | % | Before | After | +/– | |
Democratic | 3,335,332 | 51.11% | 29 | 26 | -3 | |
Republican | 3,105,933 | 47.60% | 14 | 17 | +3 | |
American Independent | 45,359 | 0.70% | 0 | 0 | 0 | |
Peace and Freedom | 39,017 | 0.60% | 0 | 0 | 0 | |
Totals | 6,525,641 | 100.00% | 43 | 43 | — |
Final results from the Clerk of the House of Representatives:
District 1 • District 2 • District 3 • District 4 • District 5 • District 6 • District 7 • District 8 • District 9 • District 10 • District 11 • District 12 • District 13 • District 14 |
Party | Candidate | Votes | % | |
---|---|---|---|---|
Democratic | Harold T. Johnson (incumbent) | 125,122 | 59.35 | |
Republican | James E. Taylor | 85,690 | 40.65 | |
Total votes | 210,812 | 100.00 | ||
Turnout | ||||
Democratic hold | ||||
Party | Candidate | Votes | % | |
---|---|---|---|---|
Republican | Don H. Clausen (incumbent) | 114,451 | 51.96 | |
Democratic | Norma Bork | 99,712 | 45.27 | |
Peace and Freedom | Irv Sutley | 6,097 | 2.77 | |
Total votes | 220,260 | 100.00 | ||
Turnout | ||||
Republican hold | ||||
Party | Candidate | Votes | % | |
---|---|---|---|---|
Democratic | Bob Matsui | 105,537 | 53.44 | |
Republican | Sandy Smoley | 91,966 | 46.56 | |
Total votes | 197,503 | 100.00 | ||
Turnout | ||||
Democratic hold | ||||
Party | Candidate | Votes | % | |
---|---|---|---|---|
Democratic | Vic Fazio | 87,764 | 55.37 | |
Republican | Rex Hime | 70,733 | 44.63 | |
Total votes | 158,497 | 100.00 | ||
Turnout | ||||
Democratic hold | ||||
Party | Candidate | Votes | % | |
---|---|---|---|---|
Democratic | John L. Burton (incumbent) | 106,046 | 66.84 | |
Republican | Dolores Skore | 52,603 | 33.16 | |
Total votes | 158,649 | 100.00 | ||
Turnout | ||||
Democratic hold | ||||
Party | Candidate | Votes | % | |
---|---|---|---|---|
Democratic | Phillip Burton (incumbent) | 81,801 | 68.30 | |
Republican | Tom Spinosa | 33,515 | 27.98 | |
American Independent | Raymond O. Heaps | 4,452 | 3.72 | |
Total votes | 119,768 | 100.00 | ||
Turnout | ||||
Democratic hold | ||||
Party | Candidate | Votes | % | |
---|---|---|---|---|
Democratic | George Miller (incumbent) | 109,676 | 63.45 | |
Republican | Paula Gordon | 58,332 | 33.74 | |
American Independent | Melvin E. Stanley | 4,857 | 2.81 | |
Total votes | 172,865 | 100.00 | ||
Turnout | ||||
Democratic hold | ||||
Party | Candidate | Votes | % | |
---|---|---|---|---|
Democratic | Ron Dellums (incumbent) | 94,824 | 57.36 | |
Republican | Charles V. Hughes | 70,481 | 42.64 | |
Total votes | 165,305 | 100.00 | ||
Turnout | ||||
Democratic hold | ||||
Party | Candidate | Votes | % | |
---|---|---|---|---|
Democratic | Pete Stark (incumbent) | 88,179 | 65.38 | |
Republican | Robert S. Allen | 41,138 | 30.50 | |
Peace and Freedom | Lawrance J. Phillips | 5,562 | 4.12 | |
Total votes | 134,879 | 100.00 | ||
Turnout | ||||
Democratic hold | ||||
Party | Candidate | Votes | % | |
---|---|---|---|---|
Democratic | Don Edwards (incumbent) | 84,488 | 67.13 | |
Republican | Rudy Hansen | 41,374 | 32.87 | |
Total votes | 125,862 | 100.00 | ||
Turnout | ||||
Democratic hold | ||||
Party | Candidate | Votes | % | |
---|---|---|---|---|
Democratic | Leo Ryan (incumbent) | 92,882 | 60.52 | |
Republican | Dave Welch | 54,621 | 35.59 | |
American Independent | Nicholas Waeil Kudrovzeff | 5,961 | 3.88 | |
Total votes | 153,464 | 100.00 | ||
Turnout | ||||
Democratic hold | ||||
Party | Candidate | Votes | % | |
---|---|---|---|---|
Republican | Pete McCloskey (incumbent) | 116,982 | 73.07 | |
Democratic | Kirsten Olsen | 34,472 | 21.53 | |
American Independent | Harold R. Boylan | 5,609 | 3.50 | |
Peace and Freedom | Adele Fumino | 3,022 | 1.89 | |
Total votes | 160,085 | 100.00 | ||
Turnout | ||||
Republican hold | ||||
Party | Candidate | Votes | % | |
---|---|---|---|---|
Democratic | Norman Mineta (incumbent) | 100,809 | 57.49 | |
Republican | Dan O'Keefe | 69,306 | 39.52 | |
Peace and Freedom | Robert Goldsborough III | 5,246 | 2.99 | |
Total votes | 175,361 | 100.00 | ||
Turnout | ||||
Democratic hold | ||||
Party | Candidate | Votes | % | |||
---|---|---|---|---|---|---|
Republican | Norman D. Shumway | 95,962 | 53.39 | |||
Democratic | John J. McFall (incumbent) | 76,602 | 42.62 | |||
American Independent | George Darold Waldron | 7,163 | 3.99 | |||
Total votes | 179,727 | 100.00 | ||||
Turnout | ||||||
Republican gain from Democratic | ||||||
Party | Candidate | Votes | % | |
---|---|---|---|---|
Democratic | Tony Coelho | 75,212 | 60.11 | |
Republican | Chris Patterakis | 49,914 | 39.89 | |
Total votes | 125,126 | 100.00 | ||
Turnout | ||||
Democratic hold | ||||
Party | Candidate | Votes | % | |
---|---|---|---|---|
Democratic | Leon Panetta (incumbent) | 104,550 | 61.37 | |
Republican | Eric Seastrand | 65,808 | 38.63 | |
Total votes | 170,358 | 100.00 | ||
Turnout | ||||
Democratic hold | ||||
Party | Candidate | Votes | % | |||
---|---|---|---|---|---|---|
Republican | Charles (Chip) Pashayan | 81,296 | 54.49 | |||
Democratic | John Hans Krebs (incumbent) | 67,885 | 45.51 | |||
Total votes | 149,181 | 100.00 | ||||
Turnout | ||||||
Republican gain from Democratic | ||||||
Party | Candidate | Votes | % | |
---|---|---|---|---|
Republican | Bill Thomas | 85,663 | 59.26 | |
Democratic | Bob Sogge | 58,900 | 40.74 | |
Total votes | 144,563 | 100.00 | ||
Turnout | ||||
Republican hold | ||||
Party | Candidate | Votes | % | |
---|---|---|---|---|
Republican | Robert J. Lagomarsino (incumbent) | 123,192 | 71.73 | |
Democratic | Jerry Zamos | 41,672 | 24.26 | |
Peace and Freedom | Milton Shiro Takei | 6,887 | 4.01 | |
Total votes | 171,751 | 100.00 | ||
Turnout | ||||
Republican hold | ||||
Party | Candidate | Votes | % | |
---|---|---|---|---|
Republican | Barry Goldwater, Jr. (incumbent) | 129,714 | 66.38 | |
Democratic | Pat Lear | 65,695 | 33.62 | |
Total votes | 195,409 | 100.00 | ||
Turnout | ||||
Republican hold | ||||
Party | Candidate | Votes | % | |
---|---|---|---|---|
Democratic | James C. Corman (incumbent) | 73,869 | 59.51 | |
Republican | Rod Walsh | 44,519 | 35.86 | |
Peace and Freedom | Bill Hill | 5,750 | 4.63 | |
Total votes | 124,138 | 100.00 | ||
Turnout | ||||
Democratic hold | ||||
Party | Candidate | Votes | % | |
---|---|---|---|---|
Republican | Carlos J. Moorhead (incumbent) | 99,502 | 64.64 | |
Democratic | Robert S. Henry | 54,442 | 35.36 | |
Total votes | 153,944 | 100.00 | ||
Turnout | ||||
Republican hold | ||||
Party | Candidate | Votes | % | |
---|---|---|---|---|
Democratic | Anthony C. Beilenson (incumbent) | 117,498 | 65.64 | |
Republican | Joseph Barbara | 61,496 | 34.36 | |
Total votes | 178,994 | 100.00 | ||
Turnout | ||||
Democratic hold | ||||
Party | Candidate | Votes | % | |
---|---|---|---|---|
Democratic | Henry Waxman (incumbent) | 85,075 | 62.66 | |
Republican | Howard G. Schaefer | 44,243 | 32.59 | |
Peace and Freedom | Kevin Casey Peters | 6,453 | 4.75 | |
Total votes | 135,771 | 100.00 | ||
Turnout | ||||
Democratic hold | ||||
Party | Candidate | Votes | % | |
---|---|---|---|---|
Democratic | Edward R. Roybal (incumbent) | 45,881 | 67.39 | |
Republican | Robert K. Watson | 22,205 | 32.61 | |
Total votes | 68,086 | 100.00 | ||
Turnout | ||||
Democratic hold | ||||
Party | Candidate | Votes | % | |
---|---|---|---|---|
Republican | John H. Rousselot (incumbent) | 113,059 | 100.00 | |
Turnout | ||||
Republican hold | ||||
Party | Candidate | Votes | % | |
---|---|---|---|---|
Republican | Bob Dornan (incumbent) | 89,392 | 51.00 | |
Democratic | Carey Peck | 85,880 | 49.00 | |
Total votes | 175,272 | 100.00 | ||
Turnout | ||||
Republican hold | ||||
Party | Candidate | Votes | % | |
---|---|---|---|---|
Democratic | Julian C. Dixon | 97,592 | 100.00 | |
Turnout | ||||
Democratic hold | ||||
Party | Candidate | Votes | % | |
---|---|---|---|---|
Democratic | Augustus F. Hawkins (incumbent) | 65,214 | 85.00 | |
Republican | Uriah J. Fields | 11,512 | 15.00 | |
Total votes | 76,726 | 100.00 | ||
Turnout | ||||
Democratic hold | ||||
Party | Candidate | Votes | % | |
---|---|---|---|---|
Democratic | George E. Danielson (incumbent) | 66,241 | 71.42 | |
Republican | Henry Ares | 26,511 | 28.58 | |
Total votes | 92,752 | 100.00 | ||
Turnout | ||||
Democratic hold | ||||
Party | Candidate | Votes | % | |
---|---|---|---|---|
Democratic | Charles H. Wilson (incumbent) | 55,667 | 67.76 | |
Republican | Don Grimshaw | 26,490 | 32.24 | |
Total votes | 82,157 | 100.00 | ||
Turnout | ||||
Democratic hold | ||||
Party | Candidate | Votes | % | |
---|---|---|---|---|
Democratic | Glenn M. Anderson (incumbent) | 74,004 | 71.43 | |
Republican | Sonya Mathison | 23,242 | 22.43 | |
American Independent | Ida Bader | 6,363 | 6.14 | |
Total votes | 103,609 | 100.00 | ||
Turnout | ||||
Democratic hold | ||||
Party | Candidate | Votes | % | |
---|---|---|---|---|
Republican | Wayne Grisham | 79,533 | 55.98 | |
Democratic | Dennis S. Kazarian | 62,540 | 44.02 | |
Total votes | 142,073 | 100.00 | ||
Turnout | ||||
Republican hold | ||||
Party | Candidate | Votes | % | |||
---|---|---|---|---|---|---|
Republican | Dan Lungren | 90,554 | 53.72 | |||
Democratic | Mark Hannaford (incumbent) | 73,608 | 43.67 | |||
American Independent | Lawrence John Stafford | 4,410 | 2.62 | |||
Total votes | 168,572 | 100.00 | ||||
Turnout | ||||||
Republican gain from Democratic | ||||||
Party | Candidate | Votes | % | |
---|---|---|---|---|
Democratic | Jim Lloyd (incumbent) | 80,388 | 54.01 | |
Republican | David Dreier | 68,442 | 45.99 | |
Total votes | 148,830 | 100.00 | ||
Turnout | ||||
Democratic hold | ||||
Party | Candidate | Votes | % | |
---|---|---|---|---|
Democratic | George Brown, Jr. (incumbent) | 80,448 | 62.92 | |
Republican | Dana Warren Carmody | 47,417 | 37.08 | |
Total votes | 127,865 | 100.00 | ||
Turnout | ||||
Democratic hold | ||||
Party | Candidate | Votes | % | |
---|---|---|---|---|
Republican | Jerry Lewis | 106,581 | 61.40 | |
Democratic | Dan Corcoran | 60,463 | 34.83 | |
American Independent | Bernard Wahl | 6,544 | 3.77 | |
Total votes | 173,588 | 100.00 | ||
Turnout | ||||
Republican hold | ||||
Party | Candidate | Votes | % | |
---|---|---|---|---|
Democratic | Jerry M. Patterson (incumbent) | 75,471 | 58.61 | |
Republican | Dan Goedeke | 53,298 | 41.39 | |
Total votes | 128,769 | 100.00 | ||
Turnout | ||||
Democratic hold | ||||
Party | Candidate | Votes | % | |
---|---|---|---|---|
Republican | William E. Dannemeyer | 112,160 | 63.71 | |
Democratic | William E. Farris | 63,891 | 36.29 | |
Total votes | 176,051 | 100.00 | ||
Turnout | ||||
Republican hold | ||||
Party | Candidate | Votes | % | |
---|---|---|---|---|
Republican | Robert Badham (incumbent) | 147,882 | 65.95 | |
Democratic | Jim McGuy | 76,358 | 34.05 | |
Total votes | 224,240 | 100.00 | ||
Turnout | ||||
Republican hold | ||||
Party | Candidate | Votes | % | |
---|---|---|---|---|
Republican | Bob Wilson (incumbent) | 107,685 | 58.14 | |
Democratic | King Golden, Jr. | 77,540 | 41.86 | |
Total votes | 185,225 | 100.00 | ||
Turnout | ||||
Republican hold | ||||
Party | Candidate | Votes | % | |
---|---|---|---|---|
Democratic | Lionel Van Deerlin (incumbent) | 85,126 | 73.74 | |
Republican | Lawrence C. Mattera | 30,319 | 26.26 | |
Total votes | 115,445 | 100.00 | ||
Turnout | ||||
Democratic hold | ||||
Party | Candidate | Votes | % | |
---|---|---|---|---|
Republican | Clair Burgener (incumbent) | 167,150 | 68.66 | |
Democratic | Reuben B. Brooks | 76,308 | 31.34 | |
Total votes | 243,458 | 100.00 | ||
Turnout | ||||
Republican hold | ||||
The United States House of Representatives elections in California, 1988 was an election for California's delegation to the United States House of Representatives, which occurred as part of the general election of the House of Representatives on November 8, 1988. No districts switched parties, so the delegation remained at 27 Democrats and 18 Republicans.
The United States House of Representatives elections in California of 1986 was an election for California's delegation to the United States House of Representatives, which occurred as part of the general election of the House of Representatives on November 4, 1986. No districts switched parties, so the delegation remained at 27 Democrats and 18 Republicans.
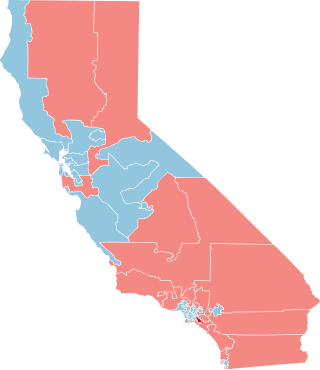
The United States House of Representatives elections in California of 1984 was an election for California's delegation to the United States House of Representatives, which occurred as part of the general election of the House of Representatives on November 6, 1984. Only one incumbent, Democrat Jerry M. Patterson, lost reelection.
The United States House of Representatives elections in California, 1980 was an election for California's delegation to the United States House of Representatives, which occurred as part of the general election of the House of Representatives on November 4, 1980. Republicans lost one seat but gained four Democratic-held seats.
The California United States House elections, 1976 was an election for California's delegation to the United States House of Representatives, which occurred as part of the general election of the House of Representatives on November 2, 1976. Democrats picked up one district, the 16th.
The United States House of Representatives elections in California, 1972 was an election for California's delegation to the United States House of Representatives, which occurred as part of the general election of the House of Representatives on November 7, 1972. California gained 5 seats as a result of the 1970 Census, three of which were won by Democrats and two by Republicans. Of California's existing House seats, none switched parties.
The United States House of Representatives elections in California, 1966 was an election for California's delegation to the United States House of Representatives, which occurred as part of the general election of the House of Representatives on November 8, 1966. Republicans gained three seats from the Democrats. There was a mid-decade redistricting of the California districts in 1966.
The United States House of Representatives elections in California, 1962 was an election for California's delegation to the United States House of Representatives, which occurred as part of the general election of the House of Representatives on November 6, 1962. California gained eight districts as a result of the 1960 Census, seven of which were won by Democrats and one by a Republican. Of California's existing districts, Democrats picked up three and lost one.
The California United States House of Representatives elections in California, 1956 was an election for California's delegation to the United States House of Representatives, which occurred as part of the general election of the House of Representatives on November 6, 1956. Democrats gained two seats from the Republicans. As of 2023, this is the last time that Republicans won a majority of congressional districts in California.
The United States House of Representatives elections in California, 1952 was an election for California's delegation to the United States House of Representatives, which occurred as part of the general election of the House of Representatives on November 4, 1952. California gained seven seats as a result of the 1950 Census, five of which were won by Republicans and two by Democrats. Of California's existing districts, Republicans won two Democratic-held seats.
The United States House of Representatives elections in California, 1950 was an election for California's delegation to the United States House of Representatives, which occurred as part of the general election of the House of Representatives on November 7, 1950. Republicans won one Democratic-held seat.
The United States House of Representatives elections in California, 1948 was an election for California's delegation to the United States House of Representatives, which occurred as part of the general election of the House of Representatives on November 2, 1948. Democrats picked up three districts while losing two for a net gain of one seat.
The United States House of Representatives elections in California, 1944 was an election for California's delegation to the United States House of Representatives, which occurred as part of the general election of the House of Representatives on November 7, 1944. Democrats picked up four districts.
The United States House of Representatives elections in California, 1940 was an election for California's delegation to the United States House of Representatives, which occurred as part of the general election of the House of Representatives on November 5, 1940. Republicans gained two districts.
The United States House of Representatives elections in California, 1936 was an election for California's delegation to the United States House of Representatives, which occurred as part of the general election of the House of Representatives on November 3, 1936. Democrats gained two Republican-held districts and the Progressive Party gained one Republican-held district.
The United States House of Representatives elections in California, 1934 was an election for California's delegation to the United States House of Representatives, which occurred as part of the general election of the House of Representatives on November 6, 1934. Democrats gained three districts while losing one.
The United States House of Representatives elections in California, 1924 was an election for California's delegation to the United States House of Representatives, which occurred as part of the general election of the House of Representatives on November 4, 1924. California's delegation remained unchanged at 9 Republicans and 2 Democrats.
The United States House of Representatives elections in California, 1920 was an election for California's delegation to the United States House of Representatives, which occurred as part of the general election of the House of Representatives on November 2, 1920. Republicans picked up two Democratic-held districts and defeated the lone Prohibition Party incumbent.
The United States House of Representatives elections in California, 1876 was an election for California's delegation to the United States House of Representatives, which occurred as part of the general election of the House of Representatives on November 7, 1876. Republicans gained two districts.
The United States House of Representatives elections in California, 1875 were elections for California's delegation to the United States House of Representatives, which occurred on September 7, 1875. Democrats gained two districts.