Elections in California |
---|
The United States House of Representatives elections in California, 1962 was an election for California's delegation to the United States House of Representatives, which occurred as part of the general election of the House of Representatives on November 6, 1962. California gained eight districts as a result of the 1960 census, seven of which were won by Democrats and one by a Republican. Of California's existing districts, Democrats picked up three and lost one.
United States House of Representatives elections in California, 1962 | ||||||
---|---|---|---|---|---|---|
Party | Votes | % | Before | After | +/– | |
Democratic | 2,891,618 | 51.88% | 16 | 25 | +9 | |
Republican | 2,679,662 | 48.08% | 14 | 13 | -1 | |
Scattering | 2,166 | 0.04% | 0 | 0 | 0 | |
Totals | 5,573,446 | 100.00% | 30 | 38 | +8 |
Final results from the Clerk of the House of Representatives:
District 1 • District 2 • District 3 • District 4 • District 5 • District 6 • District 7 • District 8 • District 9 • District 10 • District 11 • District 12 • District 13 • District 14 |
Party | Candidate | Votes | % | |
---|---|---|---|---|
Democratic | Clement Woodnutt Miller (inc.) | 100,962 | 50.75 | |
Republican | Don H. Clausen | 97,949 | 49.23 | |
No party | Scattering | 31 | 0.02 | |
Total votes | 198,942 | 100.00 | ||
Turnout | {{{votes}}} | |||
Democratic hold | ||||
Party | Candidate | Votes | % | |
---|---|---|---|---|
Democratic | Harold T. Johnson (incumbent) | 106,239 | 64.62 | |
Republican | Frederic H. Nagel | 58,150 | 35.37 | |
No party | Scattering | 8 | 0.00 | |
Total votes | 164,397 | 100.00 | ||
Turnout | {{{votes}}} | |||
Democratic hold | ||||
Party | Candidate | Votes | % | |
---|---|---|---|---|
Democratic | John E. Moss (incumbent) | 138,257 | 74.82 | |
Republican | George W. G. Smith | 46,510 | 25.17 | |
No party | Scattering | 24 | 0.01 | |
Total votes | 184,791 | 100.00 | ||
Turnout | {{{votes}}} | |||
Democratic hold | ||||
Party | Candidate | Votes | % | ||
---|---|---|---|---|---|
Democratic | Robert L. Leggett | 55,563 | 56.50 | ||
Republican | L. V. Honsinger | 42,762 | 43.48 | ||
No party | Scattering | 20 | 0.02 | ||
Total votes | 98,345 | 100.00 | |||
Turnout | {{{votes}}} | ||||
Democratic win (new seat) |
Party | Candidate | Votes | % | |
---|---|---|---|---|
Democratic | John F. Shelley (incumbent) | 64,493 | 80.44 | |
Republican | Roland S. Charles | 15,670 | 19.54 | |
No party | Scattering | 16 | 0.02 | |
Total votes | 80,179 | 100.00 | ||
Turnout | {{{votes}}} | |||
Democratic hold | ||||
Party | Candidate | Votes | % | |
---|---|---|---|---|
Republican | William S. Mailliard (incumbent) | 105,762 | 58.69 | |
Democratic | John A. O'Connell | 74,429 | 41.30 | |
No party | Scattering | 3 | 0.00 | |
Total votes | 180,194 | 100.00 | ||
Turnout | {{{votes}}} | |||
Democratic hold | ||||
Party | Candidate | Votes | % | |
---|---|---|---|---|
Democratic | Jeffery Cohelan (incumbent) | 86,215 | 64.48 | |
Republican | Leonard L. Cantando | 47,409 | 35.46 | |
No party | Scattering | 76 | 0.06 | |
Total votes | 133,700 | 100.00 | ||
Turnout | {{{votes}}} | |||
Democratic hold | ||||
Party | Candidate | Votes | % | |
---|---|---|---|---|
Democratic | George P. Miller (incumbent) | 97,014 | 72.49 | |
Republican | Harold Petersen | 36,810 | 27.51 | |
No party | Scattering | 3 | 0.00 | |
Total votes | 133,827 | 100.00 | ||
Turnout | {{{votes}}} | |||
Democratic hold | ||||
Party | Candidate | Votes | % | ||
---|---|---|---|---|---|
Democratic | Don Edwards | 79,616 | 65.94 | ||
Republican | Joseph F. Donovan | 41,104 | 34.04 | ||
No party | Scattering | 24 | 0.02 | ||
Total votes | 120,744 | 100.00 | |||
Turnout | {{{votes}}} | ||||
Democratic win (new seat) |
Party | Candidate | Votes | % | |
---|---|---|---|---|
Republican | Charles S. Gubser (incumbent) | 106,419 | 60.70 | |
Democratic | James P. Thurber, Jr. | 68,885 | 39.29 | |
No party | Scattering | 21 | 0.01 | |
Total votes | 175,325 | 100.00 | ||
Turnout | {{{votes}}} | |||
Republican hold | ||||
Party | Candidate | Votes | % | |
---|---|---|---|---|
Republican | J. Arthur Younger (incumbent) | 101,963 | 62.33 | |
Democratic | John D. Kaster | 61,623 | 37.67 | |
No party | Scattering | 5 | 0.00 | |
Total votes | 163,591 | 100.00 | ||
Turnout | {{{votes}}} | |||
Republican hold | ||||
Party | Candidate | Votes | % | ||
---|---|---|---|---|---|
Republican | Burt L. Talcott | 75,424 | 61.31 | ||
Democratic | William K. Steward | 47,576 | 38.67 | ||
No party | Scattering | 26 | 0.02 | ||
Total votes | 123,026 | 100.00 | |||
Turnout | {{{votes}}} | ||||
Republican win (new seat) |
Party | Candidate | Votes | % | |
---|---|---|---|---|
Republican | Charles M. Teague (incumbent) | 84,743 | 64.94 | |
Democratic | George J. Holgate | 45,746 | 35.05 | |
No party | Scattering | 12 | 0.01 | |
Total votes | 130,501 | 100.00 | ||
Turnout | {{{votes}}} | |||
Republican hold | ||||
Party | Candidate | Votes | % | |
---|---|---|---|---|
Republican | John F. Baldwin, Jr. (incumbent) | 99,040 | 62.88 | |
Democratic | Charles R. Weidner | 58,469 | 37.12 | |
No party | Scattering | 9 | 0.01 | |
Total votes | 157,518 | 100.00 | ||
Turnout | {{{votes}}} | |||
Republican hold | ||||
Party | Candidate | Votes | % | |
---|---|---|---|---|
Democratic | John J. McFall (incumbent) | 97,322 | 69.99 | |
Republican | Clifford B. Bull | 41,726 | 30.01 | |
No party | Scattering | 5 | 0.00 | |
Total votes | 139,053 | 100.00 | ||
Turnout | {{{votes}}} | |||
Democratic hold | ||||
Party | Candidate | Votes | % | |
---|---|---|---|---|
Democratic | Bernice F. Sisk (incumbent) | 108,339 | 71.87 | |
Republican | Arthur L. Selland | 42,401 | 28.13 | |
No party | Scattering | 11 | 0.01 | |
Total votes | 150,751 | 100.00 | ||
Turnout | {{{votes}}} | |||
Democratic hold | ||||
Party | Candidate | Votes | % | |
---|---|---|---|---|
Democratic | Cecil R. King (incumbent) | 74,964 | 67.15 | |
Republican | Ted Bruinsma | 36,663 | 32.84 | |
No party | Scattering | 5 | 0.00 | |
Total votes | 111,632 | 100.00 | ||
Turnout | {{{votes}}} | |||
Democratic hold | ||||
Party | Candidate | Votes | % | |
---|---|---|---|---|
Democratic | Harlan Hagen (incumbent) | 91,684 | 58.88 | |
Republican | G. Ray Arnett | 64,037 | 41.12 | |
No party | Scattering | 4 | 0.00 | |
Total votes | 155,725 | 100.00 | ||
Turnout | {{{votes}}} | |||
Democratic hold | ||||
Party | Candidate | Votes | % | |
---|---|---|---|---|
Democratic | Chet Holifield (incumbent) | 78,436 | 61.55 | |
Republican | Robert T. Ramsay | 48,976 | 38.43 | |
No party | Scattering | 21 | 0.02 | |
Total votes | 127,433 | 100.00 | ||
Turnout | {{{votes}}} | |||
Democratic hold | ||||
Party | Candidate | Votes | % | |
---|---|---|---|---|
Republican | H. Allen Smith (incumbent) | 119,938 | 70.63 | |
Democratic | Leon Mayer | 49,850 | 29.36 | |
No party | Scattering | 16 | 0.01 | |
Total votes | 169,804 | 100.00 | ||
Turnout | {{{votes}}} | |||
Republican hold | ||||
Party | Candidate | Votes | % | ||
---|---|---|---|---|---|
Democratic | Augustus F. Hawkins | 73,465 | 84.54 | ||
Republican | Herman Smith | 13,371 | 15.39 | ||
No party | Scattering | 68 | 0.08 | ||
Total votes | 86,904 | 100.00 | |||
Turnout | {{{votes}}} | ||||
Democratic win (new seat) |
Party | Candidate | Votes | % | |
---|---|---|---|---|
Democratic | James C. Corman (incumbent) | 75,294 | 53.62 | |
Republican | Charles S. Foote | 65,087 | 46.35 | |
No party | Scattering | 33 | 0.02 | |
Total votes | 140,414 | 100.00 | ||
Turnout | {{{votes}}} | |||
Democratic hold | ||||
Party | Candidate | Votes | % | |
---|---|---|---|---|
Democratic | Clyde Doyle (incumbent) | 83,269 | 64.17 | |
Republican | Emmett A. Schwartz | 46,488 | 35.82 | |
No party | Scattering | 12 | 0.01 | |
Total votes | 129,769 | 100.00 | ||
Turnout | {{{votes}}} | |||
Democratic hold | ||||
Party | Candidate | Votes | % | |
---|---|---|---|---|
Republican | Glenard P. Lipscomb (incumbent) | 120,884 | 70.33 | |
Democratic | Knox Mellon | 50,970 | 29.66 | |
No party | Scattering | 19 | 0.01 | |
Total votes | 171,873 | 100.00 | ||
Turnout | {{{votes}}} | |||
Republican hold | ||||
Party | Candidate | Votes | % | |||
---|---|---|---|---|---|---|
Democratic | Ronald B. Cameron | 62,371 | 53.07 | |||
Republican | John H. Rousselot (incumbent) | 53,961 | 45.91 | |||
No party | Scattering | 1,192 | 1.01 | |||
Total votes | 117,524 | 100.00 | ||||
Turnout | {{{votes}}} | |||||
Democratic gain from Republican | ||||||
Party | Candidate | Votes | % | |
---|---|---|---|---|
Democratic | James Roosevelt (incumbent) | 112,162 | 68.29 | |
Republican | Daniel Beltz | 52,063 | 31.70 | |
No party | Scattering | 21 | 0.01 | |
Total votes | 164,246 | 100.00 | ||
Turnout | {{{votes}}} | |||
Democratic hold | ||||
Party | Candidate | Votes | % | |||
---|---|---|---|---|---|---|
Democratic | Everett G. Burkhalter | 66,979 | 52.10 | |||
Republican | Edgar W. Hiestand (incumbent) | 61,538 | 47.86 | |||
No party | Scattering | 49 | 0.04 | |||
Total votes | 128,566 | 100.00 | ||||
Turnout | {{{votes}}} | |||||
Democratic gain from Republican | ||||||
Party | Candidate | Votes | % | |
---|---|---|---|---|
Republican | Alphonzo E. Bell, Jr. (incumbent) | 162,233 | 63.97 | |
Democratic | Jerry Pacht | 91,305 | 36.00 | |
No party | Scattering | 64 | 0.03 | |
Total votes | 253,602 | 100.00 | ||
Turnout | {{{votes}}} | |||
Republican hold | ||||
Party | Candidate | Votes | % | ||
---|---|---|---|---|---|
Democratic | George Brown, Jr. | 73,740 | 55.64 | ||
Republican | H. L. Richardson, Jr. | 58,760 | 44.34 | ||
No party | Scattering | 27 | 0.02 | ||
Total votes | 132,527 | 100.00 | |||
Turnout | {{{votes}}} | ||||
Democratic win (new seat) |
Party | Candidate | Votes | % | |||
---|---|---|---|---|---|---|
Democratic | Edward R. Roybal | 69,008 | 56.50 | |||
Republican | Gordon L. McDonough (incumbent) | 53,104 | 43.48 | |||
No party | Scattering | 16 | 0.01 | |||
Total votes | 122,128 | 100.00 | ||||
Turnout | {{{votes}}} | |||||
Democratic gain from Republican | ||||||
Party | Candidate | Votes | % | ||
---|---|---|---|---|---|
Democratic | Charles H. Wilson | 76,631 | 52.19 | ||
Republican | Gordon Hahn | 70,154 | 47.78 | ||
No party | Scattering | 35 | 0.02 | ||
Total votes | 146,820 | 100.00 | |||
Turnout | {{{votes}}} | ||||
Democratic win (new seat) |
Party | Candidate | Votes | % | |
---|---|---|---|---|
Republican | Craig Hosmer (incumbent) | 115,915 | 70.74 | |
Democratic | J. J. Johovich | 47,917 | 29.24 | |
No party | Scattering | 33 | 0.02 | |
Total votes | 163,865 | 100.00 | ||
Turnout | {{{votes}}} | |||
Republican hold | ||||
Party | Candidate | Votes | % | |
---|---|---|---|---|
Democratic | Harry R. Sheppard (incumbent) | 96,192 | 59.02 | |
Republican | William R. Thomas | 66,764 | 40.97 | |
No party | Scattering | 18 | 0.01 | |
Total votes | 162,974 | 100.00 | ||
Turnout | {{{votes}}} | |||
Democratic hold | ||||
Party | Candidate | Votes | % | ||
---|---|---|---|---|---|
Democratic | Richard T. Hanna | 90,758 | 55.94 | ||
Republican | Robert A. Geier | 71,478 | 44.05 | ||
No party | Scattering | 16 | 0.01 | ||
Total votes | 162,252 | 100.00 | |||
Turnout | {{{votes}}} | ||||
Democratic win (new seat) |
Party | Candidate | Votes | % | |
---|---|---|---|---|
Republican | James B. Utt (incumbent) | 133,737 | 68.52 | |
Democratic | Burton Shamsky | 61,395 | 31.45 | |
No party | Scattering | 54 | 0.03 | |
Total votes | 195,186 | 100.00 | ||
Turnout | {{{votes}}} | |||
Republican hold | ||||
Party | Candidate | Votes | % | |
---|---|---|---|---|
Republican | Bob Wilson (incumbent) | 91,626 | 61.77 | |
Democratic | William C. Godfrey | 56,637 | 38.18 | |
No party | Scattering | 69 | 0.05 | |
Total votes | 148,332 | 100.00 | ||
Turnout | {{{votes}}} | |||
Republican hold | ||||
Party | Candidate | Votes | % | ||
---|---|---|---|---|---|
Democratic | Lionel Van Deerlin | 63,821 | 51.32 | ||
Republican | Dick Wilson | 60,460 | 48.62 | ||
No party | Scattering | 70 | 0.06 | ||
Total votes | 124,351 | 100.00 | |||
Turnout | {{{votes}}} | ||||
Democratic win (new seat) |
Party | Candidate | Votes | % | |||
---|---|---|---|---|---|---|
Republican | Patrick M. Martin | 68,583 | 55.92 | |||
Democratic | Dalip Singh Saund (incumbent) | 54,022 | 44.05 | |||
No party | Scattering | 30 | 0.02 | |||
Total votes | 122,605 | 100.00 | ||||
Turnout | {{{votes}}} | |||||
Republican gain from Democratic | ||||||
The United States House of Representatives elections in California of 1986 was an election for California's delegation to the United States House of Representatives, which occurred as part of the general election of the House of Representatives on November 4, 1986. No districts switched parties, so the delegation remained at 27 Democrats and 18 Republicans.
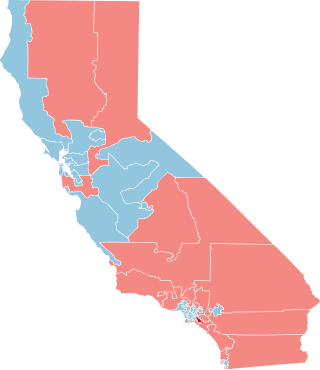
The United States House of Representatives elections in California of 1984 was an election for California's delegation to the United States House of Representatives, which occurred as part of the general election of the House of Representatives on November 6, 1984. Only one incumbent, Democrat Jerry M. Patterson, lost reelection.
The United States House of Representatives elections in California, 1982 was an election for California's delegation to the United States House of Representatives, which occurred as part of the general election of the House of Representatives on November 2, 1982. California gained two seats, both of which were won by Democrats, as a result of the 1980 census, and Democrats picked up three Republican-held districts.
The California United States House elections, 1976 was an election for California's delegation to the United States House of Representatives, which occurred as part of the general election of the House of Representatives on November 2, 1976. Democrats picked up one district, the 16th.
The United States House of Representatives elections in California, 1972 was an election for California's delegation to the United States House of Representatives, which occurred as part of the general election of the House of Representatives on November 7, 1972. California gained 5 seats as a result of the 1970 census, three of which were won by Democrats and two by Republicans. Of California's existing House seats, none switched parties.
The United States House of Representatives elections in California, 1964 was an election for California's delegation to the United States House of Representatives, which occurred as part of the general election of the House of Representatives on November 3, 1964. One Republican-held district and one previously Democratic-held open seat switched parties, resulting in no net change in the balance of 23 Democrats and 15 Republicans.
The United States House of Representatives elections in California, 1960 was an election for California's delegation to the United States House of Representatives, which occurred as part of the general election of the House of Representatives on November 8, 1960. Democrats and Republicans each swapped a seat, leaving the balance at 16 Democrats and 14 Republicans.
The United States House of Representatives elections in California, 1954 was an election for California's delegation to the United States House of Representatives, which occurred as part of the general election of the House of Representatives on November 6, 1954. Democrats gained two seats and lost one seat.
The United States House of Representatives elections in California, 1952 was an election for California's delegation to the United States House of Representatives, which occurred as part of the general election of the House of Representatives on November 4, 1952. California gained seven seats as a result of the 1950 census, five of which were won by Republicans and two by Democrats. Of California's existing districts, Republicans won two Democratic-held seats.
The United States House of Representatives elections in California, 1948 was an election for California's delegation to the United States House of Representatives, which occurred as part of the general election of the House of Representatives on November 2, 1948. Democrats picked up three districts while losing two for a net gain of one seat.
The United States House of Representatives elections in California, 1946 was an election for California's delegation to the United States House of Representatives, which occurred as part of the general election of the House of Representatives on November 5, 1946. Republicans captured control of Congress for the first time since 1928 due to the extreme unpopularity of President Harry Truman. California was indicative of the results as Republicans gained seven seats, one of which was won by a recently returned WWII veteran named Richard Nixon. Democrats would not regain a majority of the delegation until after the 1958 election.
The United States House of Representatives elections in California, 1944 was an election for California's delegation to the United States House of Representatives, which occurred as part of the general election of the House of Representatives on November 7, 1944. Democrats picked up four districts.
The United States House of Representatives elections in California, 1942 was an election for California's delegation to the United States House of Representatives, which occurred as part of the general election of the House of Representatives on November 3, 1942. California gained three districts as a result of the 1940 census, two of which were won by Democrats and one by Republicans. Of California's existing seats, Democrats and Republicans each swapped one district.
The United States House of Representatives elections in California, 1936 was an election for California's delegation to the United States House of Representatives, which occurred as part of the general election of the House of Representatives on November 3, 1936. Democrats gained two Republican-held districts and the Progressive Party gained one Republican-held district.
The United States House of Representatives elections in California, 1934 was an election for California's delegation to the United States House of Representatives, which occurred as part of the general election of the House of Representatives on November 6, 1934. Democrats gained three districts while losing one.
The United States House of Representatives elections in California, 1926 was an election for California's delegation to the United States House of Representatives, which occurred as part of the general election of the House of Representatives on November 2, 1926. Republicans gained one seat in a special election held on August 31, 1926, after incumbent Democrat John E. Raker died.
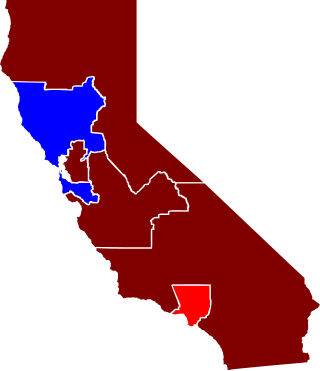
An election was held for California's delegation to the United States House of Representatives as part of the general election of the House of Representatives on November 4, 1902. California gained one seat as a result of the 1900 census, which Republicans won. However, of the existing districts, Democrats won three Republican-held districts.
The United States House of Representatives elections in California, 1880 was an election for California's delegation to the United States House of Representatives, which occurred as part of the general election of the House of Representatives on November 2, 1880. Democrats gained one district.
The United States House of Representatives elections in California, 1879 were elections for California's delegation to the United States House of Representatives, which occurred on September 3, 1879. California's delegation remained unchanged, at three Republicans and one Democrat.
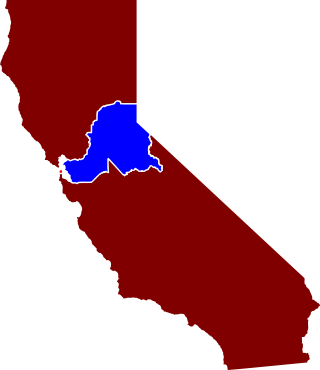
The United States House of Representatives elections in California, 1872 was an election for California's delegation to the United States House of Representatives, which occurred as part of the general election of the House of Representatives on November 5, 1872. California gained one seat as a result of the 1870 census, which the Republicans won. The Democrats, however, gained a Republican-held district.