| Elections in California |
|---|
 |
Special elections to the California State Senate are called by the Governor of California when a vacancy arises within the State Senate. Special elections are conducted in two rounds. The first round is an open primary. The second round is cancelled if one of the candidates receives more than 50% of the vote in the first round. Prior to 2012, the top vote getter from each party in the first round would advance to the second round. Since the passage of Proposition 14 in 2010 (which became effective 2012), the top two vote getters in the first round, regardless of party, advance to the second round.
Contents
- List of special elections
- List of recall elections
- Results
- 2006 35th State Senate district special election
- 2008 12th State Senate district recall election
- 2009 26th State Senate district special election
- 2010 37th State Senate district special election
- 2010 15th State Senate district special election
- 2011 17th district special election
- 2011 28th district special election
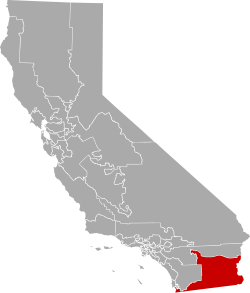
- 2013 4th district special election
- 2013 40th district special election
- 2013 32nd district special election
- 2013 16th district special election
- 2013 26th district special election
- 2014 23rd district special election
- 2014 35th district special election
- 2015 7th district special election
- 2015 21st district special election
- 2015 37th district special election
- 2018 29th district special recall election
- 2018 32nd district special election
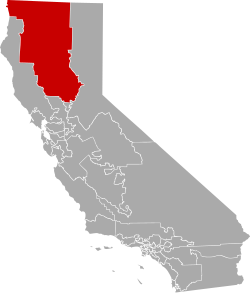
- 2019 1st district special election
- 2019 33rd district special election
- 2020 28th district special election
- 2021 30th district special election
- 2025 36th district special election
- Notes
- References
Recall elections, the process by which voters petition for the removal of an elected official, are also included.