Elections in California |
---|
The United States House of Representatives elections in California, 1966 was an election for California's delegation to the United States House of Representatives, which occurred as part of the general election of the House of Representatives on November 8, 1966. Republicans gained three seats from the Democrats. There was a mid-decade redistricting of the California districts in 1966.
United States House of Representatives elections in California, 1966 | ||||||
---|---|---|---|---|---|---|
Party | Votes | % | Before | After | +/– | |
Republican | 3,336,943 | 53.15% | 13 | 16 | +3 | |
Democratic | 2,937,862 | 46.79% | 25 | 22 | -3 | |
Scattering | 3,796 | 0.06% | 0 | 0 | 0 | |
Totals | 6,278,601 | 100.00% | 38 | 38 | — |
Final results from the Clerk of the House of Representatives:
District 1 • District 2 • District 3 • District 4 • District 5 • District 6 • District 7 • District 8 • District 9 • District 10 • District 11 • District 12 • District 13 • District 14 |
Party | Candidate | Votes | % | |
---|---|---|---|---|
Republican | Don H. Clausen (incumbent) | 143,755 | 64.86 | |
Democratic | Thomas T. Storer | 77,000 | 34.74 | |
No party | Scattering | 888 | 0.40 | |
Total votes | 221,643 | 100.00 | ||
Turnout | ||||
Republican hold | ||||
Party | Candidate | Votes | % | |
---|---|---|---|---|
Democratic | Harold T. Johnson (incumbent) | 131,145 | 70.91 | |
Republican | William H. Romack, Jr. | 53,753 | 29.06 | |
No party | Scattering | 54 | 0.03 | |
Total votes | 184,952 | 100.00 | ||
Turnout | ||||
Democratic hold | ||||
Party | Candidate | Votes | % | |
---|---|---|---|---|
Democratic | John E. Moss (incumbent) | 143,177 | 67.46 | |
Republican | Terry G. Feil | 69,057 | 32.54 | |
No party | Scattering | 17 | 0.01 | |
Total votes | 212,251 | 100.00 | ||
Turnout | ||||
Democratic hold | ||||
Party | Candidate | Votes | % | |
---|---|---|---|---|
Democratic | Robert L. Leggett (incumbent) | 67,942 | 59.45 | |
Republican | Tom McHatton | 46,337 | 40.54 | |
No party | Scattering | 7 | 0.01 | |
Total votes | 114,286 | 100.00 | ||
Turnout | ||||
Democratic hold | ||||
Party | Candidate | Votes | % | |
---|---|---|---|---|
Democratic | Phillip Burton (incumbent) | 56,476 | 71.26 | |
Republican | Terry R. Macken | 22,778 | 28.74 | |
No party | Scattering | 0 | 0.00 | |
Total votes | 79,254 | 100.00 | ||
Turnout | ||||
Democratic hold | ||||
Party | Candidate | Votes | % | |
---|---|---|---|---|
Republican | William S. Mailliard (incumbent) | 132,506 | 76.58 | |
Democratic | Le Rue Grim | 40,514 | 23.42 | |
No party | Scattering | 0 | 0.00 | |
Total votes | 173,020 | 100.00 | ||
Turnout | ||||
Democratic hold | ||||
Party | Candidate | Votes | % | |
---|---|---|---|---|
Democratic | Jeffery Cohelan (incumbent) | 84,644 | 63.89 | |
Republican | Malcolm M. Champlin | 46,763 | 35.30 | |
No party | Scattering | 1,077 | 0.81 | |
Total votes | 132,484 | 100.00 | ||
Turnout | ||||
Democratic hold | ||||
Party | Candidate | Votes | % | |
---|---|---|---|---|
Democratic | George P. Miller (incumbent) | 92,263 | 65.43 | |
Republican | Raymond P. Britton | 48,727 | 34.55 | |
No party | Scattering | 24 | 0.02 | |
Total votes | 141,014 | 100.00 | ||
Turnout | ||||
Democratic hold | ||||
Party | Candidate | Votes | % | |
---|---|---|---|---|
Democratic | Don Edwards (incumbent) | 97,311 | 63.14 | |
Republican | Wilbur G. Durkee | 56,784 | 36.85 | |
No party | Scattering | 15 | 0.01 | |
Total votes | 154,110 | 100.00 | ||
Turnout | ||||
Democratic hold | ||||
Party | Candidate | Votes | % | |
---|---|---|---|---|
Republican | Charles S. Gubser (incumbent) | 156,549 | 69.09 | |
Democratic | George Leppert | 70,013 | 30.90 | |
No party | Scattering | 10 | 0.00 | |
Total votes | 226,572 | 100.00 | ||
Turnout | ||||
Republican hold | ||||
Party | Candidate | Votes | % | |
---|---|---|---|---|
Republican | J. Arthur Younger (incumbent) | 113,679 | 59.40 | |
Democratic | W. Mark Sullivan | 77,605 | 40.55 | |
No party | Scattering | 88 | 0.05 | |
Total votes | 191,372 | 100.00 | ||
Turnout | ||||
Republican hold | ||||
Party | Candidate | Votes | % | |
---|---|---|---|---|
Republican | Burt L. Talcott (incumbent) | 108,070 | 77.24 | |
Democratic | Gerald V. Barron | 31,787 | 22.72 | |
No party | Scattering | 52 | 0.04 | |
Total votes | 139,909 | 100.00 | ||
Turnout | ||||
Republican hold | ||||
Party | Candidate | Votes | % | |
---|---|---|---|---|
Republican | Charles M. Teague (incumbent) | 116,701 | 67.45 | |
Democratic | Charles A. Storke | 56,240 | 32.51 | |
No party | Scattering | 69 | 0.04 | |
Total votes | 173,010 | 100.00 | ||
Turnout | ||||
Republican hold | ||||
Party | Candidate | Votes | % | |
---|---|---|---|---|
Democratic | Jerome Waldie (incumbent) | 108,668 | 56.38 | |
Republican | Frank J. Newman | 83,878 | 43.52 | |
No party | Scattering | 206 | 0.11 | |
Total votes | 192,752 | 100.00 | ||
Turnout | ||||
Democratic hold | ||||
Party | Candidate | Votes | % | |
---|---|---|---|---|
Democratic | John J. McFall (incumbent) | 81,733 | 57.04 | |
Republican | Sam Van Dyken | 61,550 | 42.96 | |
No party | Scattering | 5 | 0.00 | |
Total votes | 143,288 | 100.00 | ||
Turnout | ||||
Democratic hold | ||||
Party | Candidate | Votes | % | |
---|---|---|---|---|
Democratic | Bernice F. Sisk (incumbent) | 118,063 | 71.30 | |
Republican | Cecil F. White | 47,329 | 28.58 | |
No party | Scattering | 187 | 0.11 | |
Total votes | 165,579 | 100.00 | ||
Turnout | ||||
Democratic hold | ||||
Party | Candidate | Votes | % | |
---|---|---|---|---|
Democratic | Cecil R. King (incumbent) | 76,962 | 60.80 | |
Republican | Don Cortum | 49,615 | 39.20 | |
No party | Scattering | 7 | 0.01 | |
Total votes | 126,584 | 100.00 | ||
Turnout | ||||
Democratic hold | ||||
Party | Candidate | Votes | % | |||
---|---|---|---|---|---|---|
Republican | Bob Mathias | 96,699 | 55.88 | |||
Democratic | Harlan Hagen (incumbent) | 76,346 | 44.12 | |||
No party | Scattering | 13 | 0.01 | |||
Total votes | 173,058 | 100.00 | ||||
Turnout | ||||||
Republican gain from Democratic | ||||||
Party | Candidate | Votes | % | |
---|---|---|---|---|
Democratic | Chet Holifield (incumbent) | 82,592 | 62.24 | |
Republican | William R. Sutton | 50,068 | 37.73 | |
No party | Scattering | 46 | 0.03 | |
Total votes | 132,706 | 100.00 | ||
Turnout | ||||
Democratic hold | ||||
Party | Candidate | Votes | % | |
---|---|---|---|---|
Republican | H. Allen Smith (incumbent) | 128,896 | 73.37 | |
Democratic | Raymond Freschi | 46,730 | 26.60 | |
No party | Scattering | 63 | 0.04 | |
Total votes | 175,689 | 100.00 | ||
Turnout | ||||
Republican hold | ||||
Party | Candidate | Votes | % | |
---|---|---|---|---|
Democratic | Augustus F. Hawkins (incumbent) | 74,216 | 84.80 | |
Republican | Rayfield Lundy | 13,294 | 15.19 | |
No party | Scattering | 12 | 0.01 | |
Total votes | 87,522 | 100.00 | ||
Turnout | ||||
Democratic hold | ||||
Party | Candidate | Votes | % | |
---|---|---|---|---|
Democratic | James C. Corman (incumbent) | 94,420 | 53.45 | |
Republican | Robert C. Cline | 82,207 | 46.54 | |
No party | Scattering | 29 | 0.02 | |
Total votes | 176,656 | 100.00 | ||
Turnout | ||||
Democratic hold | ||||
Party | Candidate | Votes | % | |
---|---|---|---|---|
Republican | Del M. Clawson (incumbent) | 93,320 | 67.39 | |
Democratic | Ed O'Connor | 45,141 | 32.60 | |
No party | Scattering | 13 | 0.01 | |
Total votes | 138,474 | 100.00 | ||
Turnout | ||||
Republican hold | ||||
Party | Candidate | Votes | % | |
---|---|---|---|---|
Republican | Glenard P. Lipscomb (incumbent) | 148,190 | 76.21 | |
Democratic | Earl G. McNall | 46,115 | 23.72 | |
No party | Scattering | 141 | 0.07 | |
Total votes | 194,446 | 100.00 | ||
Turnout | ||||
Republican hold | ||||
Party | Candidate | Votes | % | |||
---|---|---|---|---|---|---|
Republican | Charles E. Wiggins | 70,154 | 52.55 | |||
Democratic | Ronald B. Cameron (incumbent) | 63,345 | 47.45 | |||
No party | Scattering | 13 | 0.01 | |||
Total votes | 133,512 | 100.00 | ||||
Turnout | ||||||
Republican gain from Democratic | ||||||
Party | Candidate | Votes | % | |
---|---|---|---|---|
Democratic | Thomas M. Rees (incumbent) | 103,289 | 62.32 | |
Republican | Irving Teichner | 62,441 | 37.67 | |
No party | Scattering | 20 | 0.01 | |
Total votes | 165,750 | 100.00 | ||
Turnout | ||||
Democratic hold | ||||
Party | Candidate | Votes | % | |
---|---|---|---|---|
Republican | Edwin Reinecke (incumbent) | 93,890 | 65.33 | |
Democratic | John A. "Jack" Howard | 49,785 | 34.64 | |
No party | Scattering | 42 | 0.03 | |
Total votes | 143,717 | 100.00 | ||
Turnout | ||||
Republican hold | ||||
Party | Candidate | Votes | % | |
---|---|---|---|---|
Republican | Alphonzo E. Bell, Jr. (incumbent) | 211,404 | 72.28 | |
Democratic | Lawrence "Lorry" Sherman | 81,007 | 27.70 | |
No party | Scattering | 80 | 0.03 | |
Total votes | 292,491 | 100.00 | ||
Turnout | ||||
Republican hold | ||||
Party | Candidate | Votes | % | |
---|---|---|---|---|
Democratic | George Brown, Jr. (incumbent) | 69,115 | 51.12 | |
Republican | Bill Orozco | 66,079 | 48.87 | |
No party | Scattering | 8 | 0.01 | |
Total votes | 135,202 | 100.00 | ||
Turnout | ||||
Democratic hold | ||||
Party | Candidate | Votes | % | |
---|---|---|---|---|
Democratic | Edward R. Roybal (incumbent) | 72,173 | 66.40 | |
Republican | Henri O'Bryant, Jr. | 36,506 | 33.58 | |
No party | Scattering | 20 | 0.02 | |
Total votes | 108,699 | 100.00 | ||
Turnout | ||||
Democratic hold | ||||
Party | Candidate | Votes | % | |
---|---|---|---|---|
Democratic | Charles H. Wilson (incumbent) | 92,875 | 63.35 | |
Republican | Theodore Smith | 53,708 | 36.63 | |
No party | Scattering | 22 | 0.02 | |
Total votes | 146,605 | 100.00 | ||
Turnout | ||||
Democratic hold | ||||
Party | Candidate | Votes | % | |
---|---|---|---|---|
Republican | Craig Hosmer (incumbent) | 139,328 | 80.09 | |
Democratic | Tracy Odell | 34,609 | 19.90 | |
No party | Scattering | 17 | 0.01 | |
Total votes | 173,954 | 100.00 | ||
Turnout | ||||
Republican hold | ||||
Party | Candidate | Votes | % | |||
---|---|---|---|---|---|---|
Republican | Jerry Pettis | 102,401 | 53.48 | |||
Democratic | Kenneth W. Dyal (incumbent) | 89,071 | 46.52 | |||
No party | Scattering | 8 | 0.00 | |||
Total votes | 191,480 | 100.00 | ||||
Turnout | ||||||
Republican gain from Democratic | ||||||
Party | Candidate | Votes | % | |
---|---|---|---|---|
Democratic | Richard T. Hanna (incumbent) | 127,976 | 55.79 | |
Republican | Frank LaMagna | 101,410 | 44.21 | |
No party | Scattering | 5 | 0.00 | |
Total votes | 129,391 | 100.00 | ||
Turnout | ||||
Democratic hold | ||||
Party | Candidate | Votes | % | |
---|---|---|---|---|
Republican | James B. Utt (incumbent) | 189,582 | 73.06 | |
Democratic | Thomas B. Lenhart | 69,873 | 26.93 | |
No party | Scattering | 21 | 0.01 | |
Total votes | 259,476 | 100.00 | ||
Turnout | ||||
Republican hold | ||||
Party | Candidate | Votes | % | |
---|---|---|---|---|
Republican | Bob Wilson (incumbent) | 119,274 | 72.74 | |
Democratic | Don Lindgren | 44,365 | 27.06 | |
No party | Scattering | 340 | 0.21 | |
Total votes | 163,979 | 100.00 | ||
Turnout | ||||
Republican hold | ||||
Party | Candidate | Votes | % | |
---|---|---|---|---|
Democratic | Lionel Van Deerlin (incumbent) | 80,060 | 61.14 | |
Republican | Samuel S. Vener | 50,817 | 38.81 | |
No party | Scattering | 63 | 0.05 | |
Total votes | 130,940 | 100.00 | ||
Turnout | ||||
Democratic hold | ||||
Party | Candidate | Votes | % | |
---|---|---|---|---|
Democratic | John V. Tunney (incumbent) | 83,216 | 54.47 | |
Republican | Robert R. Barry | 69,444 | 45.46 | |
No party | Scattering | 114 | 0.07 | |
Total votes | 152,774 | 100.00 | ||
Turnout | ||||
Democratic hold | ||||
The United States House of Representatives elections in California, 1988 was an election for California's delegation to the United States House of Representatives, which occurred as part of the general election of the House of Representatives on November 8, 1988. No districts switched parties, so the delegation remained at 27 Democrats and 18 Republicans.
The United States House of Representatives elections in California of 1986 was an election for California's delegation to the United States House of Representatives, which occurred as part of the general election of the House of Representatives on November 4, 1986. No districts switched parties, so the delegation remained at 27 Democrats and 18 Republicans.
The United States House of Representatives elections in California of 1984 was an election for California's delegation to the United States House of Representatives, which occurred as part of the general election of the House of Representatives on November 6, 1984. Only one incumbent, Democrat Jerry M. Patterson, lost reelection.
The United States House of Representatives elections in California, 1980 was an election for California's delegation to the United States House of Representatives, which occurred as part of the general election of the House of Representatives on November 4, 1980. Republicans lost one seat but gained four Democratic-held seats.
The United States House of Representatives elections in California, 1978 was an election for California's delegation to the United States House of Representatives, which occurred as part of the general election of the House of Representatives on November 7, 1978. Republicans knocked off three Democratic incumbents.
The California United States House elections, 1976 was an election for California's delegation to the United States House of Representatives, which occurred as part of the general election of the House of Representatives on November 2, 1976. Democrats picked up one district, the 16th.
The United States House of Representatives elections in California, 1974 was an election for California's delegation to the United States House of Representatives, which occurred as part of the general election of the House of Representatives on November 4, 1974. Democrats picked up five Republican-held districts.
The United States House of Representatives elections in California, 1972 was an election for California's delegation to the United States House of Representatives, which occurred as part of the general election of the House of Representatives on November 7, 1972. California gained 5 seats as a result of the 1970 Census, three of which were won by Democrats and two by Republicans. Of California's existing House seats, none switched parties.
The United States House of Representatives elections in California, 1962 was an election for California's delegation to the United States House of Representatives, which occurred as part of the general election of the House of Representatives on November 6, 1962. California gained eight districts as a result of the 1960 Census, seven of which were won by Democrats and one by a Republican. Of California's existing districts, Democrats picked up three and lost one.
The California United States House of Representatives elections in California, 1956 was an election for California's delegation to the United States House of Representatives, which occurred as part of the general election of the House of Representatives on November 6, 1956. Democrats gained two seats from the Republicans. As of 2018, this is the last time that Republicans won a majority of congressional districts in California.
The United States House of Representatives elections in California, 1944 was an election for California's delegation to the United States House of Representatives, which occurred as part of the general election of the House of Representatives on November 7, 1944. Democrats picked up four districts.
The United States House of Representatives elections in California, 1940 was an election for California's delegation to the United States House of Representatives, which occurred as part of the general election of the House of Representatives on November 5, 1940. Republicans gained two districts.
The United States House of Representatives elections in California, 1938 was an election for California's delegation to the United States House of Representatives, which occurred as part of the general election of the House of Representatives on November 8, 1938. Republicans gained four districts. Franck R. Havenner, first elected to Congress as a Progressive, was elected for the rest of his House career as a Democrat.
The United States House of Representatives elections in California, 1936 was an election for California's delegation to the United States House of Representatives, which occurred as part of the general election of the House of Representatives on November 3, 1936. Democrats gained two Republican-held districts and the Progressive Party gained one Republican-held district.
The United States House of Representatives elections in California, 1934 was an election for California's delegation to the United States House of Representatives, which occurred as part of the general election of the House of Representatives on November 6, 1934. Democrats gained three districts while losing one.
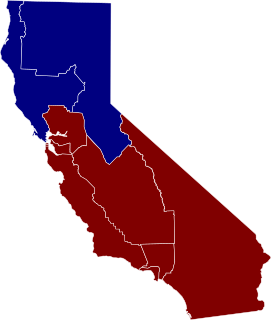
The United States House of Representatives elections in California, 1922 was an election for California's delegation to the United States House of Representatives, which occurred as part of the general election of the House of Representatives on November 7, 1922. The districts were not reapportioned after the 1920 Census, so the state's delegation remained at 11 representatives, and the partisan makeup remained unchanged, at 9 Republicans and 2 Democrats.
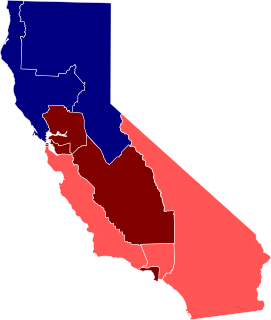
The United States House of Representatives elections in California, 1920 was an election for California's delegation to the United States House of Representatives, which occurred as part of the general election of the House of Representatives on November 2, 1920. Republicans picked up two Democratic-held districts and defeated the lone Prohibition Party incumbent.
The United States House of Representatives elections in California, 1880 was an election for California's delegation to the United States House of Representatives, which occurred as part of the general election of the House of Representatives on November 2, 1880. Democrats gained one district.
The United States House of Representatives elections in California, 1876 was an election for California's delegation to the United States House of Representatives, which occurred as part of the general election of the House of Representatives on November 7, 1876. Republicans gained two districts.
The United States House of Representatives elections in California, 1871 were elections for California's delegation to the United States House of Representatives, which occurred on September 6, 1871. Republicans gained both Democratic districts.