![]() | |||||||||||||||||
| |||||||||||||||||
| |||||||||||||||||
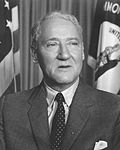
![]() County results Cooper: 50-60% 60-70% 70-80% 80–90% Brown: 50–60% 60–70% | |||||||||||||||||
|
Elections in Kentucky |
---|
![]() |
![]() |
The 1966 United States Senate election in Kentucky took place on November 8, 1966. Incumbent Republican Senator John Sherman Cooper was elected to a second consecutive term in office, [lower-alpha 1] defeating Democrat John Y. Brown Sr. in a rematch of the 1946 special election.
Party | Candidate | Votes | % | |
---|---|---|---|---|
Republican | John Sherman Cooper (incumbent) | 65,023 | 92.80% | |
Republican | Sam M. Ward | 2,927 | 4.18% | |
Republican | W. Howard Clay | 2,120 | 3.03% | |
Total votes | 70,070 | 100.00% |
Party | Candidate | Votes | % | |
---|---|---|---|---|
Democratic | John Y. Brown Sr. | 71,759 | 75.58% | |
Democratic | Gaines P. Wilson | 12,921 | 13.61% | |
Democratic | James Ward Lentz | 5,339 | 5.69% | |
Democratic | Jesse N.R. Cecil | 4,861 | 5.12% | |
Total votes | 94,940 | 100.00% |
Party | Candidate | Votes | % | |
---|---|---|---|---|
Republican | John Sherman Cooper (incumbent) | 483,805 | 64.52% | |
Democratic | John Y. Brown Sr. | 266,079 | 35.48% | |
Total votes | 749,884 | 100.00% |
County | John Sherman Cooper Republican | John Young Brown, Sr. Democratic | Margin | Total votes cast [4] | |||
---|---|---|---|---|---|---|---|
# | % | # | % | # | % | ||
Adair | 3,003 | 70.21% | 1,274 | 29.79% | 1,729 | 40.43% | 4,277 |
Allen | 2,094 | 70.51% | 876 | 29.49% | 1,218 | 41.01% | 2,970 |
Anderson | 1,799 | 60.27% | 1,186 | 39.73% | 613 | 20.54% | 2,985 |
Ballard | 1,347 | 54.73% | 1,114 | 45.27% | 233 | 9.47% | 2,461 |
Barren | 4,194 | 61.24% | 2,655 | 38.76% | 1,539 | 22.47% | 6,849 |
Bath | 1,591 | 55.92% | 1,254 | 44.08% | 337 | 11.85% | 2,845 |
Bell | 4,240 | 61.28% | 2,679 | 38.72% | 1,561 | 22.56% | 6,919 |
Boone | 3,692 | 63.57% | 2,116 | 36.43% | 1,576 | 27.13% | 5,808 |
Bourbon | 2,051 | 60.01% | 1,367 | 39.99% | 684 | 20.01% | 3,418 |
Boyd | 8,462 | 62.95% | 4,980 | 37.05% | 3,482 | 25.90% | 13,442 |
Boyle | 3,368 | 67.16% | 1,647 | 32.84% | 1,721 | 34.32% | 5,015 |
Bracken | 1,190 | 64.46% | 656 | 35.54% | 534 | 28.93% | 1,846 |
Breathitt | 1,195 | 34.43% | 2,276 | 65.57% | -1,081 | -31.14% | 3,471 |
Breckinridge | 2,847 | 60.65% | 1,847 | 39.35% | 1,000 | 21.30% | 4,694 |
Bullitt | 2,399 | 56.98% | 1,811 | 43.02% | 588 | 13.97% | 4,210 |
Butler | 2,513 | 81.70% | 563 | 18.30% | 1,950 | 63.39% | 3,076 |
Caldwell | 2,752 | 69.85% | 1,188 | 30.15% | 1,564 | 39.70% | 3,940 |
Calloway | 3,244 | 63.68% | 1,850 | 36.32% | 1,394 | 27.37% | 5,094 |
Campbell | 12,128 | 64.02% | 6,817 | 35.98% | 5,311 | 28.03% | 18,945 |
Carlisle | 1,417 | 61.08% | 903 | 38.92% | 514 | 22.16% | 2,320 |
Carroll | 940 | 47.36% | 1,045 | 52.64% | -105 | -5.29% | 1,985 |
Carter | 3,234 | 66.65% | 1,618 | 33.35% | 1,616 | 33.31% | 4,852 |
Casey | 3,299 | 80.48% | 800 | 19.52% | 2,499 | 60.97% | 4,099 |
Christian | 4,394 | 58.96% | 3,058 | 41.04% | 1,336 | 17.93% | 7,452 |
Clark | 2,850 | 62.97% | 1,676 | 37.03% | 1,174 | 25.94% | 4,526 |
Clay | 2,802 | 76.68% | 852 | 23.32% | 1,950 | 53.37% | 3,654 |
Clinton | 2,150 | 84.41% | 397 | 15.59% | 1,753 | 68.83% | 2,547 |
Crittenden | 1,825 | 70.30% | 771 | 29.70% | 1,054 | 40.60% | 2,596 |
Cumberland | 1,698 | 80.13% | 421 | 19.87% | 1,277 | 60.26% | 2,119 |
Daviess | 10,152 | 59.62% | 6,877 | 40.38% | 3,275 | 19.23% | 17,029 |
Edmonson | 1,878 | 75.48% | 610 | 24.52% | 1,268 | 50.96% | 2,488 |
Elliott | 846 | 53.85% | 725 | 46.15% | 121 | 7.70% | 1,571 |
Estill | 2,201 | 67.66% | 1,052 | 32.34% | 1,149 | 35.32% | 3,253 |
Fayette | 22,374 | 66.27% | 11,390 | 33.73% | 10,984 | 32.53% | 33,764 |
Fleming | 1,892 | 63.81% | 1,073 | 36.19% | 819 | 27.62% | 2,965 |
Floyd | 4,890 | 55.98% | 3,846 | 44.02% | 1,044 | 11.95% | 8,736 |
Franklin | 5,002 | 47.91% | 5,439 | 52.09% | -437 | -4.19% | 10,441 |
Fulton | 1,406 | 65.49% | 741 | 34.51% | 665 | 30.97% | 2,147 |
Gallatin | 529 | 51.01% | 508 | 48.99% | 21 | 2.03% | 1,037 |
Garrard | 2,210 | 67.92% | 1,044 | 32.08% | 1,166 | 35.83% | 3,254 |
Grant | 1,476 | 61.89% | 909 | 38.11% | 567 | 23.77% | 2,385 |
Graves | 5,231 | 61.82% | 3,230 | 38.18% | 2,001 | 23.65% | 8,461 |
Grayson | 3,642 | 72.94% | 1,351 | 27.06% | 2,291 | 45.88% | 4,993 |
Green | 2,099 | 67.06% | 1,031 | 32.94% | 1,068 | 34.12% | 3,130 |
Greenup | 4,676 | 61.02% | 2,987 | 38.98% | 1,689 | 22.04% | 7,663 |
Hancock | 980 | 64.64% | 536 | 35.36% | 444 | 29.29% | 1,516 |
Hardin | 5,876 | 64.69% | 3,207 | 35.31% | 2,669 | 29.38% | 9,083 |
Harlan | 6,056 | 69.26% | 2,688 | 30.74% | 3,368 | 38.52% | 8,744 |
Harrison | 1,905 | 55.56% | 1,524 | 44.44% | 381 | 11.11% | 3,429 |
Hart | 2,730 | 65.93% | 1,411 | 34.07% | 1,319 | 31.85% | 4,141 |
Henderson | 3,523 | 54.85% | 2,900 | 45.15% | 623 | 9.70% | 6,423 |
Henry | 1,625 | 52.30% | 1,482 | 47.70% | 143 | 4.60% | 3,107 |
Hickman | 1,298 | 69.30% | 575 | 30.70% | 723 | 38.60% | 1,873 |
Hopkins | 4,534 | 56.85% | 3,442 | 43.15% | 1,092 | 13.69% | 7,976 |
Jackson | 2,549 | 87.53% | 363 | 12.47% | 2,186 | 75.07% | 2,912 |
Jefferson | 113,648 | 66.48% | 57,312 | 33.52% | 56,336 | 32.95% | 170,960 |
Jessamine | 2,379 | 68.76% | 1,081 | 31.24% | 1,298 | 37.51% | 3,460 |
Johnson | 3,623 | 73.80% | 1,286 | 26.20% | 2,337 | 47.61% | 4,909 |
Kenton | 16,115 | 67.84% | 7,638 | 32.16% | 8,477 | 35.69% | 23,753 |
Knott | 1,474 | 43.49% | 1,915 | 56.51% | -441 | -13.01% | 3,389 |
Knox | 3,884 | 74.35% | 1,340 | 25.65% | 2,544 | 48.70% | 5,224 |
Larue | 2,052 | 69.16% | 915 | 30.84% | 1,137 | 38.32% | 2,967 |
Laurel | 4,988 | 78.54% | 1,363 | 21.46% | 3,625 | 57.08% | 6,351 |
Lawrence | 1,961 | 61.94% | 1,205 | 38.06% | 756 | 23.88% | 3,166 |
Lee | 1,449 | 68.71% | 660 | 31.29% | 789 | 37.41% | 2,109 |
Leslie | 2,049 | 82.39% | 438 | 17.61% | 1,611 | 64.78% | 2,487 |
Letcher | 3,528 | 65.88% | 1,827 | 34.12% | 1,701 | 31.76% | 5,355 |
Lewis | 2,327 | 75.65% | 749 | 24.35% | 1,578 | 51.30% | 3,076 |
Lincoln | 2,916 | 66.00% | 1,502 | 34.00% | 1,414 | 32.01% | 4,418 |
Livingston | 1,483 | 64.06% | 832 | 35.94% | 651 | 28.12% | 2,315 |
Logan | 2,638 | 46.54% | 3,030 | 53.46% | -392 | -6.92% | 5,668 |
Lyon | 977 | 62.91% | 576 | 37.09% | 401 | 25.82% | 1,553 |
Madison | 5,329 | 61.77% | 3,298 | 38.23% | 2,031 | 23.54% | 8,627 |
Magoffin | 1,605 | 59.69% | 1,084 | 40.31% | 521 | 19.38% | 2,689 |
Marion | 1,927 | 55.82% | 1,525 | 44.18% | 402 | 11.65% | 3,452 |
Marshall | 3,465 | 64.75% | 1,886 | 35.25% | 1,579 | 29.51% | 5,351 |
Martin | 1,446 | 76.11% | 454 | 23.89% | 992 | 52.21% | 1,900 |
Mason | 2,812 | 66.23% | 1,434 | 33.77% | 1,378 | 32.45% | 4,246 |
McCracken | 9,039 | 66.21% | 4,612 | 33.79% | 4,427 | 32.43% | 13,651 |
McCreary | 2,460 | 86.86% | 372 | 13.14% | 2,088 | 73.73% | 2,832 |
McLean | 1,478 | 55.61% | 1,180 | 44.39% | 298 | 11.21% | 2,658 |
Meade | 1,823 | 57.85% | 1,328 | 42.15% | 495 | 15.71% | 3,151 |
Menifee | 710 | 57.68% | 521 | 42.32% | 189 | 15.35% | 1,231 |
Mercer | 2,695 | 60.93% | 1,728 | 39.07% | 967 | 21.86% | 4,423 |
Metcalfe | 1,636 | 62.92% | 964 | 37.08% | 672 | 25.85% | 2,600 |
Monroe | 3,171 | 80.73% | 757 | 19.27% | 2,414 | 61.46% | 3,928 |
Montgomery | 2,053 | 65.72% | 1,071 | 34.28% | 982 | 31.43% | 3,124 |
Morgan | 1,254 | 50.38% | 1,235 | 49.62% | 19 | 0.76% | 2,489 |
Muhlenberg | 4,016 | 56.19% | 3,131 | 43.81% | 885 | 12.38% | 7,147 |
Nelson | 3,280 | 61.93% | 2,016 | 38.07% | 1,264 | 23.87% | 5,296 |
Nicholas | 886 | 61.49% | 555 | 38.51% | 331 | 22.97% | 1,441 |
Ohio | 3,279 | 68.10% | 1,536 | 31.90% | 1,743 | 36.20% | 4,815 |
Oldham | 1,727 | 60.68% | 1,119 | 39.32% | 608 | 21.36% | 2,846 |
Owen | 1,042 | 44.10% | 1,321 | 55.90% | -279 | -11.81% | 2,363 |
Owsley | 980 | 81.46% | 223 | 18.54% | 757 | 62.93% | 1,203 |
Pendleton | 1,548 | 58.28% | 1,108 | 41.72% | 440 | 16.57% | 2,656 |
Perry | 4,303 | 65.31% | 2,286 | 34.69% | 2,017 | 30.61% | 6,589 |
Pike | 8,495 | 52.96% | 7,544 | 47.04% | 951 | 5.93% | 16,039 |
Powell | 1,277 | 61.04% | 815 | 38.96% | 462 | 22.08% | 2,092 |
Pulaski | 8,364 | 80.91% | 1,973 | 19.09% | 6,391 | 61.83% | 10,337 |
Robertson | 394 | 65.89% | 204 | 34.11% | 190 | 31.77% | 598 |
Rockcastle | 2,841 | 75.80% | 907 | 24.20% | 1,934 | 51.60% | 3,748 |
Rowan | 2,054 | 64.41% | 1,135 | 35.59% | 919 | 28.82% | 3,189 |
Russell | 2,592 | 79.98% | 649 | 20.02% | 1,943 | 59.95% | 3,241 |
Scott | 1,932 | 55.84% | 1,528 | 44.16% | 404 | 11.68% | 3,460 |
Shelby | 2,504 | 56.63% | 1,918 | 43.37% | 586 | 13.25% | 4,422 |
Simpson | 1,419 | 61.64% | 883 | 38.36% | 536 | 23.28% | 2,302 |
Spencer | 849 | 60.08% | 564 | 39.92% | 285 | 20.17% | 1,413 |
Taylor | 2,563 | 69.74% | 1,112 | 30.26% | 1,451 | 39.48% | 3,675 |
Todd | 1,514 | 60.01% | 1,009 | 39.99% | 505 | 20.02% | 2,523 |
Trigg | 1,412 | 57.21% | 1,056 | 42.79% | 356 | 14.42% | 2,468 |
Trimble | 683 | 43.75% | 878 | 56.25% | -195 | -12.49% | 1,561 |
Union | 1,788 | 51.86% | 1,660 | 48.14% | 128 | 3.71% | 3,448 |
Warren | 6,570 | 62.99% | 3,861 | 37.01% | 2,709 | 25.97% | 10,431 |
Washington | 1,930 | 63.34% | 1,117 | 36.66% | 813 | 26.68% | 3,047 |
Wayne | 2,642 | 66.13% | 1,353 | 33.87% | 1,289 | 32.27% | 3,995 |
Webster | 1,801 | 53.46% | 1,568 | 46.54% | 233 | 6.92% | 3,369 |
Whitley | 5,023 | 77.68% | 1,443 | 22.32% | 3,580 | 55.37% | 6,466 |
Wolfe | 1,100 | 65.13% | 589 | 34.87% | 511 | 30.25% | 1,689 |
Woodford | 2,305 | 64.62% | 1,262 | 35.38% | 1,043 | 29.24% | 3,567 |
Totals | 483,805 | 64.52% | 266,079 | 35.48% | 217,726 | 29.03% | 749,884 |
The 1990 United States Senate elections were held on Tuesday, November 6, 1990, with the 33 seats of Class 2 contested in regular elections. Special elections were also held to fill vacancies. The Democratic Party increased its majority with a net gain of one seat from the Republican Party. The election took place in the middle of President George H. W. Bush's term, and, as with most other midterm elections, the party not holding the presidency gained seats in Congress.
The 1984 United States Senate elections were held on November 6, with the 33 seats of Class 2 contested in regular elections. They coincided with the landslide re-election of President Ronald Reagan in the presidential election. In spite of the lopsided presidential race, Reagan's Republican Party suffered a net loss of two Senate seats to the Democrats, although it retained control of the Senate with a reduced 53-47 majority. Democrats defeated incumbents in Illinois and Iowa, and won an open seat in Tennessee, while Republicans defeated an incumbent in Kentucky.
The 1972 United States Senate elections were held on November 7, with the 33 seats of Class 2 contested in regular elections. They coincided with the landslide re-election of Republican President Richard Nixon. Despite Nixon's landslide victory, Democrats increased their majority by two seats. The Democrats picked up open seats in Kentucky and South Dakota, and defeated four incumbent senators: Gordon Allott of Colorado, J. Caleb Boggs of Delaware, Jack Miller of Iowa, and Margaret Chase Smith of Maine. The Republicans picked up open seats in New Mexico, North Carolina, and Oklahoma, and defeated one incumbent, William B. Spong Jr. of Virginia.
The 1970 United States Senate elections was an election for the United States Senate. It took place on November 3, with the 33 seats of Class 1 contested in regular elections. Special elections were also held to fill vacancies. These races occurred in the middle of Richard Nixon's first term as president. The Democrats lost a net of three seats, while the Republicans and the Conservative Party of New York picked up one net seat each, and former Democrat Harry F. Byrd Jr. was re-elected as an independent.
The 1966 United States Senate elections were elections on November 8, 1966 for the United States Senate which occurred midway through the second term of President Lyndon B. Johnson. The 33 seats of Class 2 were contested in regular elections. Special elections were also held to fill vacancies. With divisions in the Democratic base over the Vietnam War, and with the traditional mid-term advantage of the party not holding the presidency, the Republicans took three Democratic seats, thereby breaking Democrats' 2/3rds supermajority. Despite Republican gains, the balance remained overwhelmingly in favor of the Democrats, who retained a 64–36 majority. Democrats were further reduced to 63-37, following the death of Robert F. Kennedy in June 1968.
The 1964 United States Senate elections were held on November 3. The 33 seats of Class 1 were contested in regular elections. Special elections were also held to fill vacancies. They coincided with the election of President Lyndon B. Johnson by an overwhelming majority, to a full term. His Democratic Party picked up a net two seats from the Republicans. As of 2023, this was the last time either party has had a two-thirds majority in the Senate, which would have hypothetically allowed the Senate Democrats to override a veto, propose constitutional amendments, or convict and expel certain officials without any votes from Senate Republicans. In practice, however, internal divisions effectively prevented the Democrats from doing so. The Senate election cycle coincided with Democratic gains in the House in the same year.
The 1960 United States Senate elections coincided with the election of John F. Kennedy as president on November 8, 1960. The 33 seats of Class 2 were contested in regular elections. A special election was also held on June 28, 1960, for a mid-term vacancy in North Dakota where Democrats flipped a seat to expand their majority to 66-34. As Majority Leader Lyndon Johnson was elected Vice President, Mike Mansfield became the new Majority Leader.
The 1958 United States Senate elections were elections for the United States Senate which occurred in the middle of President Dwight D. Eisenhower's second term. Thirty-two seats of Class 1 were contested in regular elections, the new state of Alaska held its first Senate elections for its Class 2 and 3 seats, and two special elections were held to fill vacancies.
The 1954 United States Senate elections was a midterm election in the first term of Dwight D. Eisenhower's presidency. The 32 Senate seats of Class 2 were contested in regular elections, and six special elections were held to fill vacancies. Eisenhower's Republican party lost a net of two seats to the Democratic opposition. This small change was just enough to give Democrats control of the chamber with the support of an Independent who agreed to caucus with them, he later officially joined the party in April 1955.
The 1946 United States Senate elections were held November 5, 1946, in the middle of Democratic President Harry S. Truman's first term after Roosevelt's passing. The 32 seats of Class 1 were contested in regular elections, and four special elections were held to fill vacancies. The Republicans took control of the Senate by picking up twelve seats, mostly from the Democrats. This was the first time since 1932 that the Republicans had held the Senate, recovering from a low of 16 seats following the 1936 Senate elections.
The 1956 United States Senate election in Maryland was held on November 6, 1956. Incumbent Republican U.S. Senator John Marshall Butler was re-elected to a second term in office, defeating Democratic businessman George P. Mahoney.
The 1970 United States Senate election in Maryland took place on November 3, 1970. Incumbent Democratic U.S. Senator Joseph Tydings ran for re-election to a second term, but was narrowly defeated by Republican U.S. Representative J. Glenn Beall Jr.
The 1968 United States Senate election in Ohio took place on November 5, 1968. Incumbent Senator Frank Lausche ran for re-election to a third term, but lost the Democratic primary to former U.S. Representative John J. Gilligan. Before losing the primary to the more solidly liberal Gilligan, Lausche had one of the most conservative voting record among Senate Democrats, leaving the Democratic Party very disappointed. In the general election, Gilligan lost to Republican Ohio Attorney General William Saxbe in a very close race. Saxbe's victory increased the number of Senate Republicans in the 91st Congress. He would serve 5 years in the Senate before being nominated by President Richard Nixon to be U.S Attorney General, he resigned the seat after being confirmed. Gilligan, who in January 1974 was serving as the Governor of Ohio, named Saxbe's successor.
The 1950 United States Senate election in Maryland was held on November 7, 1950. Incumbent Democratic U.S. Senator Millard Tydings ran for a fifth term in office, but was defeated by Republican John Marshall Butler.
The 1960 United States Senate election in Iowa took place on November 8, 1960. Incumbent Republican Senator Thomas E. Martin did not run for re-election to a second term. Jack Miller won the open seat by defeating Democratic Governor Herschel Loveless.
The 1960 United States Senate election in Kentucky took place on November 6, 1960. Incumbent Republican Senator John Sherman Cooper, who won a 1956 special election to fill the vacant seat of Alben Barkley, was elected to a full term in office, defeating Democratic former Governor and Undersecretary of Labor Keen Johnson.
The 1966 United States Senate election in Iowa took place on November 8, 1966. Incumbent Republican Senator Jack Miller was re-elected to a second term in office over Democrat E.B. Smith.
The 1972 United States Senate election in Kentucky took place on November 7, 1972. Incumbent Republican Senator John Sherman Cooper retired, and Democratic State Senator Walter Dee Huddleston narrowly won the open seat over former Republican Governor Louie Nunn.
The 1978 United States Senate election in Kentucky took place on November 7, 1978. Incumbent U.S. Senator Walter Dee Huddleston was re-elected to a second term. As of 2023, this was the last time a Democrat or anyone other than Mitch McConnell won the Class 2 Senate seat in Kentucky.
The 1968 United States Senate election in Kentucky took place on November 5, 1968. Incumbent Republican U.S. Senator Thruston Morton retired from office. Jefferson County Judge Marlow Cook won the open seat.