1884 United States presidential election in Kentucky

Last updated

1884 United States presidential election in Kentucky
  1880 November 4, 1884 1888  
  StephenGroverCleveland.jpg Unsuccessful 1884.jpg
Nominee Grover Cleveland James G. Blaine
Party Democratic Republican
Home state New York Maine
Running mate Thomas A. Hendricks John A. Logan
Electoral vote130
Popular vote152,961118,690
Percentage55.32%42.93%

Kentucky Presidential Election Results 1884.svg
County Results

President before election

Chester A. Arthur
Republican

Elected President

Grover Cleveland
Democratic

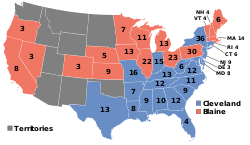
The 1884 United States presidential election in Kentucky took place on November 4, 1884. All contemporary thirty-eight states were part of the 1884 United States presidential election. Voters chose thirteen electors to the Electoral College, which selected the president and vice president.

Contents

Ever since the Civil War, Kentucky had been shaped politically by divisions created by that war between secessionist, Democratic counties and Unionist, Republican ones, [1] although the state as a whole leaned Democratic throughout this era and the Republican Party would never carry the state during the Third Party System at either presidential [2] or gubernatorial level. [3] What would become a long-lived partisan system [1] after the state was freed from the direct control of former Confederates would not be seriously affected by the first post-war insurgency movement – that of the Greenback Party at the tail end of the 1870s in the secessionist Jackson Purchase and other western regions. [3] The Democratic Party would permanently lose some of the Greenback voters, especially in the Western Coal Field region, with the result that nominee Grover Cleveland lost three points on Winfield Scott Hancock’s 1880 margin.

As of the 2020 presidential election , this is the last occasion when Russell County voted for a Democratic presidential candidate. [4]

Results

Presidential Candidate Running Mate PartyElectoral Vote (EV)Popular Vote (PV)
Grover Cleveland Thomas A. Hendricks Democratic 13 [5] 152,96155.32%
James G. Blaine John A. Logan Republican 0118,69042.93%
John St. John William Daniel Prohibition 03,1391.14%
Benjamin Butler Absolom West Greenback 01,6910.61%

Results by county

CountyStephen Grover Cleveland
Democratic
James Gillespie Blaine
Republican
Various candidates
Other parties
MarginTotal votes cast [6]
#%#%#%#%
Adair 1,05951.43%98948.03%110.53%703.40%2,059
Allen 1,04557.10%76041.53%251.37%28515.57%1,830
Anderson 1,11963.83%61234.91%221.25%50728.92%1,753
Ballard 1,88676.11%54622.03%461.86%1,34054.08%2,478
Barren 2,08462.62%1,17635.34%682.04%90827.28%3,328
Bath 1,26052.50%1,13247.17%80.33%1285.33%2,400
Bell 23830.24%53768.23%121.52%-299-37.99%787
Boone 1,69475.22%52923.49%291.29%1,16551.73%2,252
Bourbon 1,83650.04%1,82849.82%50.14%80.22%3,669
Boyd 1,10645.01%1,33554.33%160.65%-229-9.32%2,457
Boyle 1,25349.21%1,23448.47%592.32%190.75%2,546
Bracken 1,73964.12%92534.11%481.77%81430.01%2,712
Breathitt 87064.59%45934.08%181.34%41130.51%1,347
Breckinridge 1,34152.18%1,17945.88%501.95%1626.30%2,570
Bullitt 63266.25%30231.66%202.10%33034.59%954
Butler 76139.59%99751.87%1648.53%-236-12.28%1,922
Caldwell 1,13656.69%83241.52%361.80%30415.17%2,004
Calloway 1,36176.29%35419.84%693.87%1,00756.45%1,784
Campbell 3,11147.96%3,31951.17%560.86%-208-3.21%6,486
Carroll 1,34972.96%43423.47%663.57%91549.49%1,849
Carter 1,14845.39%1,35353.50%281.11%-205-8.11%2,529
Casey 74248.50%73648.10%523.40%60.39%1,530
Christian 2,00139.85%2,81856.12%2024.02%-817-16.27%5,021
Clark 1,49354.31%1,24445.25%120.44%2499.06%2,749
Clay 68242.10%93157.47%70.43%-249-15.37%1,620
Clinton 26932.93%54066.10%80.98%-271-33.17%817
Crittenden 85946.46%91449.43%764.11%-55-2.97%1,849
Cumberland 52943.54%67555.56%110.91%-146-12.02%1,215
Daviess 3,13965.77%1,57132.91%631.32%1,56832.85%4,773
Edmonson 63353.46%54546.03%60.51%887.43%1,184
Elliott 87376.98%26123.02%00.00%61253.97%1,134
Estill 78551.48%73748.33%30.20%483.15%1,525
Fayette 2,59345.98%3,00053.19%470.83%-407-7.22%5,640
Fleming 1,67751.46%1,54247.32%401.23%1354.14%3,259
Floyd 1,13665.10%60834.84%10.06%52830.26%1,745
Franklin 1,81959.44%1,22740.10%140.46%59219.35%3,060
Fulton 98775.11%30723.36%201.52%68051.75%1,314
Gallatin 75374.19%25425.02%80.79%49949.16%1,015
Garrard 1,00947.46%1,08651.08%311.46%-77-3.62%2,126
Grant 1,34561.19%80436.58%492.23%54124.61%2,198
Graves 2,75470.60%1,08127.71%661.69%1,67342.89%3,901
Grayson 1,17651.60%1,03045.20%733.20%1466.41%2,279
Green 68246.17%78553.15%100.68%-103-6.97%1,477
Greenup 99445.22%1,19254.23%120.55%-198-9.01%2,198
Hancock 65650.50%53240.95%1118.55%1249.55%1,299
Hardin 1,53161.61%90136.26%532.13%63025.35%2,485
Harlan 21725.03%65074.97%00.00%-433-49.94%867
Harrison 1,86161.54%1,12037.04%431.42%74124.50%3,024
Hart 1,34858.94%86938.00%703.06%47920.94%2,287
Henderson 2,37953.71%1,97044.48%801.81%4099.23%4,429
Henry 1,53959.84%93936.51%943.65%60023.33%2,572
Hickman 1,20469.84%48928.36%311.80%71541.47%1,724
Hopkins 1,62855.13%1,12538.10%2006.77%50317.03%2,953
Jackson 28029.26%65668.55%212.19%-376-39.29%957
Jefferson 11,26655.23%8,70942.69%4242.08%2,55712.53%20,399
Jessamine 1,13453.72%97146.00%60.28%1637.72%2,111
Johnson 76439.85%1,14059.47%130.68%-376-19.61%1,917
Kenton 4,48955.70%3,45942.92%1111.38%1,03012.78%8,059
Knott 45377.57%11920.38%122.05%33457.19%584
Knox 60839.45%92159.77%120.78%-313-20.31%1,541
Larue 86064.81%45634.36%110.83%40430.44%1,327
Laurel 82443.60%1,04555.29%211.11%-221-11.69%1,890
Lawrence 1,41953.51%1,23146.42%20.08%1887.09%2,652
Lee 38548.43%41051.57%00.00%-25-3.14%795
Leslie 7612.79%51887.21%00.00%-442-74.41%594
Letcher 29645.26%35754.59%10.15%-61-9.33%654
Lewis 1,15243.02%1,49855.94%281.05%-346-12.92%2,678
Lincoln 1,37754.51%1,07842.68%712.81%29911.84%2,526
Livingston 92270.76%37028.40%110.84%55242.36%1,303
Logan 2,31755.04%1,86144.20%320.76%45610.83%4,210
Lyon 74854.28%57141.44%594.28%17712.84%1,378
Madison 2,29551.72%2,10647.46%360.81%1894.26%4,437
Magoffin 70346.90%79653.10%00.00%-93-6.20%1,499
Marion 1,48860.69%94338.46%210.86%54522.23%2,452
Marshall 1,23979.37%29518.90%271.73%94460.47%1,561
Martin 17930.81%40269.19%00.00%-223-38.38%581
Mason 2,64654.98%2,12044.05%470.98%52610.93%4,813
McCracken 1,99260.88%1,26238.57%180.55%73022.31%3,272
McLean 81860.37%47234.83%654.80%34625.54%1,355
Meade 96069.57%39428.55%261.88%56641.01%1,380
Menifee 51172.79%18225.93%91.28%32946.87%702
Mercer 1,49654.84%1,16142.56%712.60%33512.28%2,728
Metcalfe 64847.09%68149.49%473.42%-33-2.40%1,376
Monroe 54139.60%79358.05%322.34%-252-18.45%1,366
Montgomery 1,37155.73%1,07843.82%110.45%29311.91%2,460
Morgan 1,30168.01%60831.78%40.21%69336.23%1,913
Muhlenberg 1,31154.78%1,02442.79%582.42%28711.99%2,393
Nelson 1,53462.59%87735.78%401.63%65726.81%2,451
Nicholas 1,34459.18%87538.53%522.29%46920.65%2,271
Ohio 1,57351.24%1,39945.57%983.19%1745.67%3,070
Oldham 67761.77%37334.03%464.20%30427.74%1,096
Owen 2,39979.23%57719.06%521.72%1,82260.17%3,028
Owsley 22427.42%58871.97%50.61%-364-44.55%817
Pendleton 1,56354.84%1,23743.40%501.75%32611.44%2,850
Perry 23629.28%56670.22%40.50%-330-40.94%806
Pike 1,14251.51%1,07348.40%20.09%693.11%2,217
Powell 38555.96%30043.60%30.44%8512.35%688
Pulaski 1,37438.70%2,13160.03%451.27%-757-21.32%3,550
Robertson 48365.63%24833.70%50.68%23531.93%736
Rockcastle 69843.54%90556.46%00.00%-207-12.91%1,603
Rowan 41347.31%46052.69%00.00%-47-5.38%873
Russell 53051.51%47245.87%272.62%585.64%1,029
Scott 1,78956.19%1,32841.71%672.10%46114.48%3,184
Shelby 1,98360.87%1,22837.69%471.44%75523.17%3,258
Simpson 1,03160.61%64137.68%291.70%39022.93%1,701
Spencer 87070.50%35829.01%60.49%51241.49%1,234
Taylor 83259.43%55839.86%100.71%27419.57%1,400
Todd 1,10451.64%95844.81%763.55%1466.83%2,138
Trigg 1,31257.87%89639.52%592.60%41618.35%2,267
Trimble 94181.97%17214.98%353.05%76966.99%1,148
Union 1,86372.83%62624.47%692.70%1,23748.36%2,558
Warren 2,93760.32%1,86638.32%661.36%1,07122.00%4,869
Washington 1,14450.09%1,13349.61%70.31%110.48%2,284
Wayne 77553.37%65445.04%231.58%1218.33%1,452
Webster 1,18061.24%55228.65%19510.12%62832.59%1,927
Whitley 48029.81%1,10668.70%241.49%-626-38.88%1,610
Wolfe 68862.83%40336.80%40.37%28526.03%1,095
Woodford 1,26752.33%1,12646.51%281.16%1415.82%2,421
Totals152,96155.32%118,68842.93%4,8301.75%34,27312.40%276,479

See also

References

  1. 1 2 Sullivan, Robert David; ‘How the Red and Blue Map Evolved Over the Past Century’; America Magazine in The National Catholic Review; June 29, 2016
  2. Phillips, Kevin P.; The Emerging Republican Majority, p. 350 ISBN   978-0-691-16324-6
  3. 1 2 Brown, Thomas J.; ‘The Roots of Bluegrass Insurgency: An Analysis of the Populist Movement in Kentucky’; The Register of the Kentucky Historical Society, Vol. 78, No. 3 (Summer 1980), pp. 219-242
  4. Menendez, Albert J.; The Geography of Presidential Elections in the United States, 1868-2004; pp. 208-213 ISBN   0786422173
  5. "1884 Presidential General Election Results – Kentucky". Dave Leip's U.S. Election Atlas.
  6. "The Tribune almanac and political register for.. 1885 1885". HathiTrust. Retrieved July 15, 2025.