1884 United States presidential election in Michigan

Last updated

1884 United States presidential election in Michigan
Flag of Michigan.svg
  1880 November 4, 1884 1888  

All 13 Michigan votes to the Electoral College
  Unsuccessful 1884.jpg StephenGroverCleveland.jpg Bfbutler.jpg
Nominee James G. Blaine Grover Cleveland Benjamin Butler
Party Republican Democratic Greenback
Alliance Anti-Monopoly Party
Home state Maine New York Massachusetts
Running mate John A. Logan Thomas A. Hendricks Absolom West
Electoral vote1300
Popular vote192,669149,38541,499
Percentage47.79%37.20%10.29%

Michigan Presidential Election Results 1884.svg
County Results

President before election

Chester A. Arthur
Republican

Elected President

Grover Cleveland
Democratic

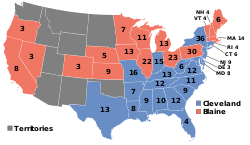
The 1884 United States presidential election in Michigan took place on November 4, 1884, as part of the 1884 United States presidential election. Voters chose 13 [1] representatives, or electors, to the Electoral College, who voted for president and vice president.

Contents

Benjamin Butler received the nominations of both the Greenback and Anti-Monopoly parties in Michigan. Butler initially hoped to organize fusion tickets with the minority party in each state in the election, a strategy designed to capitalize on the cross-partisan popularity of many elements of the candidate's program. The Greenbacks succeeded in negotiating fusion arrangements with the Democratic Party in Michigan, wherein they were balloted separately but shared 12 of the state's 13 electors. The fusion electors agreed to divide their votes between Butler and Democratic candidate Grover Cleveland in proportion to the statewide popular vote for each candidate, had their combined vote been sufficient to achieve a plurality in the state. [2] [3]

Michigan was won by the Republican nominee James G. Blaine over Cleveland and Butler in a close race by only 1,335 votes, a margin of less than 1%. [4]

Barry and Newaygo counties have voted Democratic once since this election, in 1964.

Results

1884 United States presidential election in Michigan
PartyCandidateVotes%
Republican James G. Blaine 192,669 47.79%
Democratic Grover Cleveland 149,38537.17%
Greenback Benjamin Butler 41,49910.29%
Prohibition John St. John 18,4034.56%
Total votes403,159 100%

Results by county

CountyJames G. Blaine
Republican
Grover Cleveland
Democratic
John St. John
Prohibition
Benjamin Butler
Greenback/Anti-Monopoly
Various candidates
Other parties
Margin [a] Total votes
# %# %# %# %# %# %
Alcona 54561.58%32937.18%10.11%91.02%10.11%20723.39%885
Allegan 4,08047.56%2,81032.76%92710.81%7608.86%10.01%5105.95%8,578
Alpena 92743.98%92443.83%592.80%1989.39%00.00%-195-9.25%2,108
Antrim 1,06658.51%36419.98%372.03%35519.48%00.00%34719.05%1,822
Arenac 32333.93%171.79%444.62%53155.78%373.89%-225-23.63%952
Baraga 39656.33%30743.67%00.00%00.00%00.00%8912.66%703
Barry 2,69943.69%1,15018.62%4016.49%192731.20%00.00%-378-6.12%6,177
Bay 2,91635.12%3,43641.39%1611.94%153418.48%2553.07%-2,054-24.74%8,302
Benzie 55654.89%24541.39%1617.60%13513.33%00.00%17617.37%1,013
Berrien 4,44548.07%4,03043.58%3453.73%4274.62%00.00%-12-0.13%9,247
Branch 3,67152.07%1,31518.65%4195.94%164423.32%10.01%71210.10%7,050
Calhoun 5,11346.42%4,69342.61%5645.12%6445.85%00.00%-224-2.03%11,014
Cass 2,76448.20%2,52744.06%2163.77%2233.89%50.09%140.24%5,735
Charlevoix 1,04352.97%40120.37%562.84%46923.82%00.00%1738.79%1,969
Cheboygan 77745.57%57733.84%402.35%31118.24%00.00%-111-6.51%1,705
Chippewa 68651.12%63547.32%211.56%00.00%00.00%513.80%1,342
Clare 62243.34%50335.05%342.37%27118.89%50.35%-152-10.59%1,435
Clinton 2,78243.98%2,41338.14%3154.98%81412.87%20.03%-445-7.03%6,326
Crawford 30456.72%17833.21%91.68%458.40%00.00%8115.11%536
Delta 1,20166.13%60933.54%60.33%00.00%00.00%59232.60%1,816
Eaton 4,10649.37%3,71733.83%4945.93%91110.94%00.00%3774.53%8,329
Emmet 77943.74%58732.96%1055.90%31017.41%00.00%-118-6.63%1,781
Genesee 4,32847.84%3,15334.86%100511.11%5606.19%00.00%6156.80%9,046
Gladwin 28854.03%20839.02%00.00%193.56%183.38%6111.44%533
Grand Traverse 1,64564.64%54921.57%943.69%25710.10%00.00%83932.97%2,545
Gratiot 2,67647.01%1,52626.81%2834.97%1,20721.21%00.00%-57-1.00%5,692
Hillsdale 4,31552.18%2,02424.48%6297.61%1,29515.66%60.07%99612.04%8,269
Houghton 2,38357.90%1,69241.11%390.95%20.05%00.00%68916.74%4,116
Huron 1,35539.48%1,45442.37%1795.22%44412.94%00.00%-543-15.82%3,432
Ingham 3,70942.35%3,27237.36%4725.39%1,29214.75%120.14%-855-9.76%8,757
Ionia 3,55245.11%2,72834.65%5036.39%1,08413.77%70.09%-260-3.30%7,874
Iosco 1,01650.12%84441.64%432.12%1246.12%00.00%482.37%2,027
Isabella 1,61748.72%1,03331.12%832.50%58117.51%50.15%30.09%3,319
Isle Royale 00.00%00.00%00.00%9100.00%00.00%-9-100.00%9
Jackson 4,80443.90%4,38340.05%6455.89%1,0609.69%510.47%-639-5.84%10,943
Kalamazoo 4,51551.19%3,45239.14%4555.16%3984.51%00.00%6657.54%8,820
Kalkaska 63060.87%18217.58%353.38%18818.16%00.00%26025.12%1,035
Kent 9,00745.70%6,90235.02%1,0405.28%2,75513.98%50.03%-650-3.30%19,709
Keweenaw 62074.43%20124.13%121.44%00.00%00.00%41950.30%833
Lake 95155.42%44726.05%1096.35%20912.18%00.00%29517.19%1,716
Lapeer 3,06250.15%2,49940.94%2764.52%2403.93%270.44%3235.29%6,104
Leelanau 81157.48%48534.37%211.49%946.66%00.00%23216.44%1,411
Lenawee 5,82746.63%5,27142.18%1,0978.78%3002.40%10.01%2562.05%12,496
Livingston 2,59744.73%2,62145.14%2724.68%3165.44%00.00%-340-5.86%5,806
Mackinac 47946.06%54352.21%30.29%151.44%00.00%-79-7.60%1,040
Macomb 2,78242.97%3,33651.52%2233.44%1302.01%40.06%-684-10.56%6,475
Manistee 1,30538.43%1,22336.01%1624.77%70620.79%00.00%-624-18.37%3,396
Manitou 1810.84%14889.16%00.00%00.00%00.00%-130-78.31%166
Marquette 4,23073.48%1,46725.48%480.83%120.21%00.00%2,75147.79%5,757
Mason 1,29950.39%1,01139.22%572.21%2118.18%00.00%772.99%2,578
Mecosta 2,36553.74%1,16626.49%1874.25%68315.52%00.00%51611.72%4,401
Menominee 2,61473.20%91825.71%250.70%140.39%00.00%1,68247.10%3,571
Midland 1,07154.09%45723.08%442.22%39920.15%90.45%21510.86%1,980
Missaukee 47054.27%29433.95%263.00%768.78%00.00%10011.55%866
Monroe 3,02541.87%3,73551.70%2243.10%1902.63%510.71%-900-12.46%7,225
Montcalm 3,85749.25%2,29629.32%1732.21%1,50219.18%30.04%590.75%7,831
Montmorency 9338.91%4820.08%93.77%8937.24%00.00%-44-18.41%239
Muskegon 3,48349.86%2,11930.33%3174.54%1,04214.92%250.36%3224.61%6,986
Newaygo 1,97146.65%99523.55%2034.80%1,05624.99%00.00%-80-1.89%4,225
Oakland 4,84244.90%5,10147.31%5224.84%3152.92%30.03%-574-5.32%10,783
Oceana 1,63751.04%66120.61%35711.13%55217.21%00.00%42413.22%3,207
Ogemaw 47849.28%37538.66%161.65%10110.41%00.00%20.21%970
Ontonagon 30153.94%23341.76%244.30%00.00%00.00%6812.19%558
Osceola 1,49758.43%67826.46%27310.66%1144.45%00.00%70527.52%2,562
Oscoda 19968.62%5719.66%41.38%3010.34%00.00%11238.62%290
Otsego 48552.95%19721.51%212.29%21323.25%00.00%758.19%916
Ottawa 3,75853.36%2,39033.93%2313.28%6599.36%50.07%70910.07%7,043
Presque Isle 39463.14%20232.37%00.00%284.49%00.00%16426.28%624
Roscommon 42748.80%40946.74%20.23%262.97%11.26%-8-0.91%875
Saginaw 5,93943.65%6,28646.20%2051.51%1,0757.90%1000.74%-1,422-10.45%13,605
Sanilac 1,92349.06%1,04326.61%1654.21%77719.82%120.31%1032.63%3,920
Schoolcraft 51861.96%28934.57%222.63%70.84%00.00%22226.56%836
Shiawassee 2,70541.70%1,67125.76%6239.60%1,47122.68%170.26%-437-6.74%6,487
St. Clair 4,01744.62%3,58339.80%3483.87%1,00211.13%530.59%-568-6.31%9,003
St. Joseph 3,26146.88%2,52736.33%1331.91%1,02914.79%60.09%-295-4.24%6,956
Tuscola 2,91449.74%2,08635.60%3225.50%5379.17%00.00%2914.97%5,859
Van Buren 4,21956.11%2,08827.77%3614.80%84511.24%60.08%1,28617.10%7,519
Washtenaw 4,04940.53%4,98349.88%6176.18%3323.32%90.09%-1,266-12.67%9,990
Wayne 17,31544.55%18,79448.35%7031.81%2,0565.29%00.00%-3,535-9.09%38,868
Wexford 1,22054.59%63228.28%1305.82%25311.32%00.00%33514.99%2,235
Totals192,66947.79%149,38537.17%18,4034.56%41,49910.29%7530.19%1,3350.33%403,159

Notes

  1. Because of an electoral fusion agreement, Cleveland and Butler votes are counted together.

See also

References

  1. "1884 Election for the Twenty-Fifth Term (1885-1889)" . Retrieved April 3, 2018.
  2. National Contest: Containing Portraits and Biographies of our National Favorites. Chicago. 1888. p. 127.{{cite book}}: CS1 maint: location missing publisher (link)
  3. Fuller, William D. (September 25, 1884). "Butler in Michigan". Iowa Plain Dealer.
  4. Inter-university Consortium for Political and Social Research (April 26, 1999). "United States Historical Election Returns, 1824-1968". doi:10.3886/ICPSR00001.v3 . Retrieved November 14, 2024.