| ||||||||||||||||||||||||||
All 20 Michigan votes to the Electoral College | ||||||||||||||||||||||||||
---|---|---|---|---|---|---|---|---|---|---|---|---|---|---|---|---|---|---|---|---|---|---|---|---|---|---|
Turnout | 59.3% [1] | |||||||||||||||||||||||||
| ||||||||||||||||||||||||||
County Results
| ||||||||||||||||||||||||||
|
Elections in Michigan |
---|
The 1984 United States presidential election in Michigan took place on November 6, 1984. All 50 states and the District of Columbia, were part of the 1984 United States presidential election. Voters chose 20 electors to the Electoral College, which selected the president and vice president of the United States. Michigan was won by incumbent United States President Ronald Reagan of California, who was running against former Vice President Walter Mondale of Minnesota. Reagan ran for a second time with vice president George H. W. Bush of Texas, and Mondale ran with Representative Geraldine Ferraro of New York, the first major female candidate for the vice presidency.
The presidential election of 1984 was a very partisan election for Michigan, with just over 99% of the electorate voting only either Democratic or Republican, though several more parties appeared on the ballot. [2] All but five counties gave Reagan a majority; one (Marquette) gave him a plurality. Mondale carried just four counties, all with a majority: Wayne County (home of Detroit), and tiny Iron, Keweenaw, and Gogebic Counties, all in the Upper Peninsula, a region then typified by heavy unionization and the mining industry. Michigan weighed in for this election as 0.77% more Republican than the national average. As of the 2020 presidential election [update] , this is the last election in which Washtenaw County, Genesee County, and Marquette County voted for a Republican presidential candidate. [3] Bay, Saginaw, and Lake counties would not vote Republican again until 2016.
Reagan won the election in Michigan with a decisive 19% landslide, making it 0.8% more Republican than the nation at large. Reagan performed particularly strongly in suburban Oakland County, which he won by over 100,000 raw votes, but he performed strongly almost throughout Michigan's Lower Peninsula (home to a vast majority of its population), including most of its major population centers aside from Wayne County: Oakland, Macomb (Warren), Kent (Grand Rapids), Genesee (Flint), Ingham (Lansing), Washtenaw (Ann Arbor), Kalamazoo (Kalamazoo), and Saginaw (Saginaw) all gave Reagan majorities. No nominee had carried so few counties in Michigan's Lower Peninsula since 1952; as Adlai Stevenson had carried Macomb as well as Wayne in 1956; Barry Goldwater had carried three counties in the Lower Peninsula in 1964; and even George McGovern had carried Washtenaw and rural Lake County, in addition to Wayne, in 1972.
Unlike in Pennsylvania and some of the other Upper Midwest states, there were few signs in 1984 of Michigan's imminent transition to becoming part of the 'Blue Wall' from 1992 through 2012. Whereas in some other states, Reagan either lost or only narrowly won working-class areas, he scored powerful wins in Macomb and Saginaw counties. There were also few rural Democratic redoubts in the state in 1984, unlike in many other states.
Whereas Mondale made inroads elsewhere in the country in 'cultural elite' counties including college counties, high-tech areas, and artists' colonies. [lower-alpha 1] [4] However, in Michigan, Washtenaw County, home to the University of Michigan, flipped against Mondale, despite having voted even for McGovern in 1972.
And, as elsewhere, Reagan scored heavily in the state's affluent suburbs particularly concentrated in Oakland County. In 1988, Michigan would continue its run of voting more Republican than the nation, although this time only slightly more so, before turning blue for six elections straight in 1992. This is also the last election where Michigan voted more Republican than Ohio or Tennessee.
1984 United States presidential election in Michigan | |||||
---|---|---|---|---|---|
Party | Candidate | Votes | Percentage | Electoral votes | |
Republican | Ronald Reagan (incumbent) | 2,251,571 | 59.23% | 20 | |
Democratic | Walter Mondale | 1,529,638 | 40.24% | 0 | |
Libertarian | David Bergland | 10,055 | 0.26% | 0 | |
Independent | Lyndon LaRouche | 3,862 | 0.10% | 0 | |
Workers World | Larry Holmes | 1,416 | 0.04% | 0 | |
Citizen's Party | Sonia Johnson | 1,191 | 0.03% | 0 | |
Socialist Workers Party | Melvin Mason | 1,049 | 0.03% | 0 | |
Communist Party | Gus Hall | 1,048 | 0.03% | 0 | |
New Alliance Party | Dennis Serrette | 665 | 0.02% | 0 | |
Write-Ins | 602 | 0.02% | 0 | ||
Socialist Equality Party | Edward Winn | 561 | 0.01% | 0 | |
Totals | 3,801,658 | 100.0% | 20 |
County | Ronald Reagan Republican | Walter Mondale Democratic | Various candidates Other parties | Margin | Total votes cast [5] | ||||
---|---|---|---|---|---|---|---|---|---|
# | % | # | % | # | % | # | % | ||
Alcona | 3,223 | 66.41% | 1,616 | 33.30% | 14 | 0.29% | 1,607 | 33.11% | 4,853 |
Alger | 2,175 | 51.69% | 2,018 | 47.96% | 15 | 0.36% | 157 | 3.73% | 4,208 |
Allegan | 23,762 | 73.48% | 8,389 | 25.94% | 187 | 0.58% | 15,373 | 47.54% | 32,338 |
Alpena | 8,212 | 61.30% | 5,136 | 38.34% | 49 | 0.37% | 3,076 | 22.96% | 13,397 |
Antrim | 5,726 | 69.18% | 2,507 | 30.29% | 44 | 0.53% | 3,219 | 38.89% | 8,277 |
Arenac | 3,483 | 58.63% | 2,436 | 41.00% | 22 | 0.37% | 1,047 | 17.63% | 5,941 |
Baraga | 1,965 | 51.82% | 1,818 | 47.94% | 9 | 0.24% | 147 | 3.88% | 3,792 |
Barry | 14,245 | 69.98% | 5,989 | 29.42% | 122 | 0.60% | 8,256 | 40.56% | 20,356 |
Bay | 26,198 | 53.43% | 22,597 | 46.09% | 235 | 0.48% | 3,601 | 7.34% | 49,030 |
Benzie | 3,590 | 65.25% | 1,866 | 33.91% | 46 | 0.84% | 1,724 | 31.34% | 5,502 |
Berrien | 43,160 | 66.58% | 21,228 | 32.75% | 436 | 0.67% | 21,932 | 33.83% | 64,824 |
Branch | 11,004 | 73.63% | 3,860 | 25.83% | 81 | 0.54% | 7,144 | 47.80% | 14,945 |
Calhoun | 34,470 | 62.60% | 20,313 | 36.89% | 284 | 0.52% | 14,157 | 25.71% | 55,067 |
Cass | 11,647 | 63.32% | 6,634 | 36.07% | 113 | 0.61% | 5,013 | 27.25% | 18,394 |
Charlevoix | 6,355 | 66.23% | 3,175 | 33.09% | 65 | 0.68% | 3,180 | 33.14% | 9,595 |
Cheboygan | 6,053 | 64.04% | 3,358 | 35.53% | 41 | 0.43% | 2,695 | 28.51% | 9,452 |
Chippewa | 8,135 | 63.77% | 4,575 | 35.86% | 47 | 0.37% | 3,560 | 27.91% | 12,757 |
Clare | 6,587 | 63.26% | 3,764 | 36.15% | 61 | 0.59% | 2,823 | 27.11% | 10,412 |
Clinton | 17,387 | 73.28% | 6,226 | 26.24% | 113 | 0.48% | 11,161 | 47.04% | 23,726 |
Crawford | 3,303 | 67.46% | 1,558 | 31.82% | 35 | 0.71% | 1,745 | 35.64% | 4,896 |
Delta | 8,952 | 52.84% | 7,934 | 46.83% | 56 | 0.33% | 1,018 | 6.01% | 16,942 |
Dickinson | 6,880 | 54.91% | 5,614 | 44.80% | 36 | 0.29% | 1,266 | 10.11% | 12,530 |
Eaton | 27,720 | 72.57% | 10,290 | 26.94% | 189 | 0.49% | 17,430 | 45.63% | 38,199 |
Emmet | 7,760 | 70.04% | 3,254 | 29.37% | 66 | 0.60% | 4,506 | 40.67% | 11,080 |
Genesee | 92,943 | 50.68% | 89,491 | 48.80% | 953 | 0.52% | 3,452 | 1.88% | 183,387 |
Gladwin | 5,401 | 61.07% | 3,368 | 38.08% | 75 | 0.85% | 2,033 | 22.99% | 8,844 |
Gogebic | 4,006 | 41.81% | 5,554 | 57.97% | 21 | 0.22% | -1,548 | -16.16% | 9,581 |
Grand Traverse | 18,036 | 70.83% | 7,271 | 28.55% | 157 | 0.62% | 10,765 | 42.28% | 25,464 |
Gratiot | 10,456 | 72.08% | 4,000 | 27.57% | 50 | 0.34% | 6,456 | 44.51% | 14,506 |
Hillsdale | 12,063 | 76.50% | 3,616 | 22.93% | 89 | 0.56% | 8,447 | 53.57% | 15,768 |
Houghton | 8,652 | 57.14% | 6,434 | 42.49% | 55 | 0.36% | 2,218 | 14.65% | 15,141 |
Huron | 11,073 | 73.37% | 3,966 | 26.28% | 52 | 0.34% | 7,107 | 47.09% | 15,091 |
Ingham | 68,753 | 59.23% | 46,411 | 39.98% | 919 | 0.79% | 22,342 | 19.25% | 116,083 |
Ionia | 14,162 | 70.69% | 5,735 | 28.62% | 138 | 0.69% | 8,427 | 42.07% | 20,035 |
Iosco | 7,907 | 66.99% | 3,850 | 32.62% | 47 | 0.40% | 4,057 | 34.37% | 11,804 |
Iron | 3,468 | 49.15% | 3,559 | 50.44% | 29 | 0.41% | -91 | -1.29% | 7,056 |
Isabella | 12,215 | 65.00% | 6,435 | 34.24% | 143 | 0.76% | 5,780 | 30.76% | 18,793 |
Jackson | 40,133 | 68.27% | 18,340 | 31.20% | 312 | 0.53% | 21,793 | 37.07% | 58,785 |
Kalamazoo | 58,327 | 63.82% | 32,460 | 35.52% | 601 | 0.66% | 25,867 | 28.30% | 91,388 |
Kalkaska | 3,623 | 69.15% | 1,595 | 30.44% | 21 | 0.40% | 2,028 | 38.71% | 5,239 |
Kent | 137,417 | 67.03% | 66,238 | 32.31% | 1,365 | 0.67% | 71,179 | 34.72% | 205,020 |
Keweenaw | 599 | 48.82% | 628 | 51.18% | 0 | 0.00% | -29 | -2.36% | 1,227 |
Lake | 2,125 | 53.09% | 1,845 | 46.09% | 33 | 0.82% | 280 | 7.00% | 4,003 |
Lapeer | 19,222 | 70.67% | 7,800 | 28.68% | 178 | 0.65% | 11,422 | 41.99% | 27,200 |
Leelanau | 5,356 | 67.62% | 2,498 | 31.54% | 67 | 0.85% | 2,858 | 36.08% | 7,921 |
Lenawee | 22,409 | 66.70% | 11,012 | 32.78% | 176 | 0.52% | 11,397 | 33.92% | 33,597 |
Livingston | 31,846 | 74.39% | 10,720 | 25.04% | 246 | 0.57% | 21,126 | 49.35% | 42,812 |
Luce | 1,715 | 66.97% | 833 | 32.53% | 13 | 0.51% | 882 | 34.44% | 2,561 |
Mackinac | 3,627 | 64.85% | 1,949 | 34.85% | 17 | 0.30% | 1,678 | 30.00% | 5,593 |
Macomb | 194,300 | 66.20% | 97,816 | 33.32% | 1,409 | 0.48% | 96,484 | 32.88% | 293,525 |
Manistee | 6,328 | 61.45% | 3,917 | 38.04% | 53 | 0.51% | 2,411 | 23.41% | 10,298 |
Marquette | 14,196 | 49.98% | 14,074 | 49.55% | 132 | 0.46% | 122 | 0.43% | 28,402 |
Mason | 8,202 | 67.83% | 3,803 | 31.45% | 87 | 0.72% | 4,399 | 36.38% | 12,092 |
Mecosta | 9,023 | 68.66% | 4,048 | 30.80% | 71 | 0.54% | 4,975 | 37.86% | 13,142 |
Menominee | 6,618 | 59.68% | 4,425 | 39.90% | 46 | 0.41% | 2,193 | 19.78% | 11,089 |
Midland | 21,521 | 66.11% | 10,769 | 33.08% | 262 | 0.80% | 10,752 | 33.03% | 32,552 |
Missaukee | 3,970 | 75.53% | 1,256 | 23.90% | 30 | 0.57% | 2,714 | 51.63% | 5,256 |
Monroe | 29,419 | 59.69% | 19,617 | 39.80% | 251 | 0.51% | 9,802 | 19.89% | 49,287 |
Montcalm | 13,109 | 70.14% | 5,491 | 29.38% | 89 | 0.48% | 7,618 | 40.76% | 18,689 |
Montmorency | 2,913 | 67.54% | 1,387 | 32.16% | 13 | 0.30% | 1,526 | 35.38% | 4,313 |
Muskegon | 39,355 | 60.67% | 25,247 | 38.92% | 261 | 0.40% | 14,108 | 21.75% | 64,863 |
Newaygo | 10,636 | 69.95% | 4,496 | 29.57% | 73 | 0.48% | 6,140 | 40.38% | 15,205 |
Oakland | 306,050 | 66.71% | 150,286 | 32.76% | 2,464 | 0.54% | 155,764 | 33.95% | 458,800 |
Oceana | 6,405 | 68.69% | 2,865 | 30.72% | 55 | 0.59% | 3,540 | 37.97% | 9,325 |
Ogemaw | 4,901 | 60.81% | 3,132 | 38.86% | 27 | 0.33% | 1,769 | 21.95% | 8,060 |
Ontonagon | 2,464 | 50.95% | 2,350 | 48.59% | 22 | 0.45% | 114 | 2.36% | 4,836 |
Osceola | 5,923 | 73.21% | 2,127 | 26.29% | 40 | 0.49% | 3,796 | 46.92% | 8,090 |
Oscoda | 2,239 | 69.77% | 951 | 29.64% | 19 | 0.59% | 1,288 | 40.13% | 3,209 |
Otsego | 4,639 | 68.27% | 2,117 | 31.16% | 39 | 0.57% | 2,522 | 37.11% | 6,795 |
Ottawa | 60,142 | 79.69% | 15,000 | 19.88% | 326 | 0.43% | 45,142 | 59.81% | 75,468 |
Presque Isle | 4,207 | 62.57% | 2,481 | 36.90% | 36 | 0.54% | 1,726 | 25.67% | 6,724 |
Roscommon | 6,419 | 65.35% | 3,359 | 34.20% | 45 | 0.46% | 3,060 | 31.15% | 9,823 |
Saginaw | 51,495 | 56.95% | 38,420 | 42.49% | 501 | 0.55% | 13,075 | 14.46% | 90,416 |
Sanilac | 12,627 | 75.12% | 4,126 | 24.54% | 57 | 0.34% | 8,501 | 50.58% | 16,810 |
Schoolcraft | 2,139 | 52.47% | 1,920 | 47.09% | 18 | 0.44% | 219 | 5.38% | 4,077 |
Shiawassee | 18,756 | 65.97% | 9,514 | 33.46% | 161 | 0.57% | 9,242 | 32.51% | 28,431 |
St. Clair | 36,114 | 67.63% | 16,998 | 31.83% | 287 | 0.54% | 19,116 | 35.80% | 53,399 |
St. Joseph | 15,405 | 72.34% | 5,795 | 27.21% | 96 | 0.45% | 9,610 | 45.13% | 21,296 |
Tuscola | 14,698 | 70.01% | 6,212 | 29.59% | 83 | 0.40% | 8,486 | 40.42% | 20,993 |
Van Buren | 16,426 | 64.55% | 8,853 | 34.79% | 166 | 0.65% | 7,573 | 29.76% | 25,445 |
Washtenaw | 58,736 | 51.27% | 55,084 | 48.08% | 749 | 0.65% | 3,652 | 3.19% | 114,569 |
Wayne | 367,391 | 42.31% | 496,632 | 57.19% | 4,320 | 0.50% | -129,241 | -14.88% | 868,343 |
Wexford | 7,279 | 67.93% | 3,398 | 31.71% | 38 | 0.35% | 3,881 | 36.22% | 10,715 |
Totals | 2,251,571 | 59.23% | 1,529,638 | 40.24% | 20,449 | 0.53% | 721,933 | 18.99% | 3,801,658 |
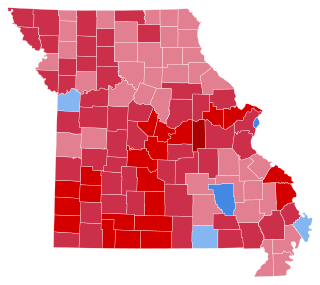
The 1984 United States presidential election in Missouri took place on November 6, 1984. All 50 states and the District of Columbia, were part of the 1984 United States presidential election. Voters chose 11 electors to the Electoral College, which selected the president and vice president of the United States.
The 1984 United States presidential election in California took place on November 6, 1984, as part of the 1984 United States presidential election. State voters chose 47 representatives, or electors, to the Electoral College, who voted for president and vice president. California voted for the Republican incumbent and former California Governor, Ronald Reagan, in a landslide over the Democratic challenger, former Minnesota Senator and Vice President Walter Mondale. Reagan easily won his home state with a comfortable 16.24% margin and carried all but five counties. Despite this, California's margin was 1.97% more Democratic than the nation as a whole.
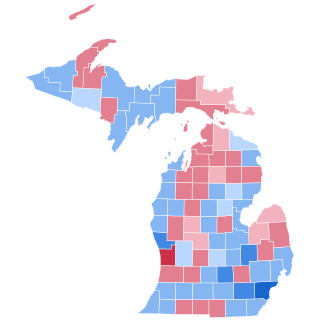
The 2008 United States presidential election in Michigan took place on November 4, 2008. It was part of the 2008 United States presidential election which happened throughout all 50 states and D.C. Voters chose 17 representatives, or electors to the Electoral College, who voted for president and vice president.
The 1984 United States presidential election in Minnesota took place on November 6, 1984, as part of the 1984 United States presidential election. Voters chose ten representatives, or electors to the Electoral College, who voted for president and vice president.
The 2002 Michigan gubernatorial election was one of the 36 United States gubernatorial elections held on November 5, 2002. Incumbent Republican Governor John Engler, after serving three terms, was term-limited and was ineligible to run for a fourth term; his lieutenant governor Dick Posthumus, also a Republican, ran in his place. Jennifer Granholm, then Attorney General of Michigan, ran on the Democratic Party ticket. Douglas Campbell ran on the Green Party ticket, and Joseph M. Pilchak ran on the Constitution Party ticket.
The Michigan Department of Health and Human Services (MDHHS) is a principal department of state of Michigan, headquartered in Lansing, that provides public assistance, child and family welfare services, and oversees health policy and management.
The 2000 United States presidential election in Michigan took place on November 7, 2000, and was part of the 2000 United States presidential election. Voters chose 18 representatives, or electors to the Electoral College, who voted for president and vice president.
The Michigan State Medical Society (MSMS) is a professional association representing more than 15,000 physicians in Michigan. Incorporated on June 5, 1866, MSMS is a non-profit, membership organization of physicians, graduates completing residency programs, and medical school students. MSMS is the state affiliate of the American Medical Association.
The 1984 United States presidential election in New York took place on November 6, 1984, as part of the 1984 United States presidential election. All 50 States and the District of Columbia participated in this election. Voters in New York chose 36 representatives, or electors to the Electoral College, who selected president and vice president.
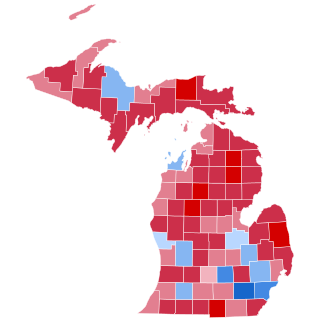
The 1988 United States presidential election in Michigan took place on November 8, 1988. All 50 states and the District of Columbia, were part of the 1988 United States presidential election. Voters chose 20 electors to the Electoral College, which selected the president and vice president.
The 1996 United States presidential election in Michigan took place on November 5, 1996. All 50 states and the District of Columbia, were part of the 1996 United States presidential election. Voters chose 18 electors to the Electoral College, which selected the president and vice president.
The 1984 United States presidential election in Oregon took place on November 6, 1984. All fifty states and the District of Columbia were part of the 1984 United States presidential election. Voters chose seven electors to the Electoral College, which selected the president and vice president of the United States.
The 1984 United States presidential election in Utah took place on November 6, 1984. All 50 states and the District of Columbia, were part of the 1984 United States presidential election. State voters chose five electors to the Electoral College, which selected the president and vice president of the United States. Utah was won by incumbent United States President Ronald Reagan of California, who was running against former Vice President Walter Mondale of Minnesota. Reagan ran for a second time with incumbent Vice President and former C.I.A. Director George H. W. Bush of Texas, and Mondale ran with Representative Geraldine Ferraro of New York, the first major female candidate for the vice presidency.
The 1984 United States presidential election in Colorado took place on November 6, 1984. All 50 states and the District of Columbia, were part of the 1984 United States presidential election. State voters chose eight electors to the Electoral College, which selected the president and vice president of the United States. Colorado was won by incumbent United States President Ronald Reagan of California, who was running against former Vice President Walter Mondale of Minnesota. Reagan ran for a second time with incumbent Vice President and former C.I.A. Director George H. W. Bush of Texas, and Mondale ran with Representative Geraldine Ferraro of New York, the first major female candidate for the vice presidency.
The 1984 United States presidential election in North Dakota took place on November 6, 1984. All 50 states and the District of Columbia, were part of the 1984 United States presidential election. State voters chose three electors to the Electoral College, which selected the president and vice president of the United States. North Dakota was won by incumbent United States President Ronald Reagan of California, who was running against former Vice President Walter Mondale of Minnesota. Reagan ran for a second time with former C.I.A. Director George H. W. Bush of Texas, and Mondale ran with Representative Geraldine Ferraro of New York, the first major female candidate for the vice presidency.
The 1984 United States presidential election in Wisconsin took place on November 6, 1984. All 50 states and the District of Columbia, were part of the 1984 United States presidential election. State voters chose 11 electors to the Electoral College, which selected the president and vice president of the United States.
The 1984 United States presidential election in Virginia took place on November 6, 1984. All 50 states and the District of Columbia, were part of the 1984 United States presidential election. Virginia voters chose 12 electors to the Electoral College, which selected the president and vice president of the United States.
The 1980 United States presidential election in Michigan took place on November 4, 1980. All fifty states and The District of Columbia were part of the 1980 United States presidential election. Voters chose 21 electors to the Electoral College, who voted for president and vice president.
The 1976 United States presidential election in Michigan was held on November 2, 1976, as part of the 1976 United States presidential election.
The 2020 United States presidential election in Michigan was held on Tuesday, November 3, 2020, as part of the 2020 United States presidential election in which all 50 states plus the District of Columbia participated. Michigan voters chose electors to represent them in the Electoral College via a popular vote, pitting the Republican Party's nominee, incumbent President Donald Trump of Florida, and his running mate, Vice President Mike Pence of Indiana against the Democratic Party nominee, former Vice President Joe Biden of Delaware, and his running mate, Senator Kamala Harris of California. Michigan had 16 electoral votes in the Electoral College.